Incorporating spatial autocorrelation into soil salinity models: Insights from the Minqin Oasis and its desert-oasis transition zone in Northwest China
ZHAO Dan1,2,3, YANG Xiya1,3, GAO Yukun1,2,3, PAN Jing1,3, YOU Quangang1,3, XUE Xian1,3,*()
1State Key Laboratory of Ecological Safety and Sustainable Development in Arid Lands, Lanzhou 730000, China 2University of Chinese Academy of Sciences, Beijing 101408, China 3Drylands Salinization Research Station, Northwest Institute of Eco-environment & Resources, Chinese Academy of Sciences, Lanzhou 730000, China
Remote sensing-based soil salinity inversion serves as a crucial approach for monitoring and assessment in arid regions. However, most existing models rarely account for the spatial autocorrelation (SAC) of soil salinity, which limits both their predictive accuracy and ability to capture spatial patterns. To address this gap, this study investigated the Minqin Oasis and its adjacent desert-oasis transition zone in Northwest China. Based on collected field soil samples and concurrently acquired Landsat-8 OLI remote sensing images in 2024, we incorporated characteristic bands reflecting SAC into conventional spectral indices. Through multi-band combination optimization and comparison of different models' predictive performance, we constructed an optimal soil salinity inversion model for the Minqin Oasis and its adjacent desert-oasis transition zone. The results demonstrated that incorporating SAC of soil salinity markedly improved model performance, with the Gradient Boosting Regression Trees (GBRT) model incorporating SAC (GBRT_SAC) achieving the best accuracy. Compared with the traditional spectral index-based GBRT model, the coefficient of determination (R2) increased by 7.320%, the root mean square error (RMSE) decreased by 20.230%, and the mean absolute percentage error (MAPE) decreased by 121.01% using the GBRT_SAC model. The soil salinity distribution derived from the GBRT_SAC model revealed pronounced spatial heterogeneity, with salinized areas covering approximately 1256.75 km2 (36.170% of the total area). Soil salinity was jointly influenced by natural and anthropogenic factors. At the regional scale, soil type and vegetation type emerged as the dominant drivers shaping soil salinity patterns. In contrast, within the oasis interior, soil salinity was primarily driven by groundwater table regulated by irrigation, leading to surface salt accumulation through capillary rise. In the 1000 m desert-oasis transition zone, the explanatory power (q-value) of all environmental factors for spatial variation of soil salinity significantly increased, indicating a sensitive interface where hydrological and aeolian processes interact. Notably, although soil salinity was relatively lower in sandy areas, sand content emerged as the most influential factor in this region (q-value=0.483), effectively serving as a key indicator of the transitional environment. By introducing SAC-based features into soil salinity inversion models, this study provides a robust methodological framework and valuable data to support understanding and management of soil salinization in arid desert-oasis ecotone systems.
Received: 28 November 2025
Published: 31 July 2026
Conceptualization: ZHAO Dan, XUE Xian; Data curation: ZHAO Dan, YANG Xiya, GAO Yukun; Formal analysis: ZHAO Dan, YANG Xiya, PAN Jing, YOU Quangang; Investigation: ZHAO Dan, YANG Xiya, GAO Yukun; Methodology: ZHAO Dan, GAO Yukun; Resources: ZHAO Dan, YANG Xiya, GAO Yukun, PAN Jing, YOU Quangang, XUE Xian; Visualization: ZHAO Dan; Writing - original draft preparation: ZHAO Dan, XUE Xian; Writing - review and editing: XUE Xian; Funding acquisition: XUE Xian; Supervision: PAN Jing, YOU Quangang, XUE Xian. All authors approved the manuscript.
ZHAO Dan, YANG Xiya, GAO Yukun, PAN Jing, YOU Quangang, XUE Xian. Incorporating spatial autocorrelation into soil salinity models: Insights from the Minqin Oasis and its desert-oasis transition zone in Northwest China. Journal of Arid Land, 2026, 18(7): 1135-1158.
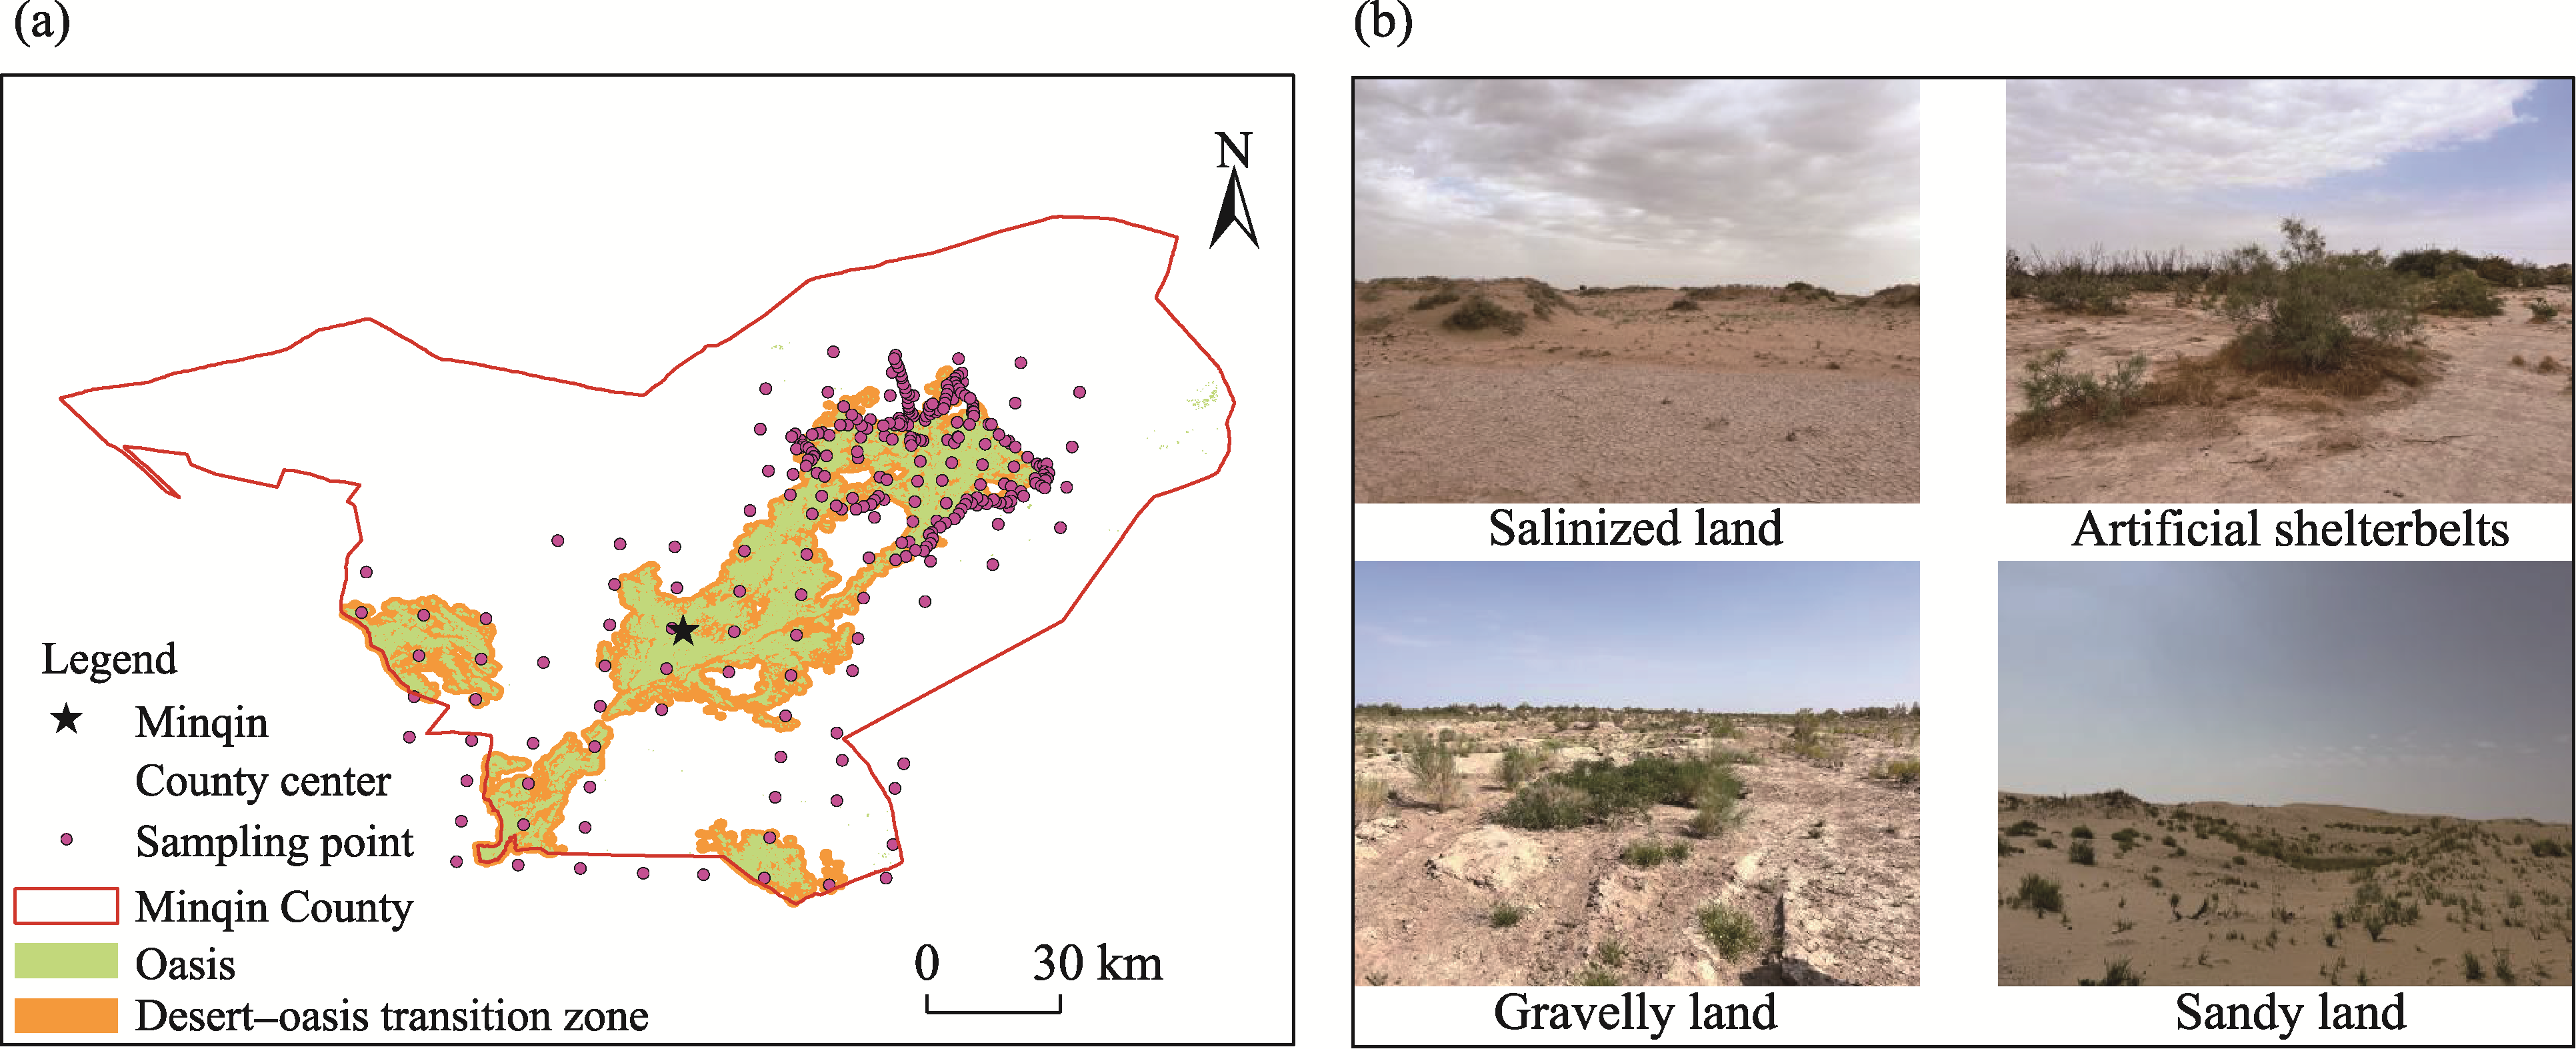
Fig. 1Overview of the study area (Minqin Oasis and its adjacent desert-oasis transition zone) and distribution of sampling points (a), and photos showing different land use/cover types in the study area (b)
Level
Soil salinity class
EC (dS/m)
Level 1
Non-salinization
<2.000
Level 2
Light salinization
2.000-4.000
Level 3
Moderate salinization
4.000-8.000
Level 4
Severe salinization
8.000-16.000
Level 5
Extreme salinization (saline soil)
>16.000
Table 1 Classification of soil salinity based on electrical conductivity (EC)
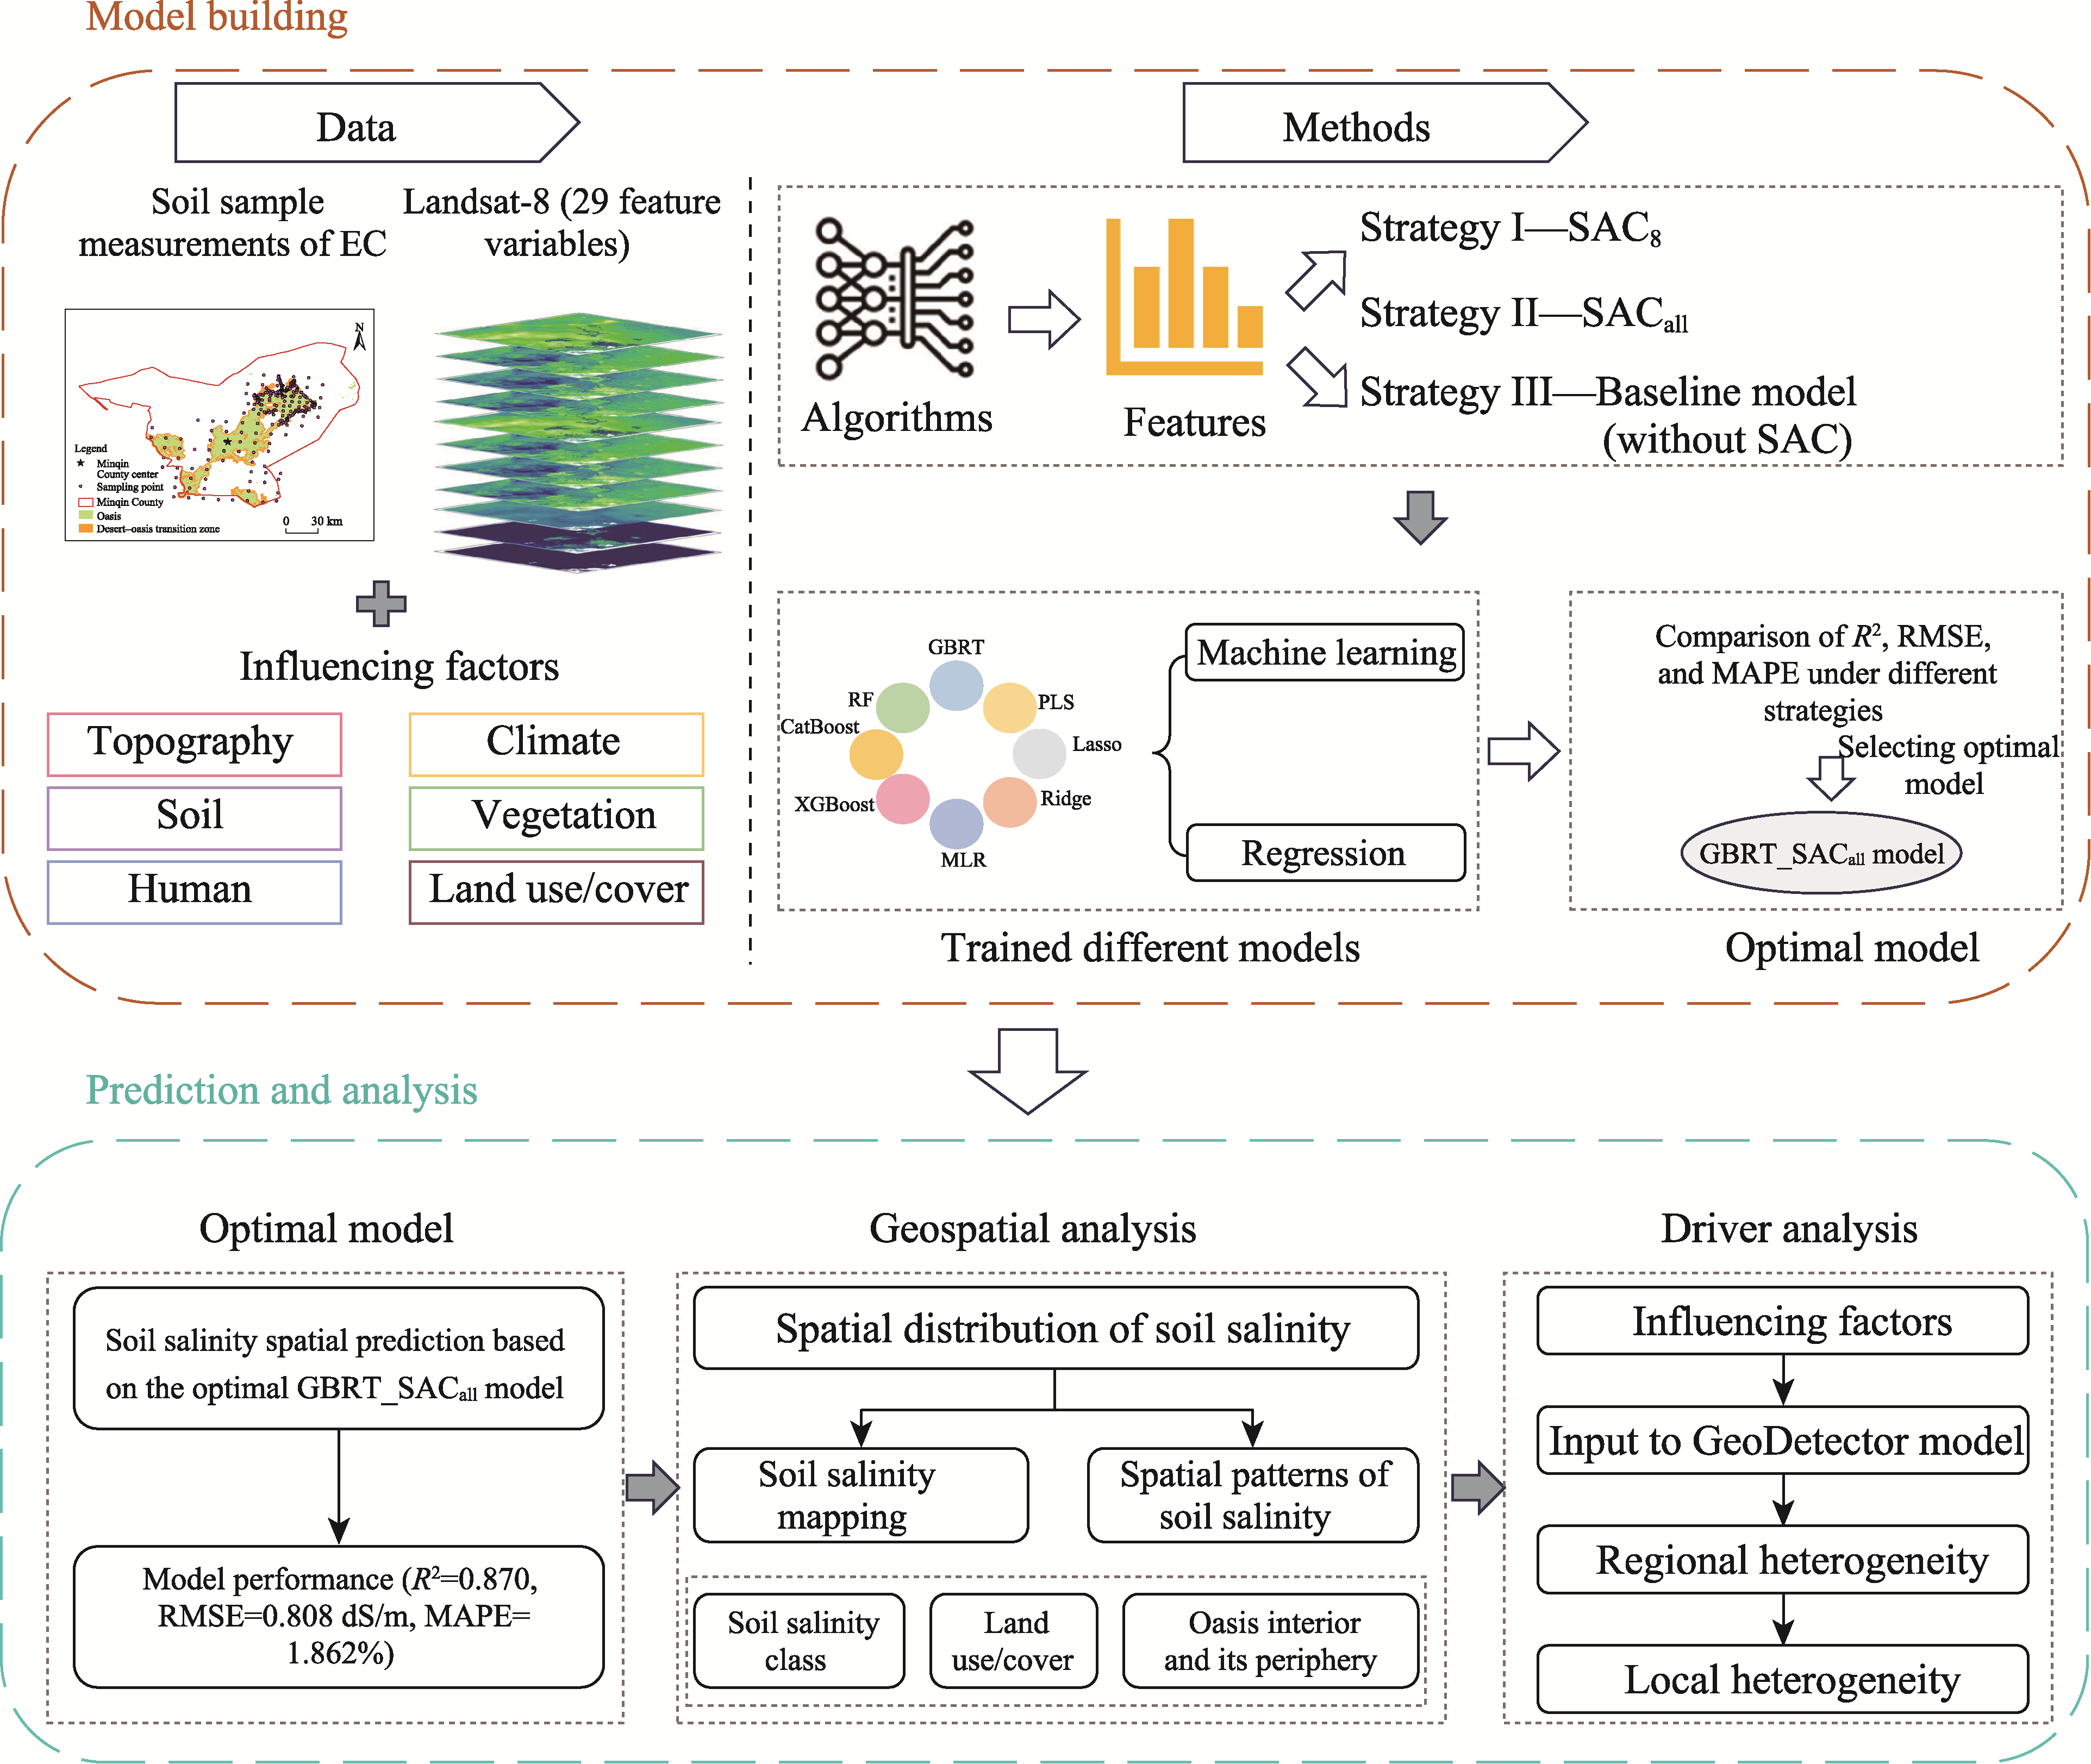
Fig. 2Workflow of this study. EC, electrical conductivity; SAC, spatial autocorrelation; SAC8, local spatial autocorrelation; SACall, global spatial autocorrelation; MLR, multiple linear regression; PLS, partial least squares regression; Ridge, ridge regression; Lasso, least absolute shrinkage and selection operator regression; CatBoost, categorical boosting; GBRT, gradient boosting regression trees; XGBoost, eXtreme Gradient Boosting; RF, random forest; R2, coefficient of determination; RMSE, root mean square error; MAPE, mean absolute percentage error.
Soil salinity class
Number of samples
Mean (dS/m)
SD (dS/m)
CV (%)
Min. (dS/m)
Max. (dS/m)
Median (dS/m)
Non-salinization
169
0.490
0.526
107.276
0.049
1.993
0.238
Light salinization
33
2.947
0.599
20.336
2.040
3.980
2.830
Moderate salinization
36
5.953
1.013
17.014
4.150
7.920
5.860
Severe salinization
26
11.270
2.320
20.590
8.010
15.590
11.345
Extreme salinization (saline soil)
10
21.285
3.785
17.782
16.030
25.600
21.775
All samples
274
3.286
5.004
152.288
0.049
25.600
1.086
Table 3 Descriptive statistics of soil EC
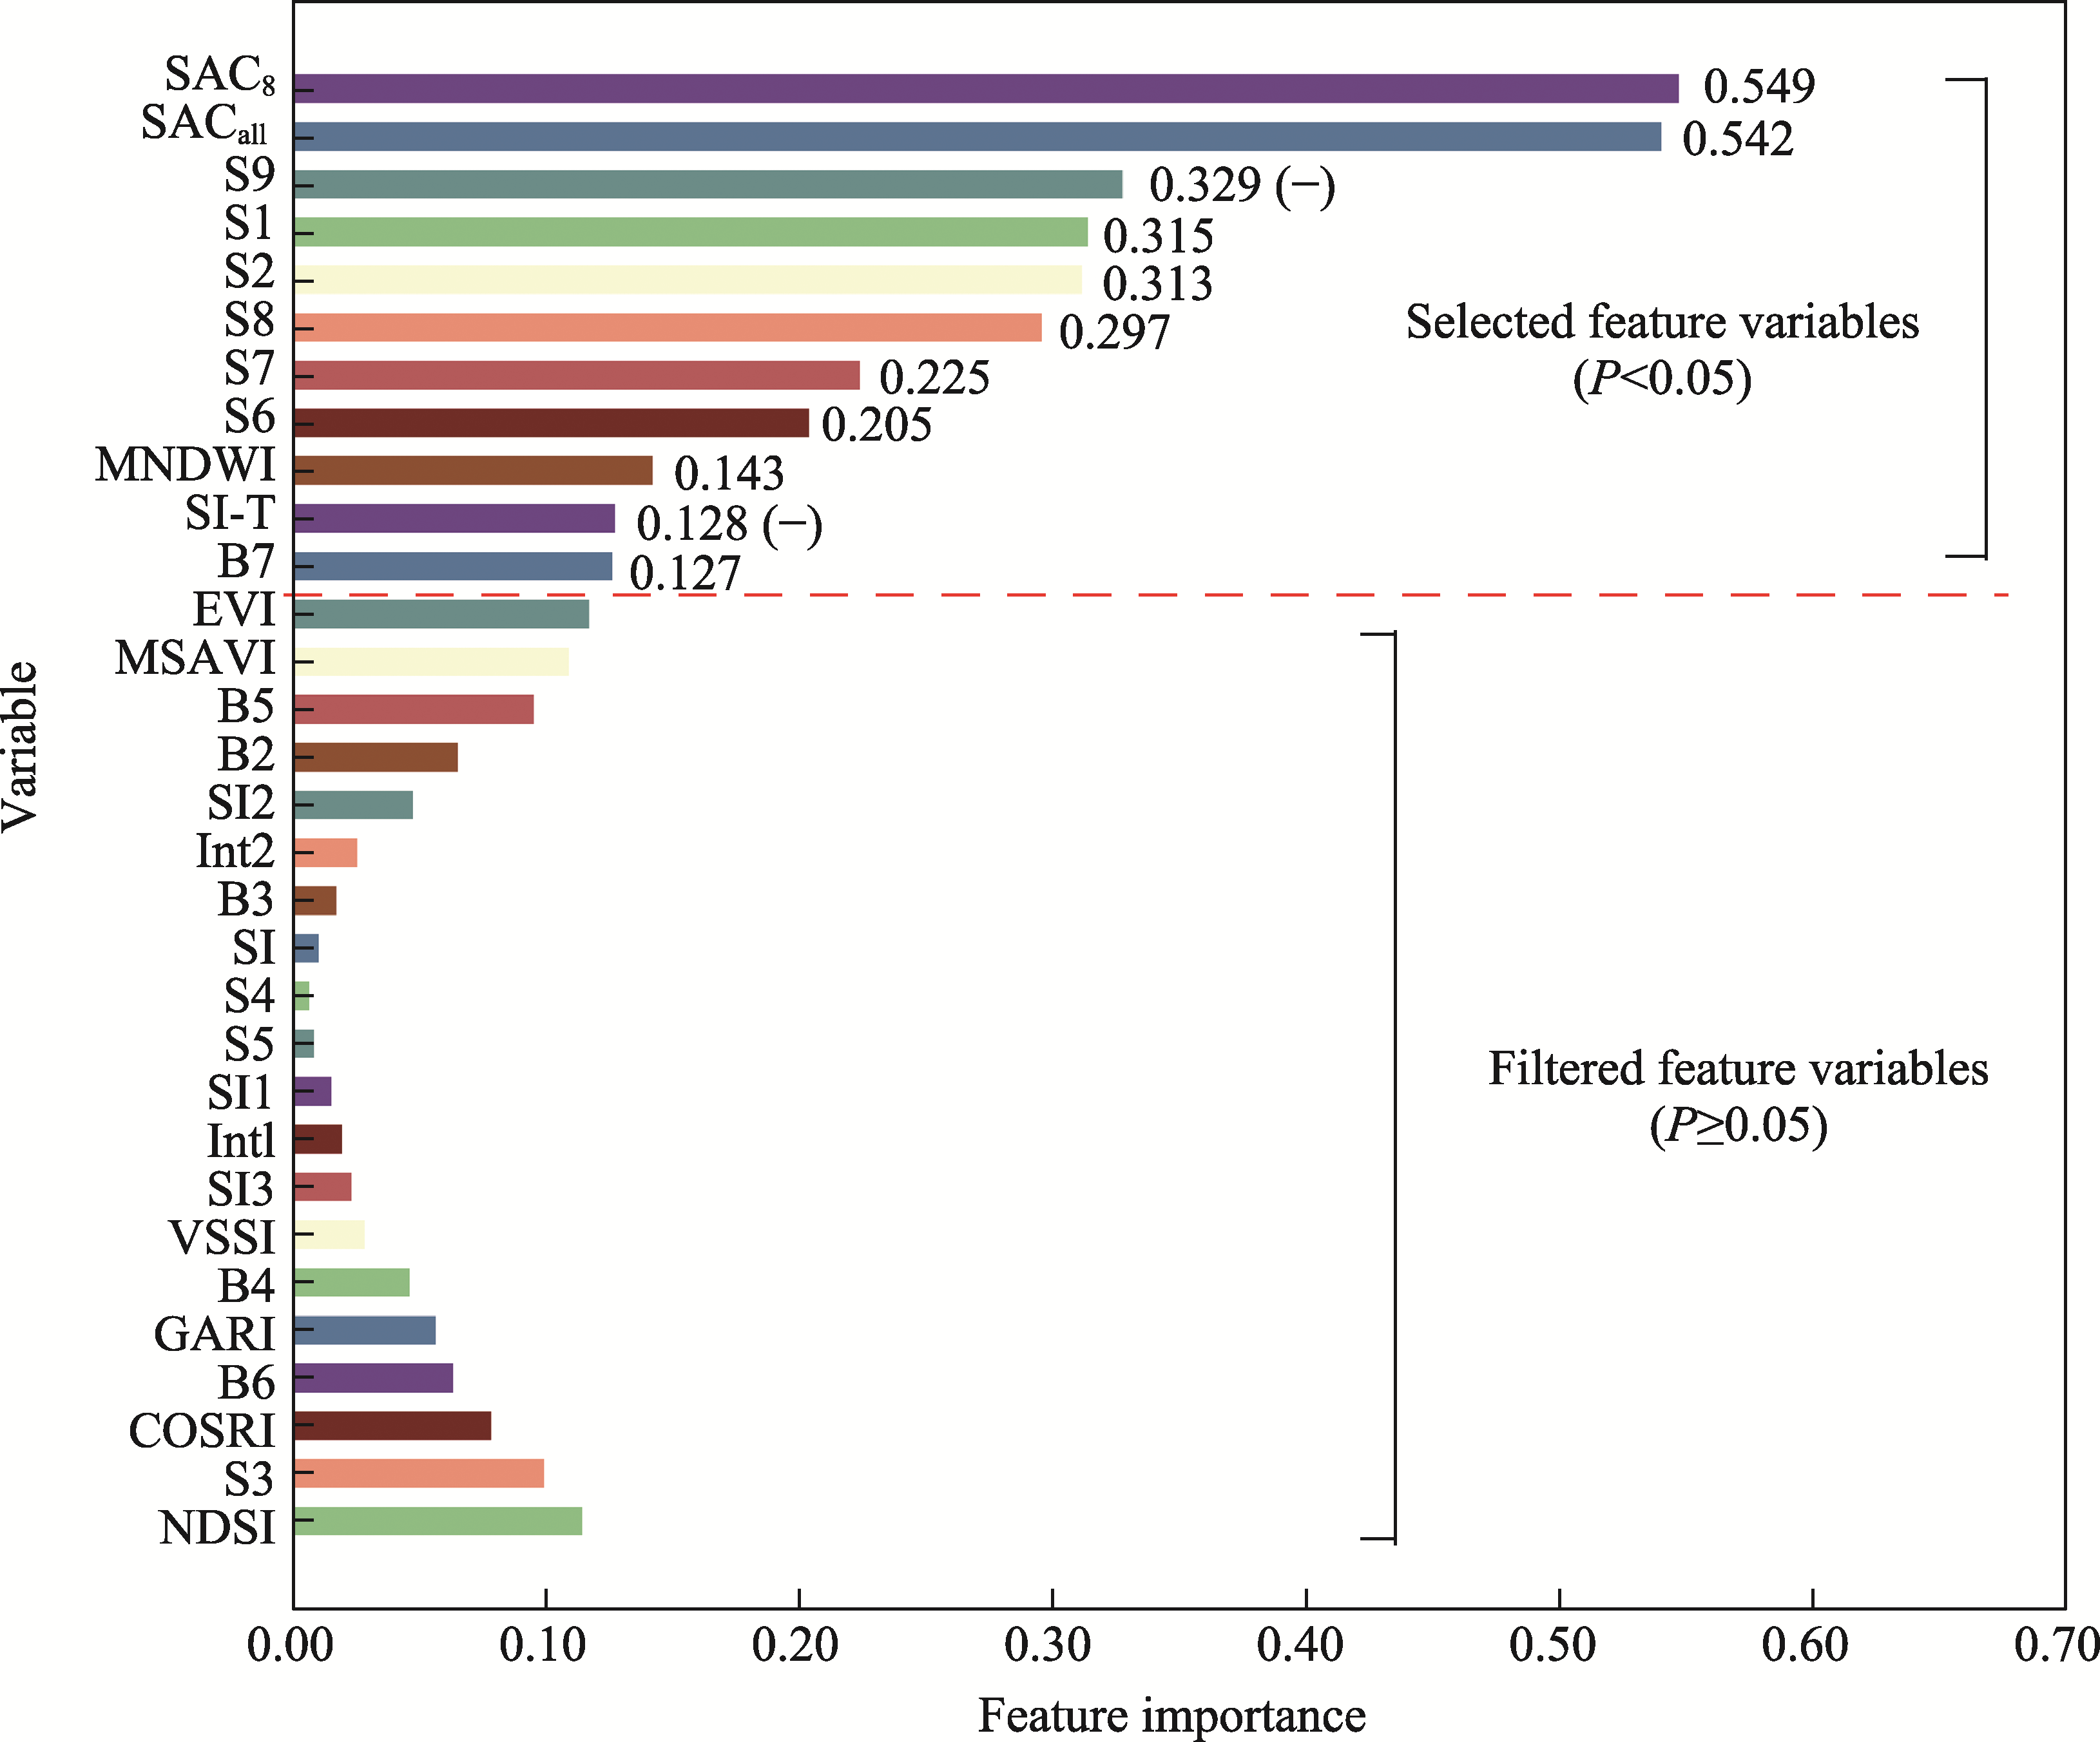
Fig. 3Importance ranking of soil salinity feature variables based on Pearson correlation analysis (ranked by absolute correlation coefficients). Variables with a negative correlation are marked with a ''(-)''. S1-S9, salinity index 1-salinity index 9, respectively; MNDWI, modified normalized difference water index; SI-T, salinity index I-T; B7, Shortwave Infrared 2 band; EVI, enhanced vegetation index; MSAVI, modified soil adjusted vegetation index; B5, Near-infrared band; B2, Blue band; SI2, salinity index II; Int2, intensity index 2; B3, Green band; SI, salinity index; SI1, salinity index I; Int1, intensity index 1; SI3, salinity index III; VSSI, vegetation soil salinity index; B4, Red band; GARI, green atmospherically resistant vegetation index; B6, Shortwave Infrared 1 band; COSRI, canopy response salinity index; NDSI, normalized difference salinity index. Variables were grouped by significance: correlated (significantly correlated with soil salinity at P<0.05 level) and not correlated (not significantly correlated with soil salinity at P≥0.05 level).
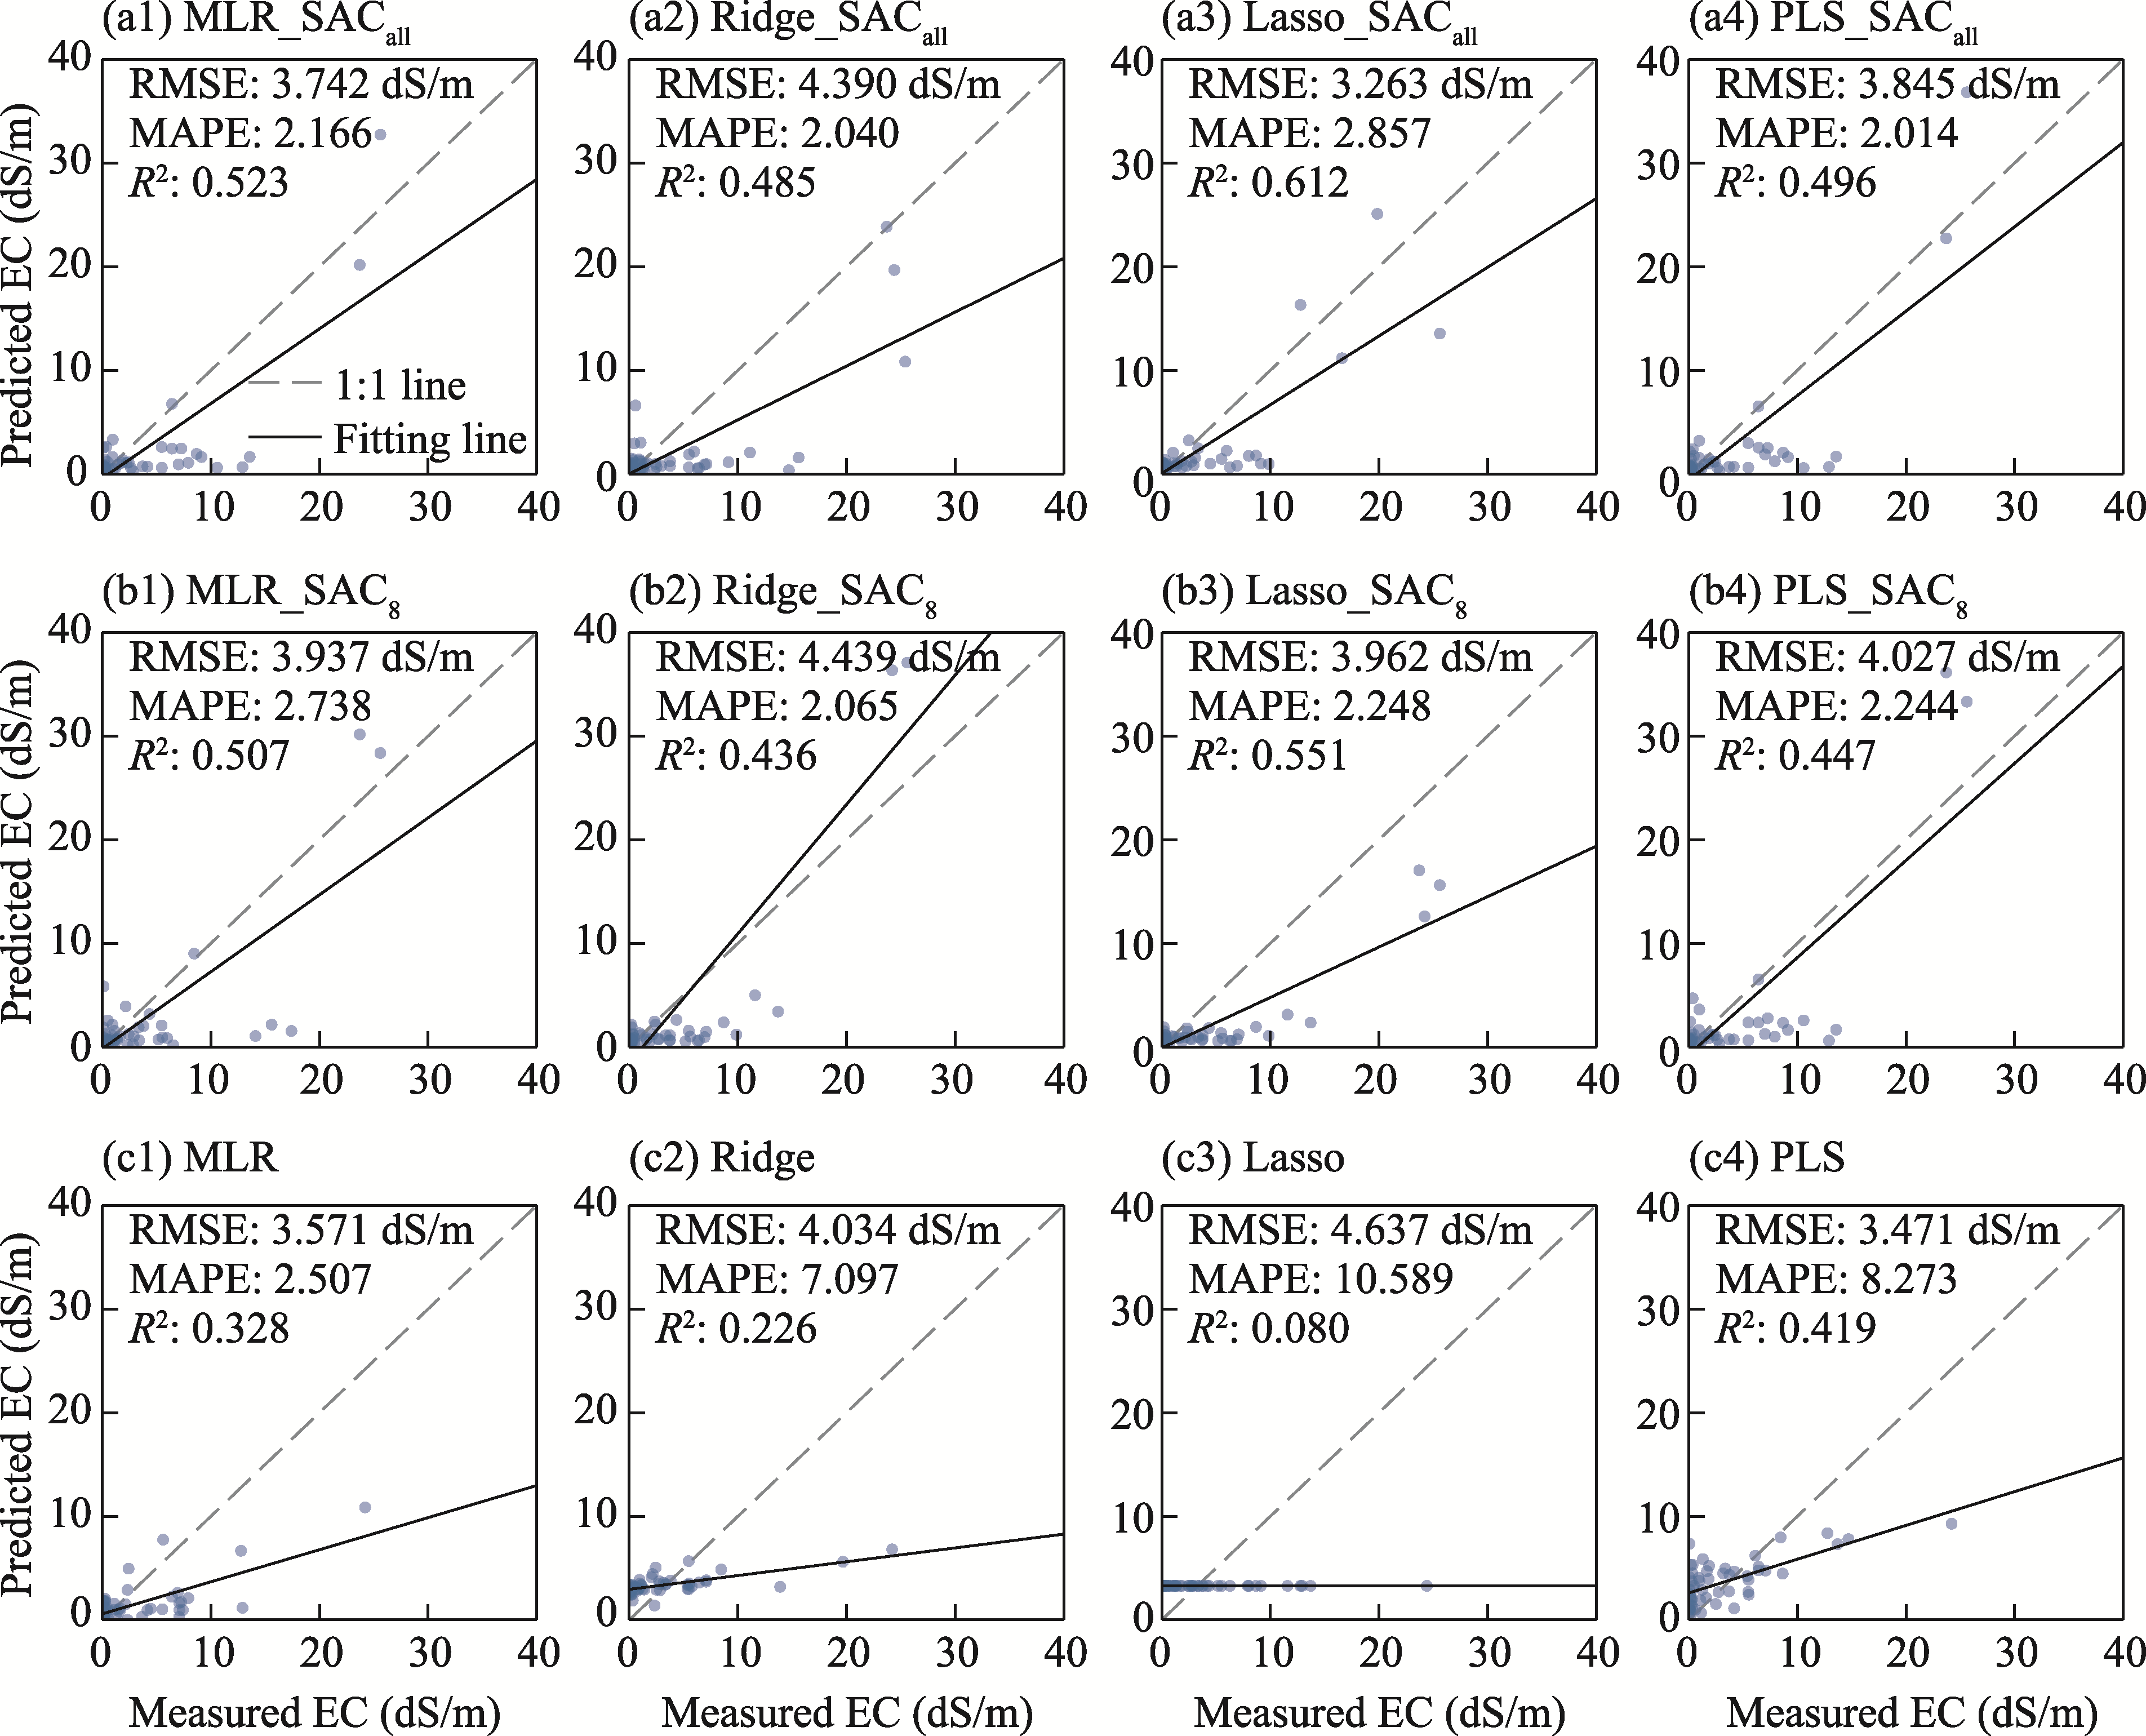
Fig. 4Scatter plots of predicted and measured soil EC using four regression models with different feature strategies. (a1-a4), MLR, Ridge, Lasso, and PLS models with adding SACall, respectively; (b1-b4), MLR, Ridge, Lasso, and PLS models with adding SAC8, respectively; (c), MLR, Ridge, Lasso, and PLS models without adding SAC, respectively. R2, RMSE, and MAPE denote the performance evaluation metrics.
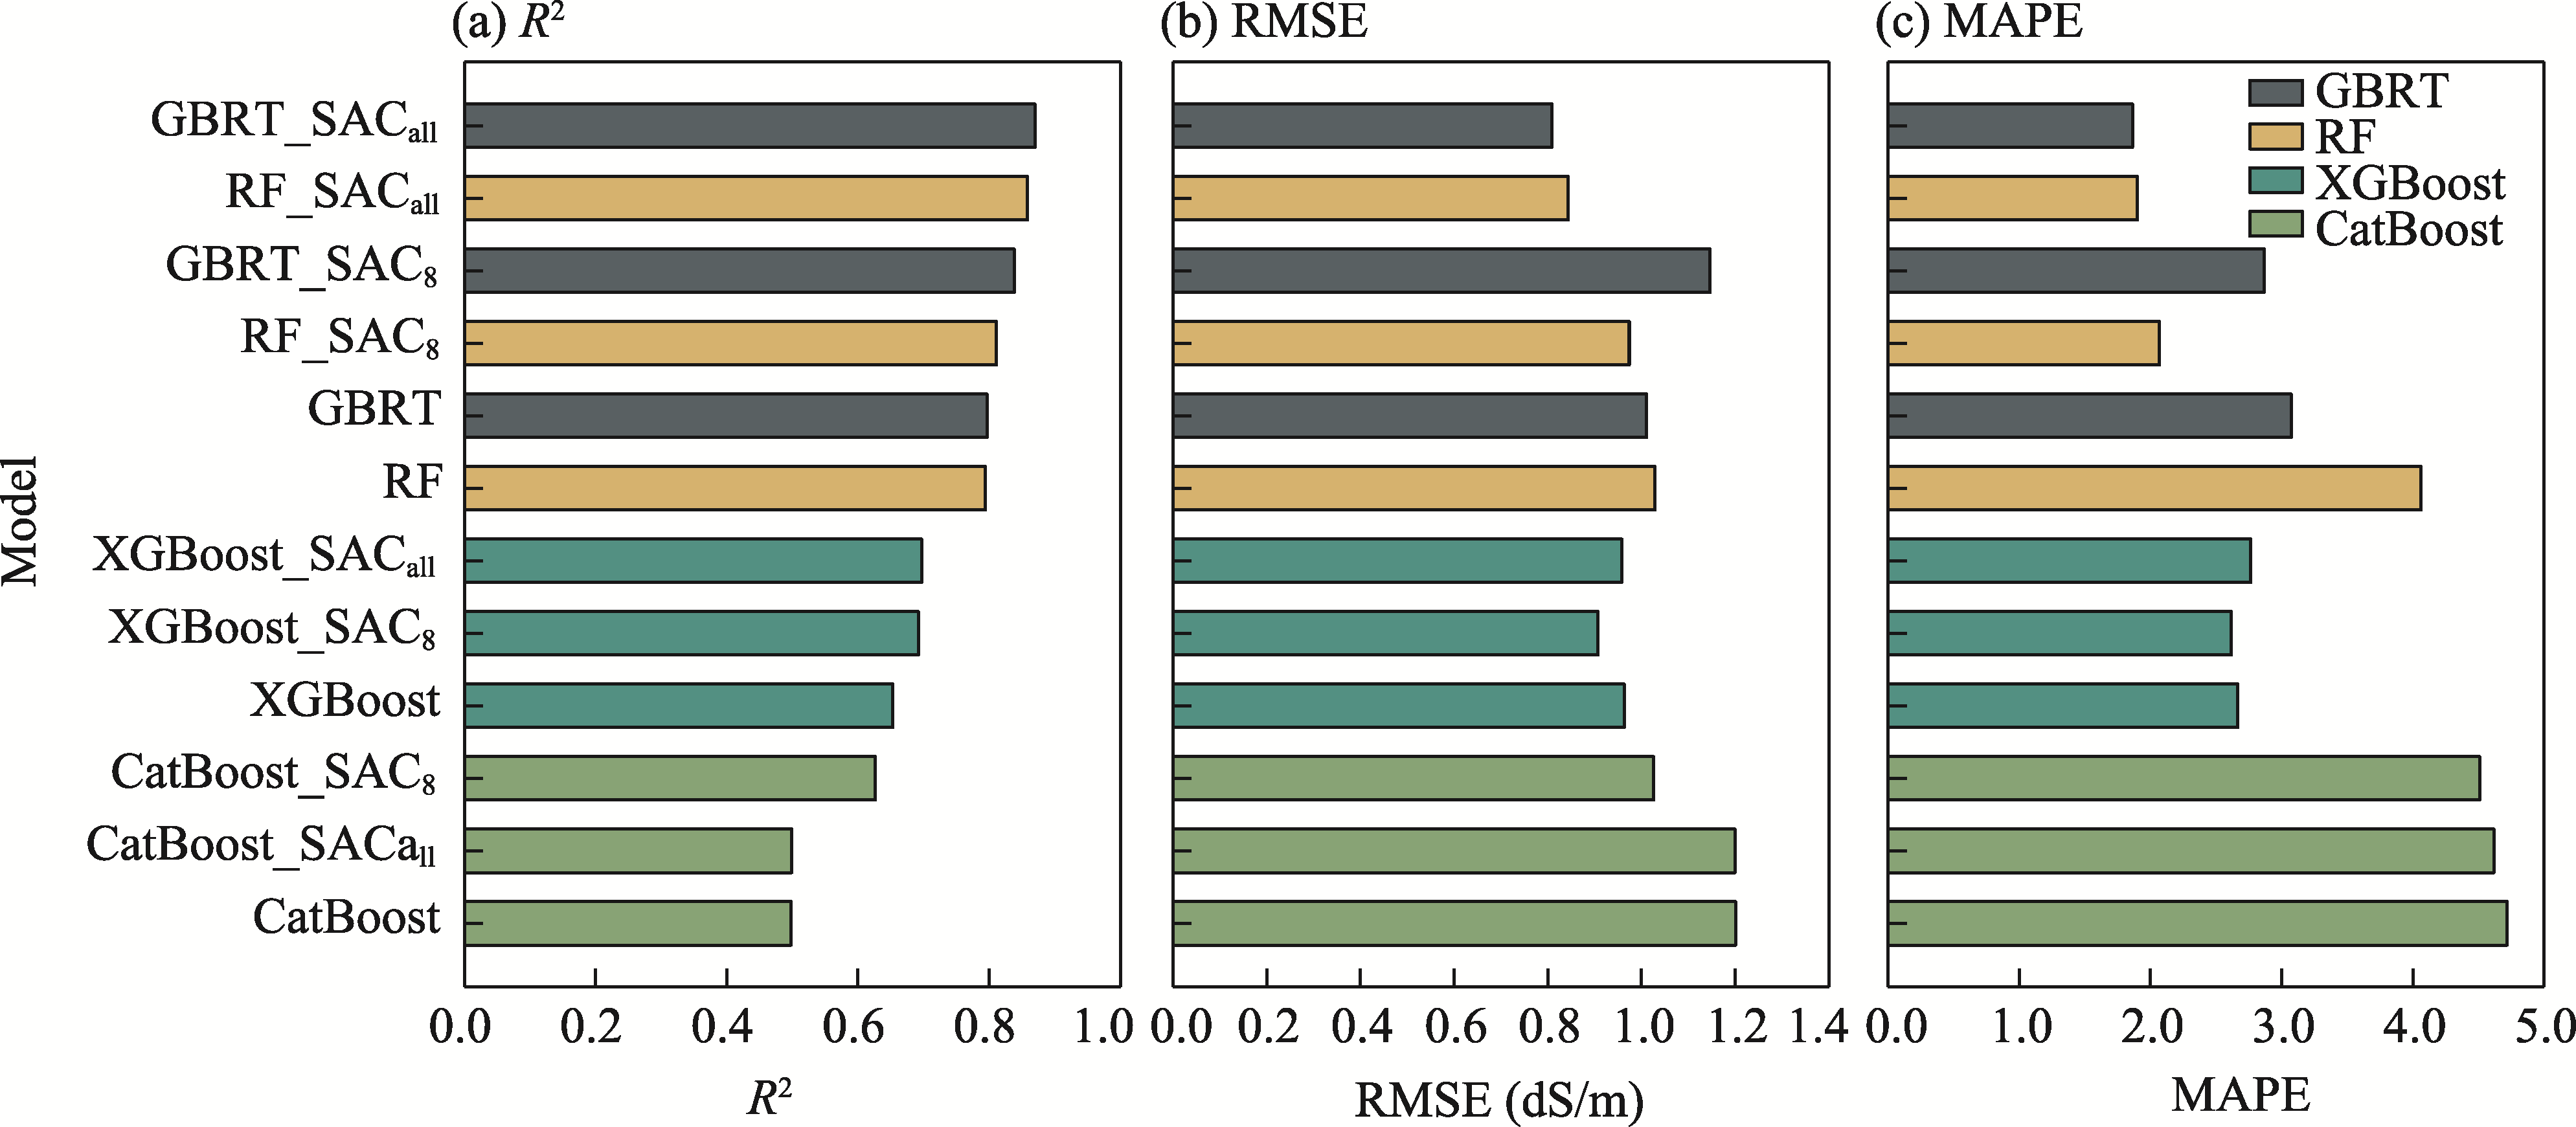
Fig. 5Comparison of the predictive performance of different machine learning models with different feature strategies (models without adding SAC, with adding SAC8, and with adding SACall). (a), R2; (b), RMSE; (c), MAPE.
Fig. 6Spatial distribution of land use/cover (a), soil pH (b), EC (c), soil salinity class (d), clay content (e), and sand content (f) in the study area
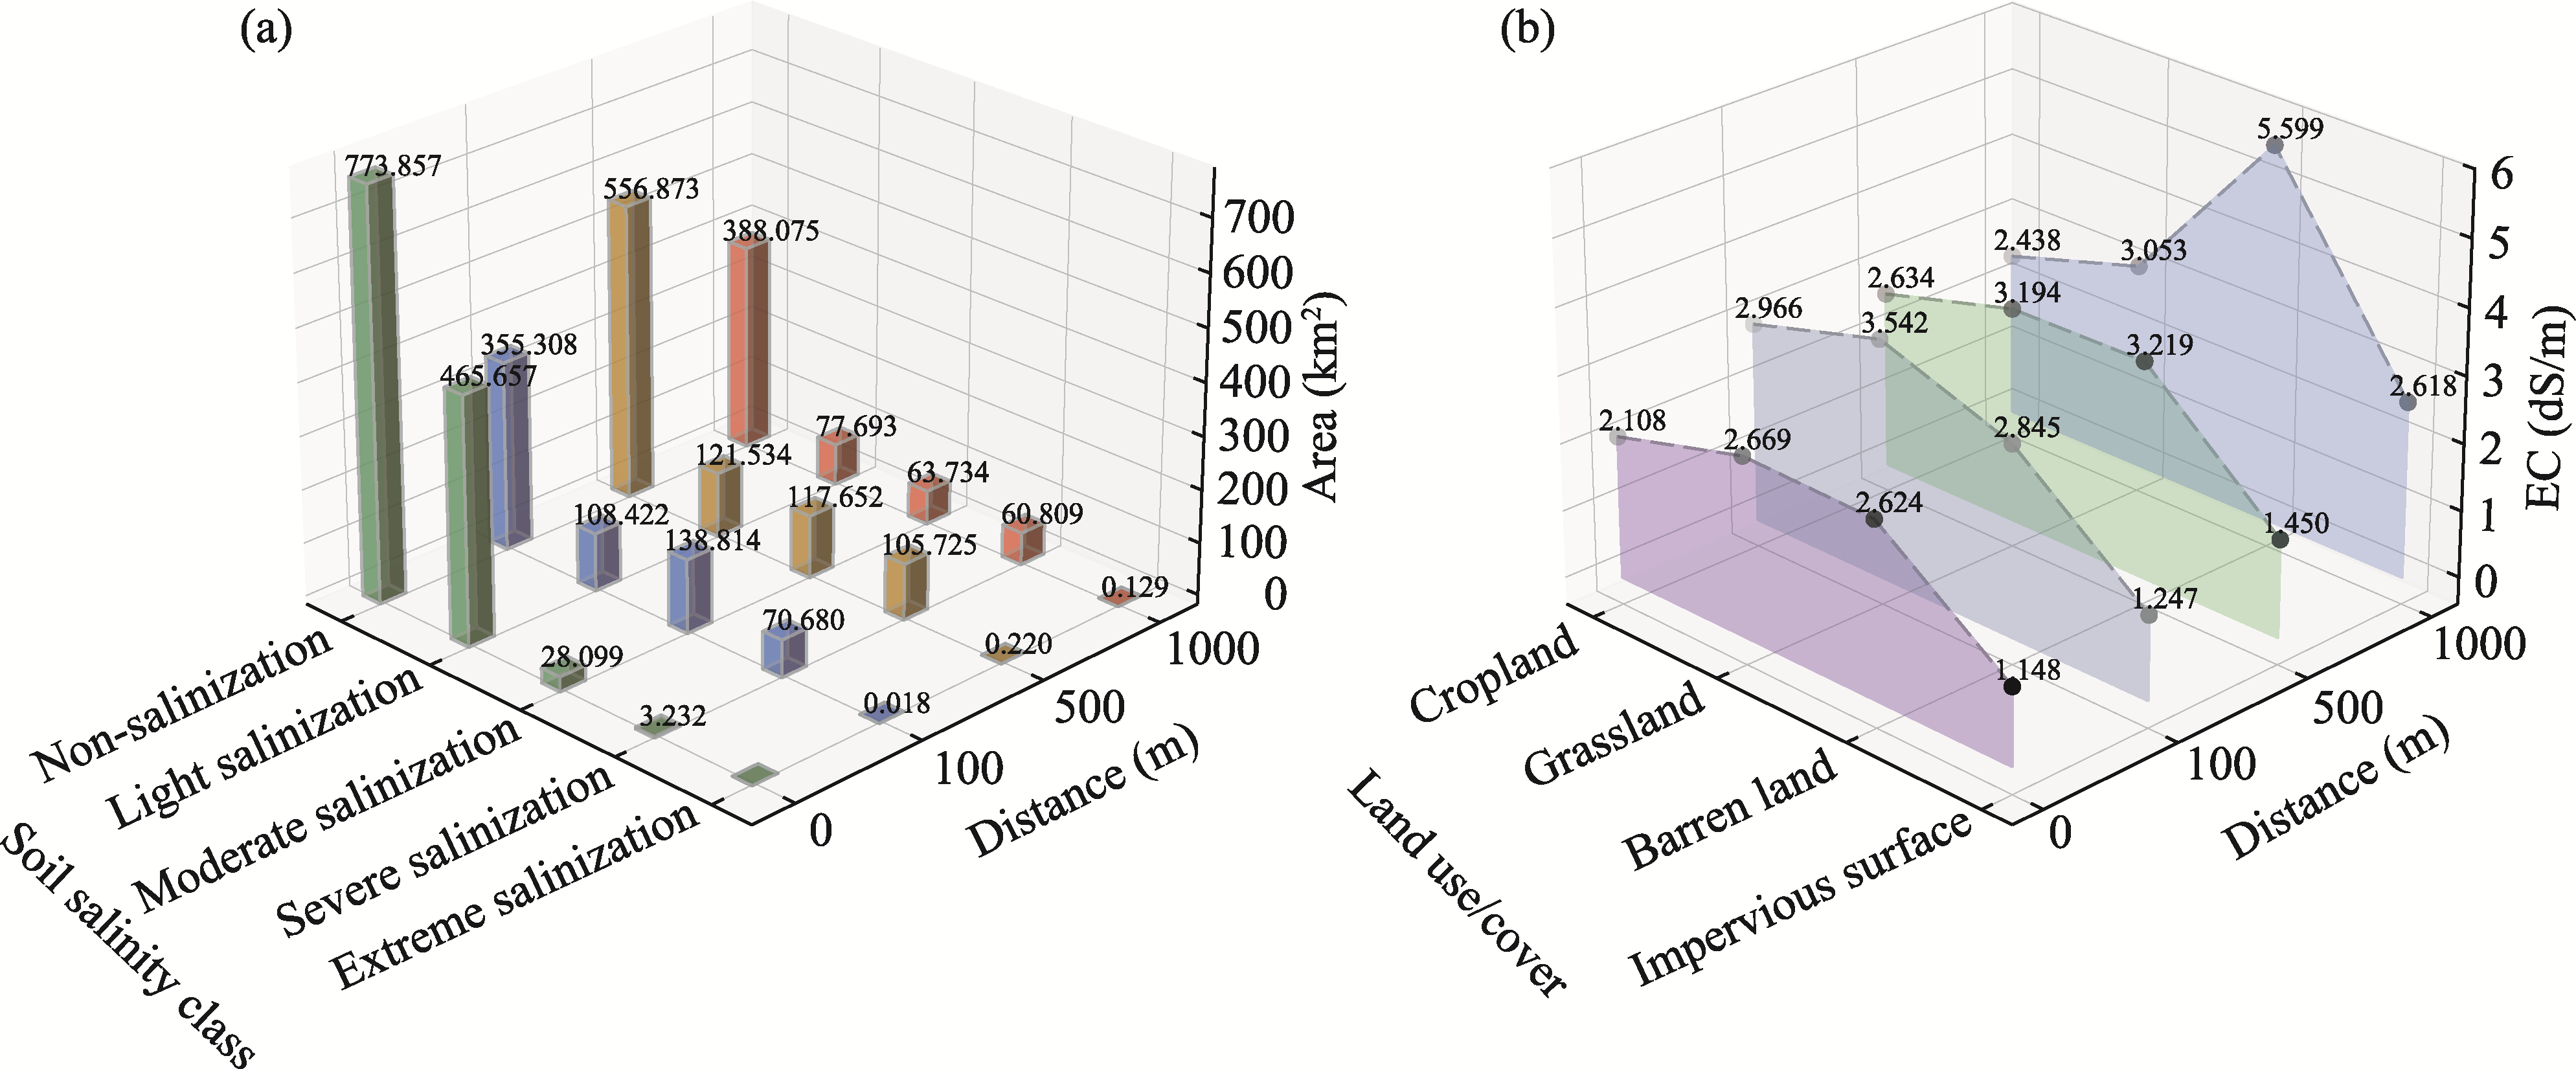
Fig. 7Area distribution of soil salinity classes with distance from the oasis boundary (a), and soil salinity variation across different land use/cover types with distance from the oasis boundary (b). In the right panel, the colored filled surfaces represent the continuous trend surfaces of EC for each land use/cover type, illustrating the spatial variation of soil salinity.
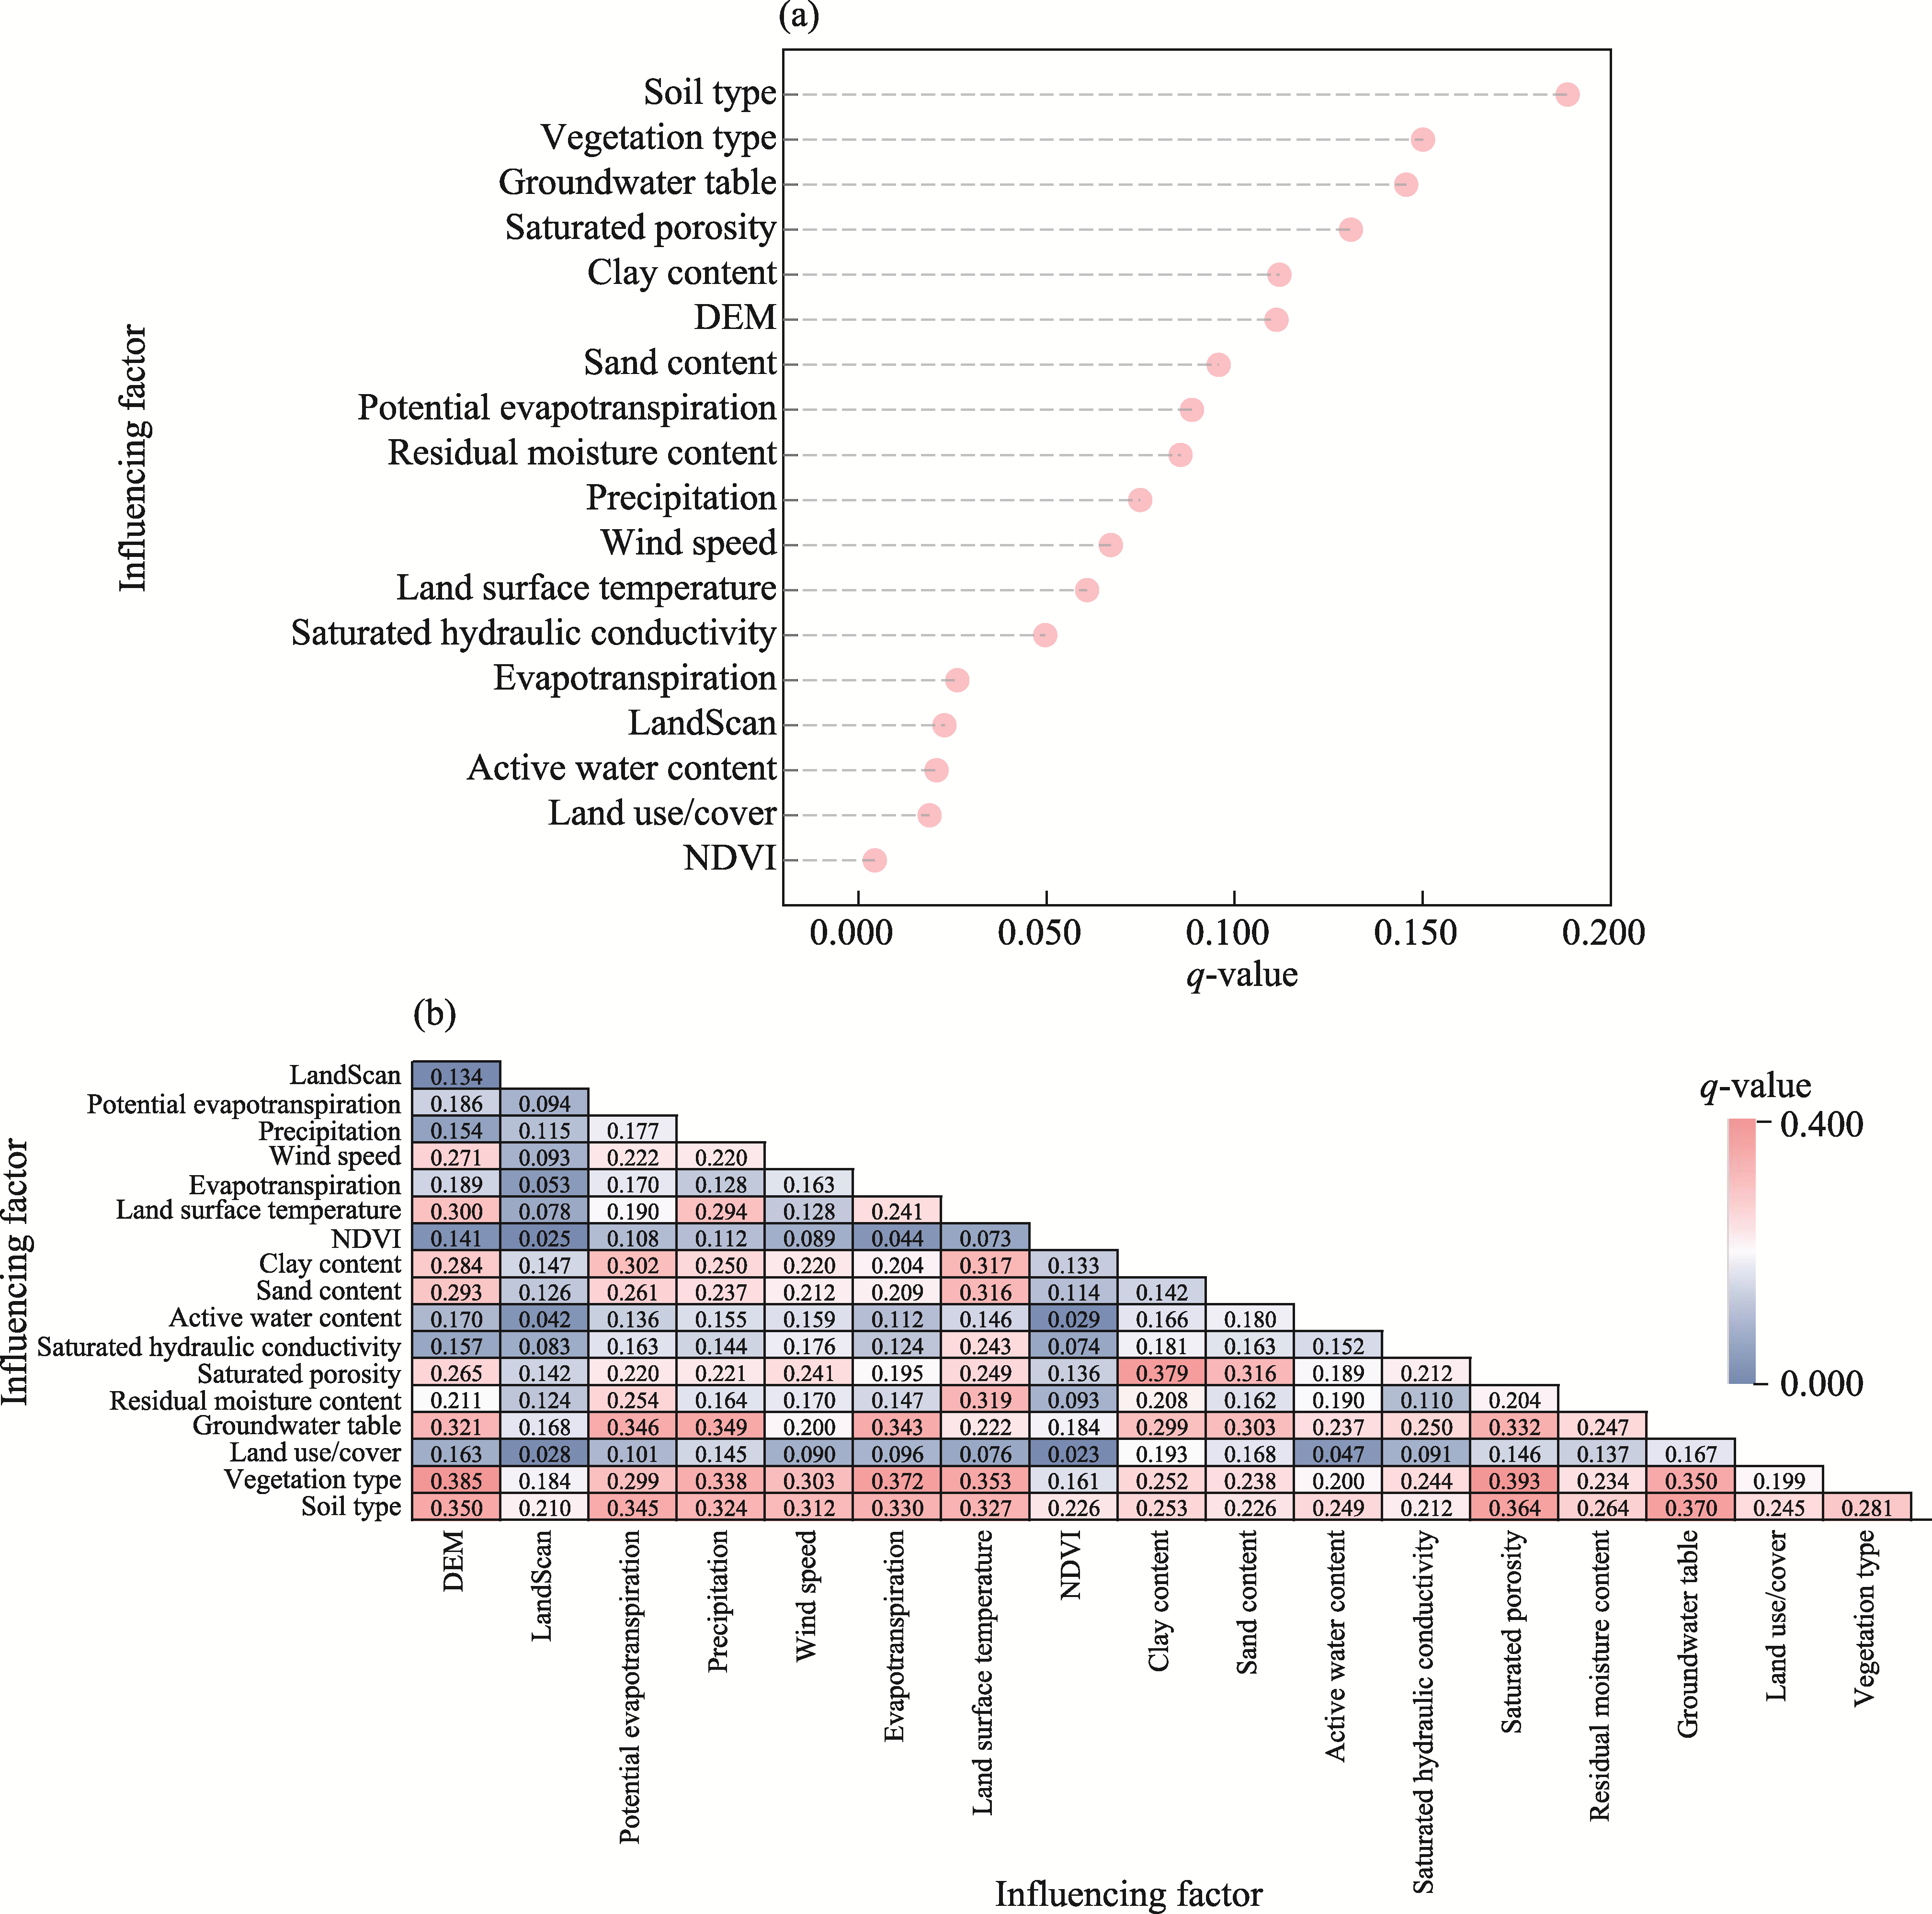
Fig. 8Analysis of the driving mechanism of soil salinity using the GeoDetector model. (a), explanatory power (q-value) of individual influencing factors derived from the Factor Detector analysis; (b), interactive effects between pairs of influencing factors derived from the Interaction Detector analysis. The color gradient represents the magnitude of the interaction strength. NDVI, normalized difference vegetation index.
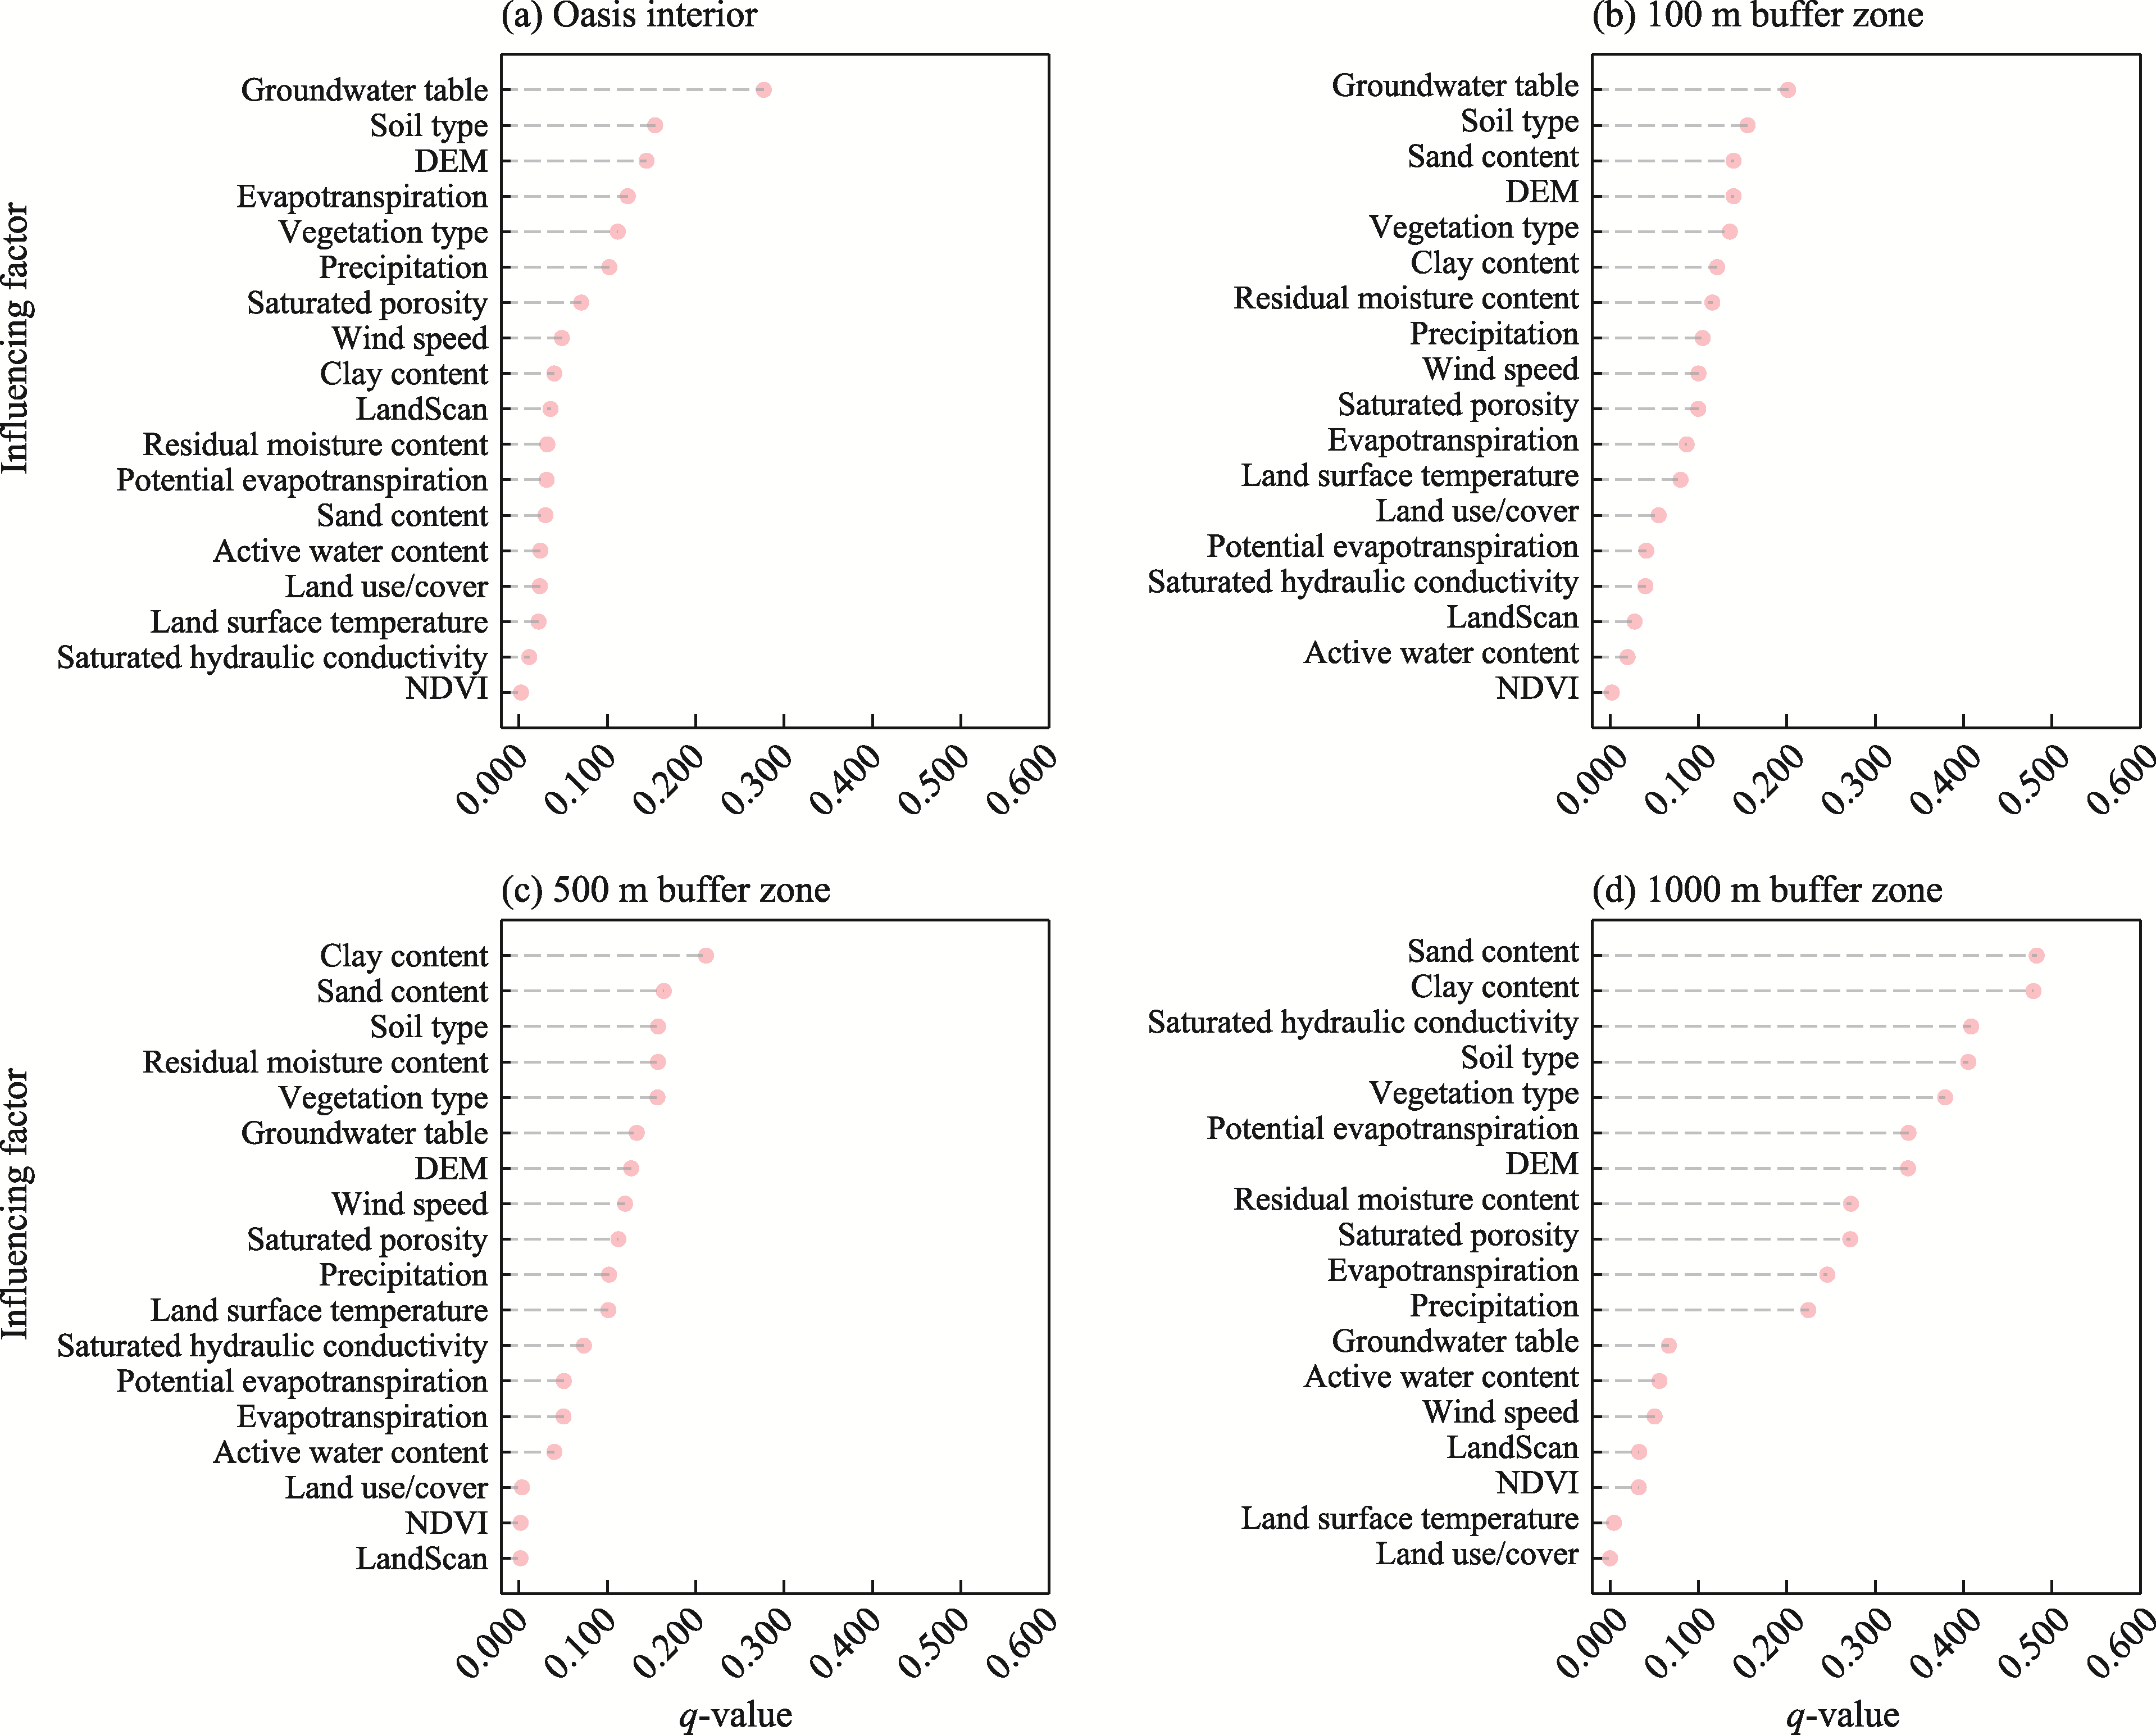
Fig. 9Explanatory power (q-value) of influencing factors affecting soil salinity changes at different distances from the oasis boundary based on Factor Detection analysis. (a), oasis interior (the original Minqin Oasis boundary, i.e., only the oasis interior area); (b), 100 m buffer zone (the oasis interior plus a 100 m buffer zone extending outward from the oasis perimeter); (c) 500 m buffer zone (the oasis interior plus a 500 m buffer zone extending outward from the oasis perimeter); (d), 1000 m buffer zone (the oasis interior plus a 1000 m buffer zone extending outward from the oasis perimeter.
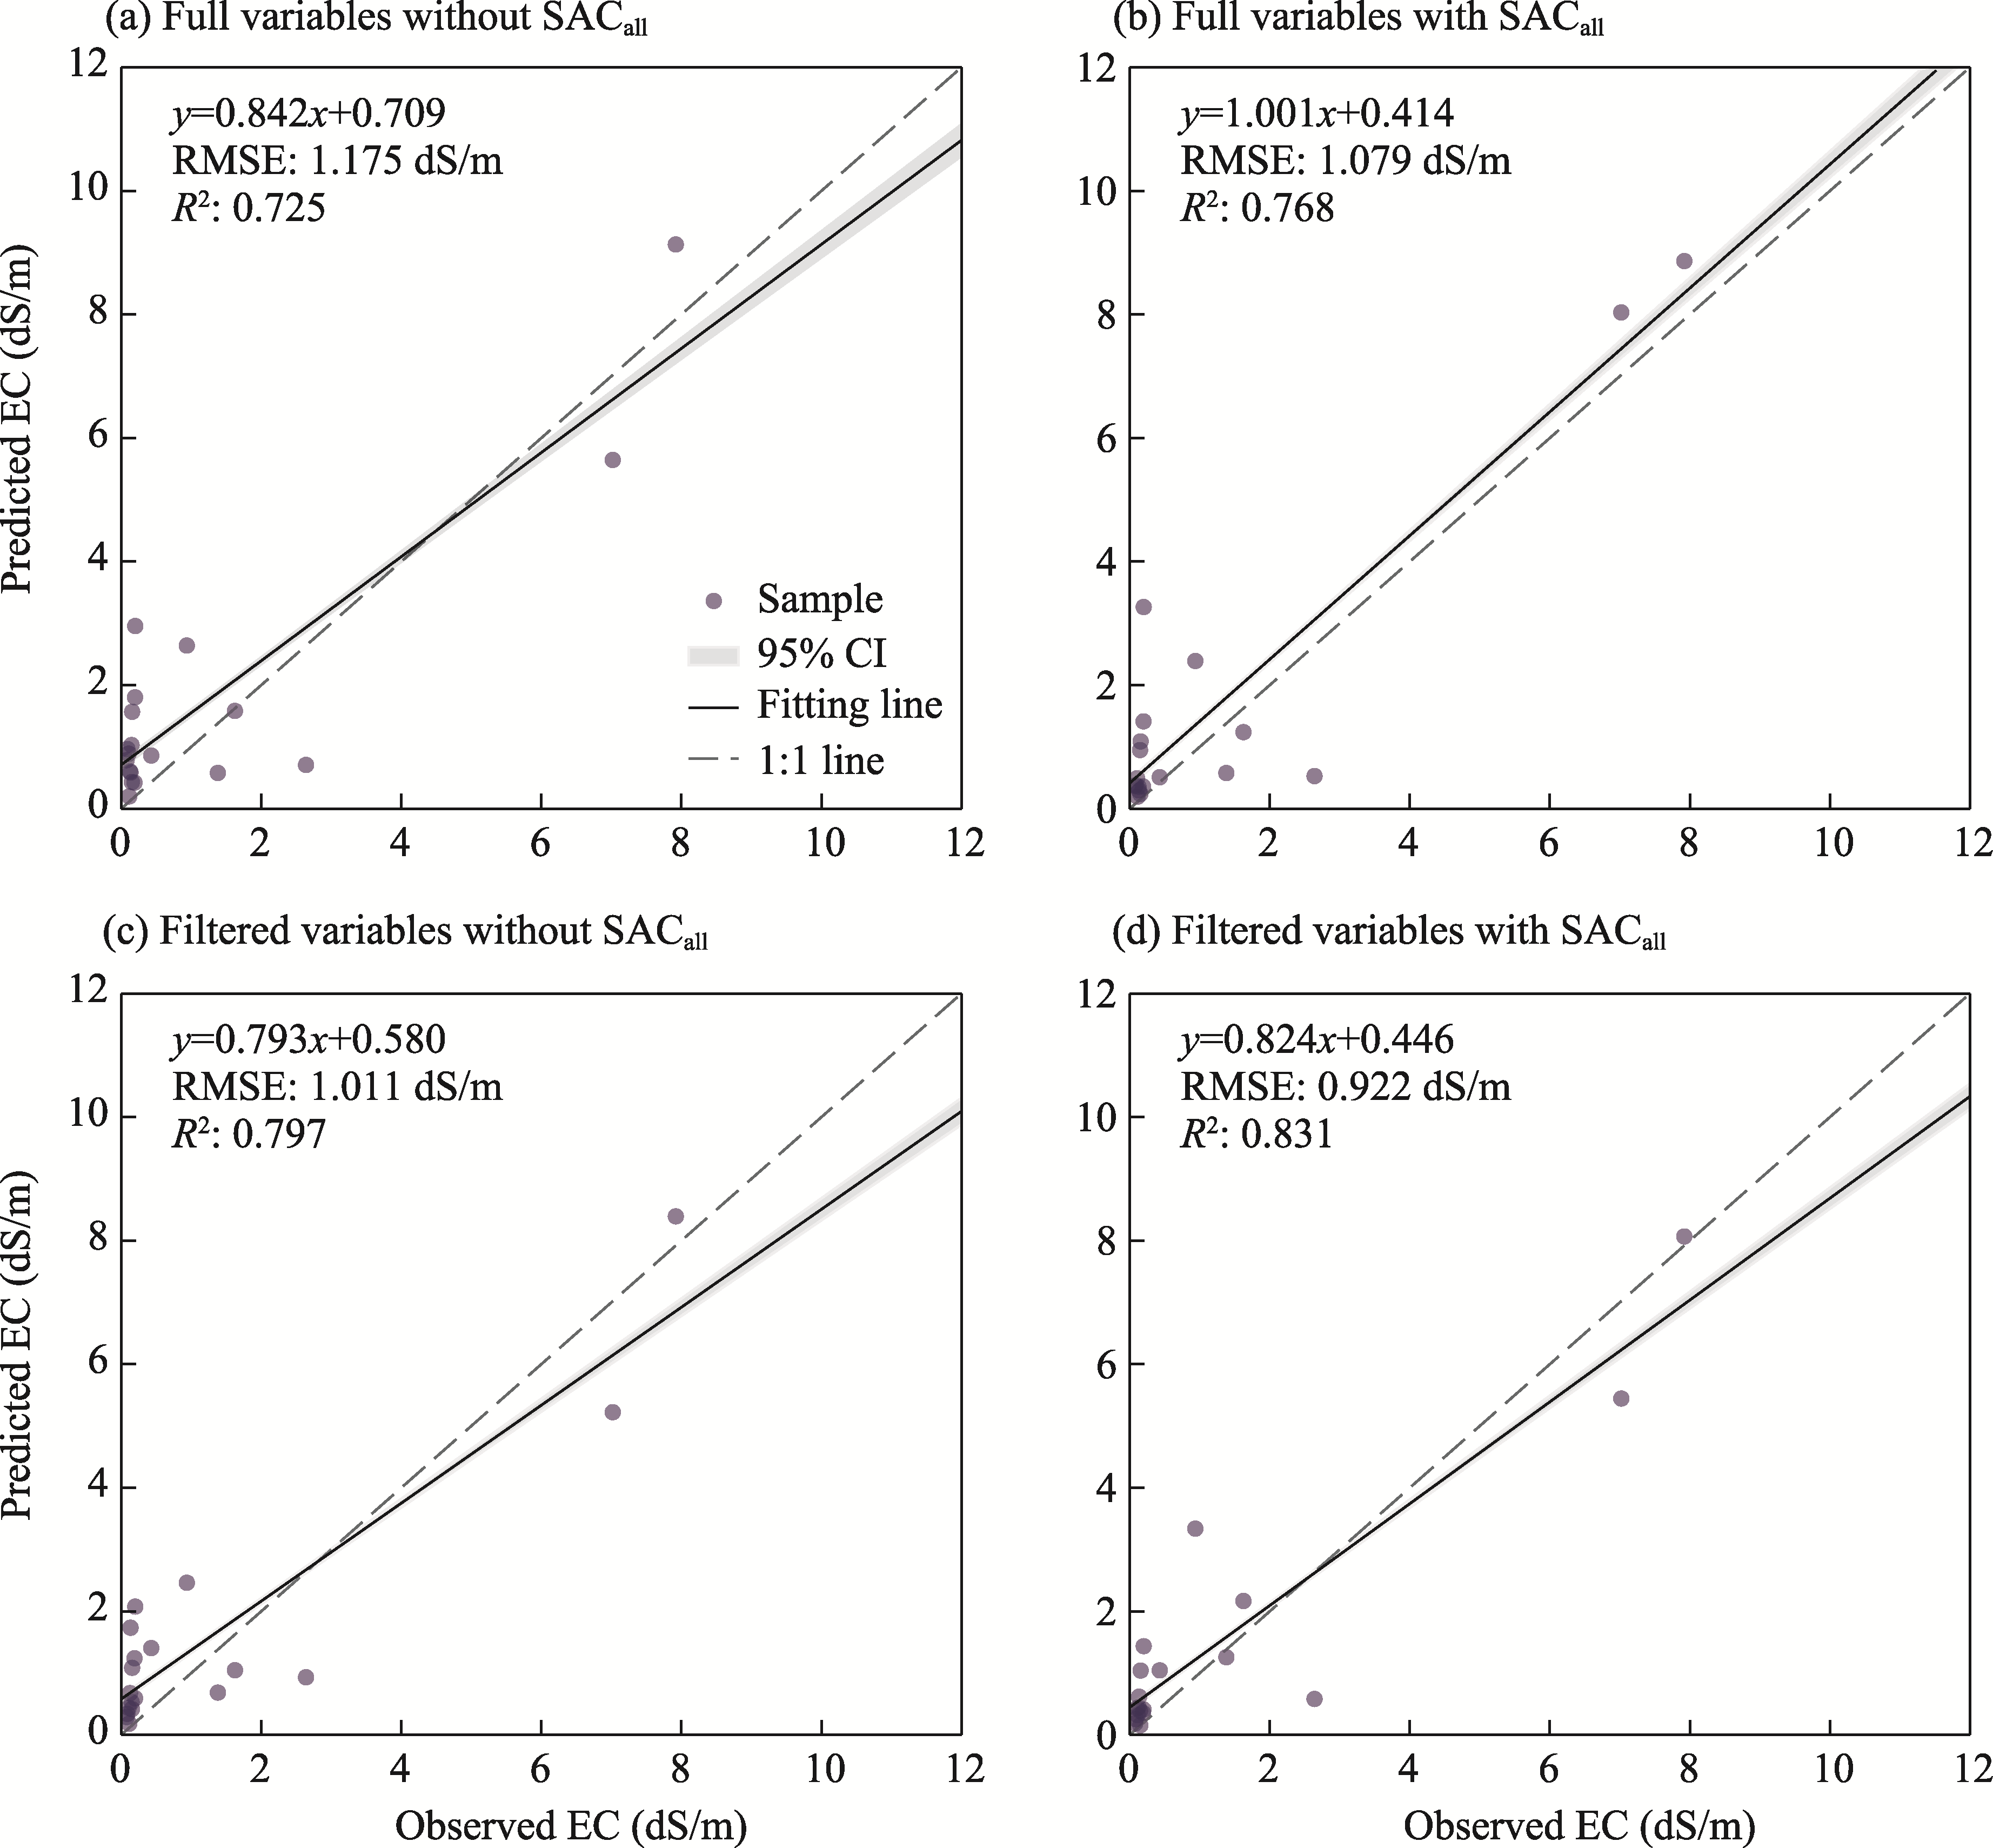
Fig. 10Prediction accuracy comparison of the GBRT model under different modeling scenarios. (a), full variables without SACall; (b), full variables with SACall; (c), filtered variables without SACall; (d), filtered variables with SACall.
[1]
Aihaiti A, Nurmemet I, Yu X R, et al. 2025. An enhanced soil salinity estimation method for arid regions using multisource remote sensing data and advanced feature selection. CATENA, 256: 109116, doi: 10.1016/j.catena.2025.109116.
[2]
Allbed A, Kumar L, Aldakheel Y Y. 2014. Assessing soil salinity using soil salinity and vegetation indices derived from IKONOS high-spatial resolution imageries: applications in a date palm dominated region. Geoderma, 230-231: 1-8.
doi: 10.1016/j.geoderma.2014.03.025
[3]
Cao Q Q, Liu T, Xia J B, et al. 2025. Shifting sands to sustainable soils: spatial dynamics of soil water and salinity in a desert oasis ecotone. Agricultural Water Management, 316: 109562, doi: 10.1016/j.agwat.2025.109562.
[4]
Chang L, Yi S H, Qin Y, et al. 2024. Exploring main soil drivers of vegetation succession in abandoned croplands of Minqin Oasis, China. PeerJ, 12: e17627, doi: 10.7717/peerj.17627.
[5]
Chang X L, Ji S X, Qiao R R, et al. 2019. NDVI-based identification of oasis-desert transitional zone wideness a case study in the central Hexi corridor. Acta Ecologica Sinica, 40(15): 5327-5336. (in Chinese)
[6]
Chen H F, Wu J W, Xu C. 2024a. Monitoring soil salinity classes through remote sensing-based ensemble learning concept: considering scale effects. Remote Sensing, 16(4): 642, doi: 10.3390/rs16040642.
[7]
Chen H Y, Ma Y, Zhu A X, et al. 2021. Soil salinity inversion based on differentiated fusion of satellite image and ground spectra. International Journal of Applied Earth Observation and Geoinformation, 101: 102360, doi: 10.1016/j.jag.2021. 102360.
[8]
Chen Y N, Fang G H, Li Z, et al. 2024b. The crisis in oases: research on ecological security and sustainable development in arid regions. Annual Review of Environment and Resources, 49(1): 1-20.
doi: 10.1146/energy.2024.49.issue-1
[9]
Cui G, Liu Y, Li X J, et al. 2025. Impacts of groundwater storage variability on soil salinization in a semi-arid agricultural plain. Geoderma, 454: 117162, doi: 10.1016/j.geoderma.2024.117162.
[10]
Ding Y D, Lü H S, Xu L G, et al. 2025. Estimating the groundwater table threshold for mitigating soil salinization in the Songnen Plain of China. Journal of Hydrology: Regional Studies, 59: 102326, doi: 10.1016/j.ejrh.2025.102326.
[11]
Du R Q, Xiang Y Z, Chen J Y, et al. 2024. Potential of solar-induced chlorophyll fluorescence (SIF) to access long-term dynamics of soil salinity using OCO-2 satellite data and machine learning method. Geoderma, 444: 116855, doi: 10.1016/j.geoderma.2024.116855.
[12]
Fang H Y, Fan Z M. 2020. Assessment of soil erosion at multiple spatial scales following land use changes in 1980–2017 in the black soil region, (NE) China. International Journal of Environmental Research and Public Health, 17(20): 7378, doi: 10.3390/ijerph17207378.
[13]
Gao L R, Xu E Q. 2025a. Mapping cropland soil salinity using multi-cycle classification to mitigate retrieval errors. Computers and Electronics in Agriculture, 231: 110055, doi: 10.1016/j.compag.2025.110055.
[14]
Gao Z R, Li X J, Zuo L J, et al. 2025b. Unveiling soil salinity patterns in soda saline-alkali regions using Sentinel-2 and SDGSAT-1 thermal infrared data. Remote Sensing of Environment, 322: 114708, doi: 10.1016/j.rse.2025.114708.
[15]
Ge X Y, Ding J L, Teng D X, et al. 2022. Updated soil salinity with fine spatial resolution and high accuracy: The synergy of Sentinel-2 MSI, environmental covariates and hybrid machine learning approaches. CATENA, 212: 106054, doi: 10.1016/j.catena.2022.106054.
[16]
Ghasempour R, Aalami M T, Saghebian S M, et al. 2024. Analysis of spatiotemporal variations of drought and soil salinity via integrated multiscale and remote sensing-based techniques (case study: Urmia Lake Basin). Ecological Informatics, 81: 102560, doi: 10.1016/j.ecoinf.2024.102560.
[17]
Guo B, Liu Y F, Fan J F, et al. 2023a. The salinization process and its response to the combined processes of climate change-human activity in the yellow river delta between 1984 and 2022. CATENA, 231: 107301, doi: 10.1016/j.catena.2023. 107301.
[18]
Guo B, Yang X C, Yang M L, et al. 2023b. Mapping soil salinity using a combination of vegetation index time series and single-temporal remote sensing images in the Yellow River Delta, China. CATENA, 231: 107313, doi: 10.1016/j.catena.2023. 107313.
[19]
Han H J, Yan X, Xie H W, et al. 2023. Incorporating a new landscape intensity indicator into landscape metrics to better understand controls of water quality and optimal width of riparian buffer zone. Journal of Hydrology, 625: 130088, doi: 10.1016/j.jhydrol.2023.130088.
[20]
Han L J, Ding J L, Zhang J Y, et al. 2021. Precipitation events determine the spatiotemporal distribution of playa surface salinity in arid regions: Evidence from satellite data fused via the enhanced spatial and temporal adaptive reflectance fusion model. CATENA, 206: 105546, doi: 10.1016/j.catena.2021.105546.
[21]
Hao X M, Li W H. 2016. Oasis cold island effect and its influence on air temperature: A case study of Tarim Basin, Northwest China. Journal of Arid Land, 8(2): 172-183.
doi: 10.1007/s40333-015-0060-x
[22]
Hao X M, Sun F, Zhang J J, et al. 2025. Vapor pressure deficit governs oasis cooling efficiency and drought intensified water-heat tradeoffs in arid regions. Journal of Hydrology, 661: 133804, doi: 10.1016/j.jhydrol.2025.133804.
[23]
Hao Y Y, Xie Y W, Ma J H, et al. 2017. The critical role of local policy effects in arid watershed groundwater resources sustainability: a case study in the Minqin Oasis, China. Science of The Total Environment, 601-602: 1084-1096.
doi: 10.1016/j.scitotenv.2017.04.177
[24]
Hassani A, Azapagic A, Shokri N. 2021. Global predictions of primary soil salinization under changing climate in the 21st century. Nature Communications, 12(1): 6663, doi: 10.1038/s41467-021-26907-3.
[25]
Hassani A, Smith P, Shokri N. 2024. Negative correlation between soil salinity and soil organic carbon variability. Proceedings of the National Academy of Sciences of the United States of America, 121(18): e2317332121, doi: 10.1073/pnas. 2317332121.
[26]
Hengl T, Nussbaum M, Wright M N, et al. 2018. Random forest as a generic framework for predictive modeling of spatial and spatio-temporal variables. PeerJ, 6: e5518, doi: 10.7717/peerj.5518.
[27]
Huang F, Ochoa C G, Chen X. 2021. Assessing environmental water requirement for groundwater-dependent vegetation in arid inland basins by combining the copula joint distribution function and the dual objective optimization: An application to the Turpan Basin, China. Science of The Total Environment, 799: 149323, doi: 10.1016/j.scitotenv.2021.149323.
[28]
Ivushkin K, Bartholomeus H, Bregt A K, et al. 2019a. UAV based soil salinity assessment of cropland. Geoderma, 338: 502-512.
doi: 10.1016/j.geoderma.2018.09.046
[29]
Ivushkin K, Bartholomeus H, Bregt A K, et al. 2019b. Global mapping of soil salinity change. Remote Sensing of Environment, 231: 111260, doi: 10.1016/j.rse.2019.111260.
[30]
Javed T, Zhang J Z, Li W H, et al. 2025. Unlocking soil salinity prediction with remote sensing indices and environmental insights. Land Degradation & Development, 36(15): 5168-5183.
doi: 10.1002/ldr.v36.15
[31]
Jia P P, He W, Hu Y, et al. 2024a. Inversion of coastal cultivated soil salt content based on multi-source spectra and environmental variables. Soil & Tillage Research, 241: 106124, doi: 10.1016/j.still.2024.106124.
[32]
Jia P P, Zhang J H, Liang Y N, et al. 2024b. The inversion of arid-coastal cultivated soil salinity using explainable machine learning and Sentinel-2. Ecological Indicators, 166: 112364, doi: 10.1016/j.ecolind.2024.112364.
[33]
Jiang X F, Duan H C, Liao J, et al. 2022. Estimation of soil salinization by machine learning algorithms in different arid regions of Northwest China. Remote Sensing, 14(2): 347, doi: 10.3390/rs14020347.
[34]
Jin Y Z, Zeng J J, Hu X Q, et al. 2017. Research on the response of the water sources to the climatic change in Shiyang River Basin. In: Proceedings of the 3rd International Conference on Water Resource and Environment. Qingdao: IOP Publishing, doi: 10.1088/1755-1315/82/1/012093.
[35]
Khosravichenar A, Aalijahan M, Moaazeni S, et al. 2023. Assessing a multi-method approach for dryland soil salinization with respect to climate change and global warming-the example of the Bajestan region (NE Iran). Ecological Indicators, 154: 110639, doi: 10.1016/j.ecolind.2023.110639.
[36]
Kumar P, Tiwari P, Biswas A, et al. 2024. Spatio-temporal assessment of soil salinization utilizing remote sensing derivatives, and prediction modeling: Implications for sustainable development. Geoscience Frontiers, 15(6): 101881, doi: 10.1016/j.gsf. 2024.1018811674-9871.
[37]
Li D H, Wang Z, Li H, et al. 2025. Accelerated disappearance of desert oases: The impact of climate warming and farmland expansion. Agricultural Water Management, 319: 109798, doi: 10.1016/j.agwat.2025.109798.
[38]
Li K, Chi G Q, Wang L, et al. 2018. Identifying the critical riparian buffer zone with the strongest linkage between landscape characteristics and surface water quality. Ecological Indicators, 93: 741-752.
doi: 10.1016/j.ecolind.2018.05.030
[39]
Li Y S, Chang C Y, Wang Z R, et al. 2023. Upscaling remote sensing inversion and dynamic monitoring of soil salinization in the Yellow River Delta, China. Ecological Indicators, 148: 110087, doi: 10.1016/j.ecolind.2023.110087.
[40]
Li Z. 2018. GBDT-SVM credit risk assessment model and empirical analysis of peer-to-peer borrowers under consideration of audit information. Open Journal of Business and Management, 6: 362-372.
doi: 10.4236/ojbm.2018.62026
[41]
Liu B S, Huang L H, Jiang X T, et al. 2024. Quantitative evaluation and mechanism analysis of soil chemical factors affecting rice yield in saline-sodic paddy fields. Science of The Total Environment, 929: 172584, doi: 10.1016/j.scitotenv.2024.172584.
[42]
Liu X X, Gou Q Q, Wang G H. 2025. Analysis of the width dynamics of the oasis-desert ecotone at the northern margin of the Tarim Basin. Arid Zone Research, 42(3): 534-544. (in Chinese)
doi: 10.13866/j.azr.2025.03.13
[43]
Lu B, Castillo I, Chiang L, et al. 2014. Industrial PLS model variable selection using moving window variable importance in projection. Chemometrics and Intelligent Laboratory Systems, 135: 90-109.
doi: 10.1016/j.chemolab.2014.03.020
[44]
Lu H Y, Mokarram M. 2025a. Forecasting climate change effects on saline lakes through advanced remote sensing and deep learning. Science of The Total Environment, 980: 179582, doi: 10.1016/j.scitotenv.2025.179582.
[45]
Lu J Q, Zhang X F, Liang S M, et al. 2023. Spatiotemporal dynamics of vegetation index in an oasis-desert transition zone and relationship with environmental factors. Sustainability, 15(4): 3503, doi: 10.3390/su15043503.
[46]
Lu T, Luo P P, Wang J C, et al. 2025b. Soil salinity accumulation and groundwater degradation due to overexploitation over recent 40-year period in Yaoba Oasis, China. Soil and Tillage Research, 248: 106398, doi: 10.1016/j.still.2024.106398.
[47]
Ma S L, He B Z, Ge X Y, et al. 2023. Spatial prediction of soil salinity based on the Google Earth Engine platform with multitemporal synthetic remote sensing images. Ecological Informatics, 75: 102111, doi: 10.1016/j.ecoinf.2023.102111.
[48]
Mahmoud M F, Arabi M, Pallickara S. 2025. Harnessing ensemble machine learning models for improved salinity prediction in large river basin scales. Journal of Hydrology, 652: 132691, doi: 10.1016/j.jhydrol.2025.132691.
[49]
Metternicht G I, Zinck J A. 2003. Remote sensing of soil salinity: potentials and constraints. Remote Sensing of Environment, 85(1): 1-20.
doi: 10.1016/S0034-4257(02)00188-8
[50]
Ngabire M, Wang T, Xue X, et al. 2022. Soil salinization mapping across different sandy land-cover types in the Shiyang River Basin: A remote sensing and multiple linear regression approach. Remote Sensing Applications: Society and Environment, 28: 100847, doi: 10.1016/j.rsase.2022.100847.
[51]
Niu L T, Jia X X, Li X D, et al. 2024. Developing novel ensemble models for predicting soil hydraulic properties in China's arid region. Journal of Hydrology, 636: 131354, doi: 10.1016/j.jhydrol.2024.131354.
[52]
Qin C Z, An Y M, Liang P, et al. 2021. Soil property mapping by combining spatial distance information into the soil land inference model (SOLIM). Pedosphere, 31(4): 638-644.
doi: 10.1016/S1002-0160(20)60016-9
[53]
Qin Y, Nurmemet I, Aihaiti A, et al. 2025. Synergistic retrieval of soil moisture in arid regions using GF-3 SAR and Sentinel-2 optical data. Land Degradation & Development, 37(9): 4274-4294.
doi: 10.1002/ldr.v37.9
[54]
Sun L, Li H, Wang J, et al. 2023. Impacts of climate change and human activities on NDVI in the Qinghai-Tibet Plateau. Remote Sensing, 15(3): 587, doi: 10.3390/rs15030587.
[55]
Tariq A, Sardans J, Zeng F J, et al. 2024. Impact of aridity rise and arid lands expansion on carbon-storing capacity, biodiversity loss, and ecosystem services. Global Change Biology, 30(4): e17292, doi: 10.1111/gcb.17292.
[56]
Tobler W R. 1970. A computer movie simulating urban growth in the Detroit region. Economic Geography, 46: 234-240.
doi: 10.2307/143141
[57]
Velilla E, Snethlage J, Poelman M, et al. 2025. Too salty to farm: rethinking coastal land use in response to soil salinization. Restoration Ecology, 33(4): e70006, doi: 10.1111/rec.70006.
[58]
Wadoux A M J C, Heuvelink G B M, de Bruin S, et al. 2021. Spatial cross-validation is not the right way to evaluate map accuracy. Ecological Modelling, 457: 109692, doi: 10.1016/j.ecolmodel.2021.109692.
[59]
Wang D Y, Yang H C, Qian H, et al. 2023a. Minimizing vegetation influence on soil salinity mapping with novel bare soil pixels from multi-temporal images. Geoderma, 439: 116697, doi: 10.1016/j.geoderma.2023.116697.
[60]
Wang J F, Li X H, Christakos G, et al. 2010. Geographical detectors-based health risk assessment and its application in the neural tube defects study of the Heshun region, China. International Journal of Geographical Information Science, 24(1): 107-127.
doi: 10.1080/13658810802443457
[61]
Wang W Y, Yang P, Xia J, et al. 2023b. Impact of land use on water quality in buffer zones at different scales in the Poyang Lake, middle reaches of the Yangtze River Basin. Science of The Total Environment, 896: 165161, doi: 10.1016/j.scitotenv. 2023.165161.
[62]
Weiss M, Jacob F, Duveiller G. 2020. Remote sensing for agricultural applications: A meta-review. Remote Sensing of Environment, 236: 111402, doi: 10.1016/j.rse.2019.111402.
[63]
Wu C W, Zheng Y, Yang H, et al. 2021. Effects of different particle sizes on the spectral prediction of soil organic matter. CATENA, 196: 104933, doi: 10.1016/j.catena.2020.104933.
[64]
Xiao S T, Nurmemet I, Zhao J. 2024. Soil salinity estimation based on machine learning using the GF-3 radar and Landsat-8 data in the Keriya Oasis, southern Xinjiang, China. Plant and Soil, 498(1-2): 451-469.
doi: 10.1007/s11104-023-06446-0
[65]
Xiong J, Ge X Y, Ding J L, et al. 2025. Optimal time-window for assessing soil salinity via Sentinel-2 multitemporal synthetic data in the arid agricultural regions of China. Ecological Indicators, 176: 113642, doi: 10.1016/j.ecolind.2025.113642.
[66]
Yan D, Lei Y L, Shi Y K, et al. 2018. Evolution of the spatiotemporal pattern of PM2.5 concentrations in China-A case study from the Beijing-Tianjin-Hebei region. Atmospheric Environment, 183: 225-233.
doi: 10.1016/j.atmosenv.2018.03.041
[67]
Yang J, Huang X. 2024. The 30 m annual land cover datasets and its dynamics in China from 1985 to 2023. Earth System Science Data, 13: 3907-3925.
doi: 10.5194/essd-13-3907-2021
[68]
Yang X Y, Xue X, Zhao D, et al. 2025. Spatial distribution and ecological significance of halophyte communities in the desert-oasis transition zone of the Minqin Lake area. Acta Ecologica Sinica, 45(15): 7500-7512. (in Chinese)
[69]
Yin X W, Feng Q, Li Y, et al. 2022. An interplay of soil salinization and groundwater degradation threatening coexistence of oasis-desert ecosystems. Science of The Total Environment, 806(Part 2): 150599, doi: 10.1016/j.scitotenv.2021.150599.
[70]
Yu H, Wang Z M, Mao D H, et al. 2023. Spatiotemporal variations of soil salinization in China's West Songnen Plain. Land Degradation & Development, 34(8): 2366-2378.
doi: 10.1002/ldr.v34.8
[71]
Zaman M, Shahid S A, Heng L. 2018. Guideline for Salinity Assessment, Mitigation and Adaptation Using Nuclear and Related Techniques. Cham: Springer.
[72]
Zeng T, Li Y Z, Ma L, et al. 2025. Unveiling latent interaction mechanisms influencing the spatial pattern of soil salinity in arid oases: Insights from integrated modeling. CATENA, 250: 108769, doi: 10.1016/j.catena.2025.108769.
[73]
Zeng Y L, Hao D L, Badgley G, et al. 2021. Estimating near-infrared reflectance of vegetation from hyperspectral data. Remote Sensing of Environment, 267: 112723, doi: 10.1016/j.rse.2021.112723.
[74]
Zhan D X, Liu Y T, Yang W H, et al. 2025. Spatial variability of soil salinity in coastal saline-alkali farmlands: A novel approach integrating a stacked model with the reconstructed in-situ hyperspectral feature. Computers and Electronics in Agriculture, 235: 110376, doi: 10.1016/j.compag.2025.110376.
[75]
Zhang L, Jia X, Zhao Y H, et al. 2025. Long time-series change characteristics and suitable scale of oasis in arid and semi-arid regions of China. Applied Geography, 180: 103663, doi: 10.1016/j.apgeog.2025.103663.
[76]
Zhang Y T, Hou K, Qian H, et al. 2022. Characterization of soil salinization and its driving factors in a typical irrigation area of Northwest China. Science of The Total Environment, 837: 155808, doi: 10.1016/j.scitotenv.2022.155808.
[77]
Zhao P, Qu J J, Xu X Y, et al. 2019. Desert vegetation distribution and species-environment relationships in an oasis-desert ecotone of northwestern China. Journal of Arid Land, 11(3): 461-476.
doi: 10.1007/s40333-019-0055-0
[78]
Zhao R, Zhan L P, Yao M X, et al. 2020. A geographically weighted regression model augmented by Geodetector analysis and principal component analysis for the spatial distribution of PM2.5. Sustainable Cities and Society, 56: 102106, doi: 10.1016/j.scs.2020.102106.
[79]
Zhu M F, Yu X X, Chen K, et al. 2024. Spatiotemporal characteristics and driving factors of chemical oxygen demand emissions in China's wastewater: An analysis based on spatial autocorrelation and Geodetector. Ecological Indicators, 166: 112308, doi: 10.1016/j.ecolind.2024.112308.