Exploring the main driving factors of gross primary production in different climate zones of China using the XGBoost-SHAP model
SUN Na1, XUE Yayong1,*(), GUO Jiawei2, XUE Yibo3
1College of Geography and Remote Sensing Science, Xinjiang University, Urumqi 830046, China 2China Meteorological Administration Institute of Desert Meteorology, Urumqi 83000, China 3School of Geographical Sciences, Hunan Normal University, Changsha 410081, China
Understanding the drivers of gross primary production (GPP) is essential for assessing vegetation productivity dynamics under climate change, particularly across regions with strong climatic heterogeneity. China spans diverse climate zones and ecosystems, yet the relative importance of climatic, environmental, and anthropogenic factors regulating GPP has remained poorly resolved. In this study, we investigated the spatiotemporal patterns of GPP across China from 2001 to 2020 and quantified the contributions of multiple driving factors across different climate zones. We combined ridge regression with an interpretable machine learning framework based on Extreme Gradient Boosting (XGBoost) and SHapley Additive exPlanations (SHAP) to disentangle the long-term linear controls on and short-term nonlinear responses driving GPP. Ridge regression was employed to address multicollinearity among predictors and to quantify their interannual contributions, while SHAP analysis was used to quantify feature contributions in nonlinear model predictions. Our results indicated that leaf area index (LAI) and human footprint dominated the long-term variability of GPP in most climate zones, whereas temperature and solar radiation exerted stronger influences on instantaneous GPP responses. The relative importance of drivers varied markedly among climate zones, reflecting region-specific climatic constraints and vegetation physiological characteristics. In addition, the contribution of atmospheric CO2 to GPP variability was notably limited in the alpine climate zone and showed a declining fertilization effect nationally, suggesting increasing constraints imposed by water availability and nutrient limitations. By integrating linear attribution and nonlinear interpretability, this study provides a comprehensive assessment of the controls on GPP dynamics across China and highlights the importance of accounting for climatic heterogeneity and temporal scales when evaluating vegetation productivity responses to environmental change.
SUN Na, XUE Yayong, GUO Jiawei, XUE Yibo. Exploring the main driving factors of gross primary production in different climate zones of China using the XGBoost-SHAP model. Journal of Arid Land, 2026, 18(6): 903-927.
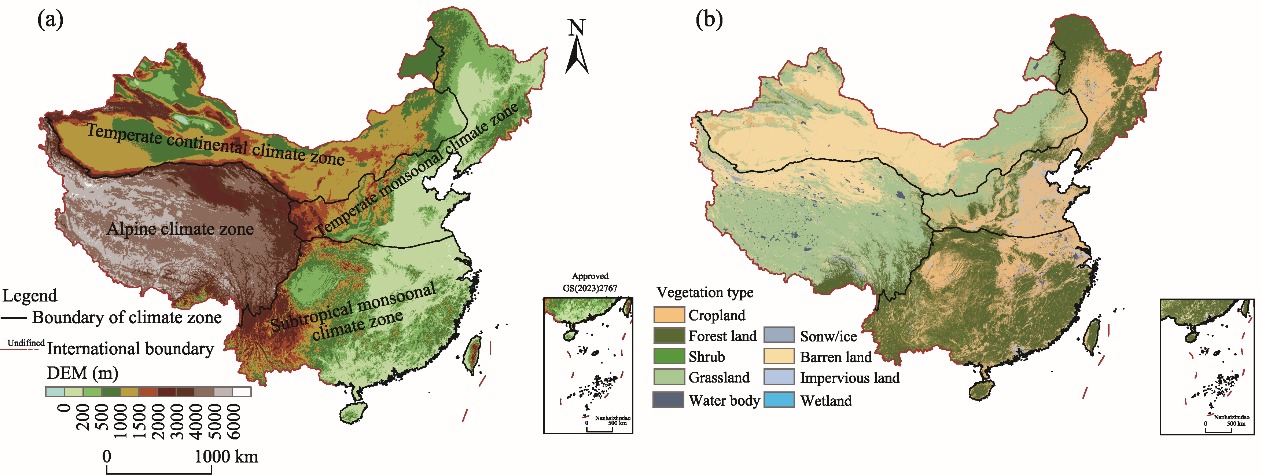
Fig. 1Topographic (a) and vegetation type (b) distribution in China. DEM, digital elevation model.
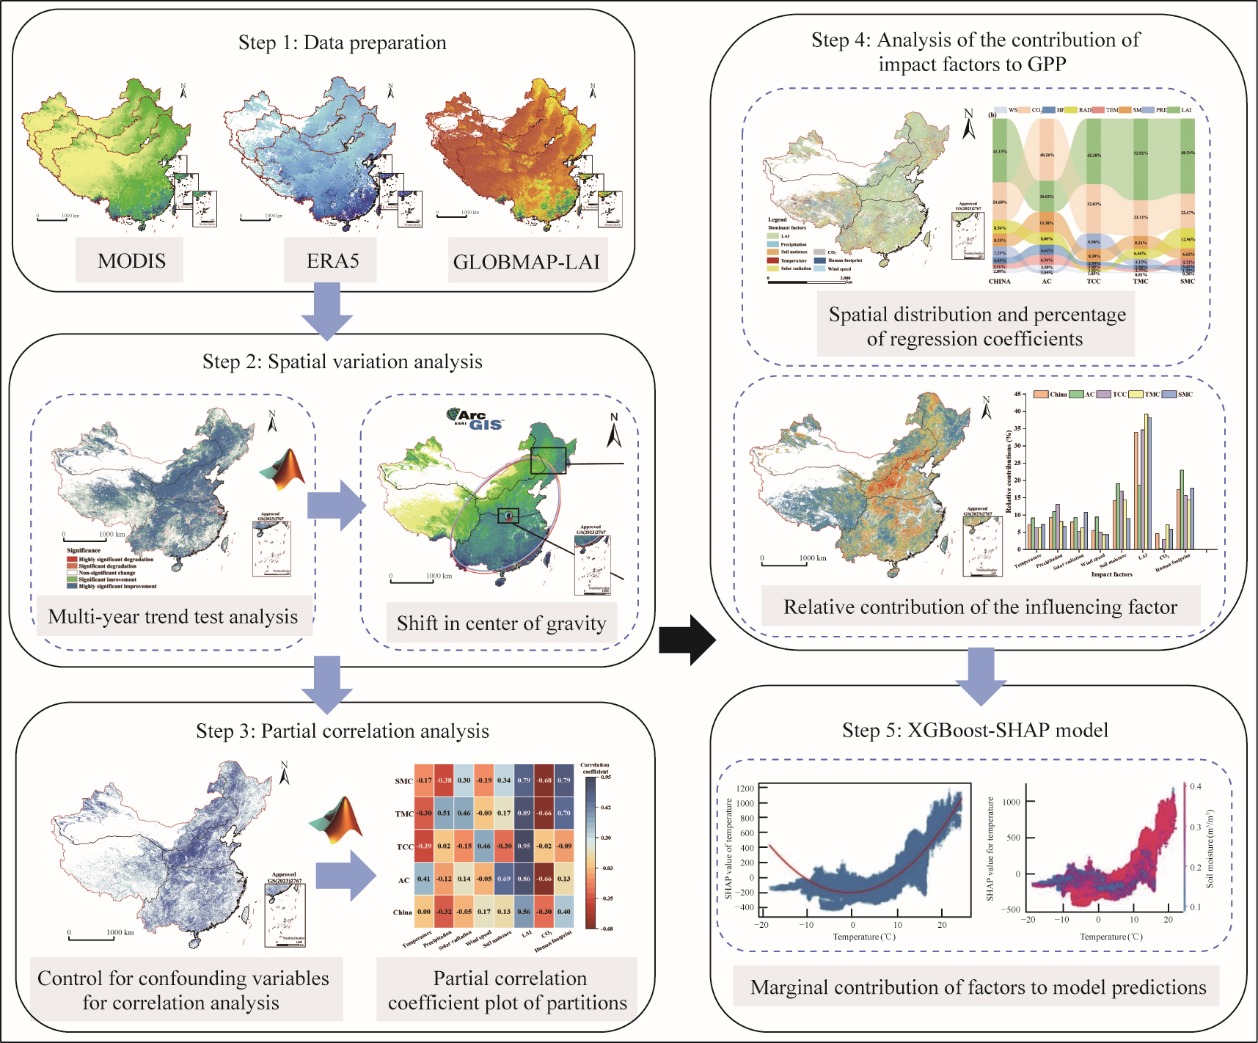
Fig. 2Schematic of research framework. MODIS, Moderate Resolution Imaging Spectroradiometer; ERA5, European Centre for Medium-Range Weather Forecasts (ECMWF) Reanalysis 5; GLOBMAP-LAI, GLOBMAP global Leaf Area Index since 1981; GPP, gross primary production; XGBoost-SHAP, Extreme Gradient Boosting-SHapley Additive exPlanations.
Category
GPP
SGPP
Mann-Kendall (M-K) test (|Z|)
Improvement
Highly
SGPP>0
1.96<|Z|≤2.58
Slight
|Z|>2.58
Stable
SGPP=0
Degradation
Slight
SGPP<0
|Z|>2.58
Highly
1.96<|Z|≤2.58
Table 1 Utilized statistical significance levels for gross primary production (GPP) change
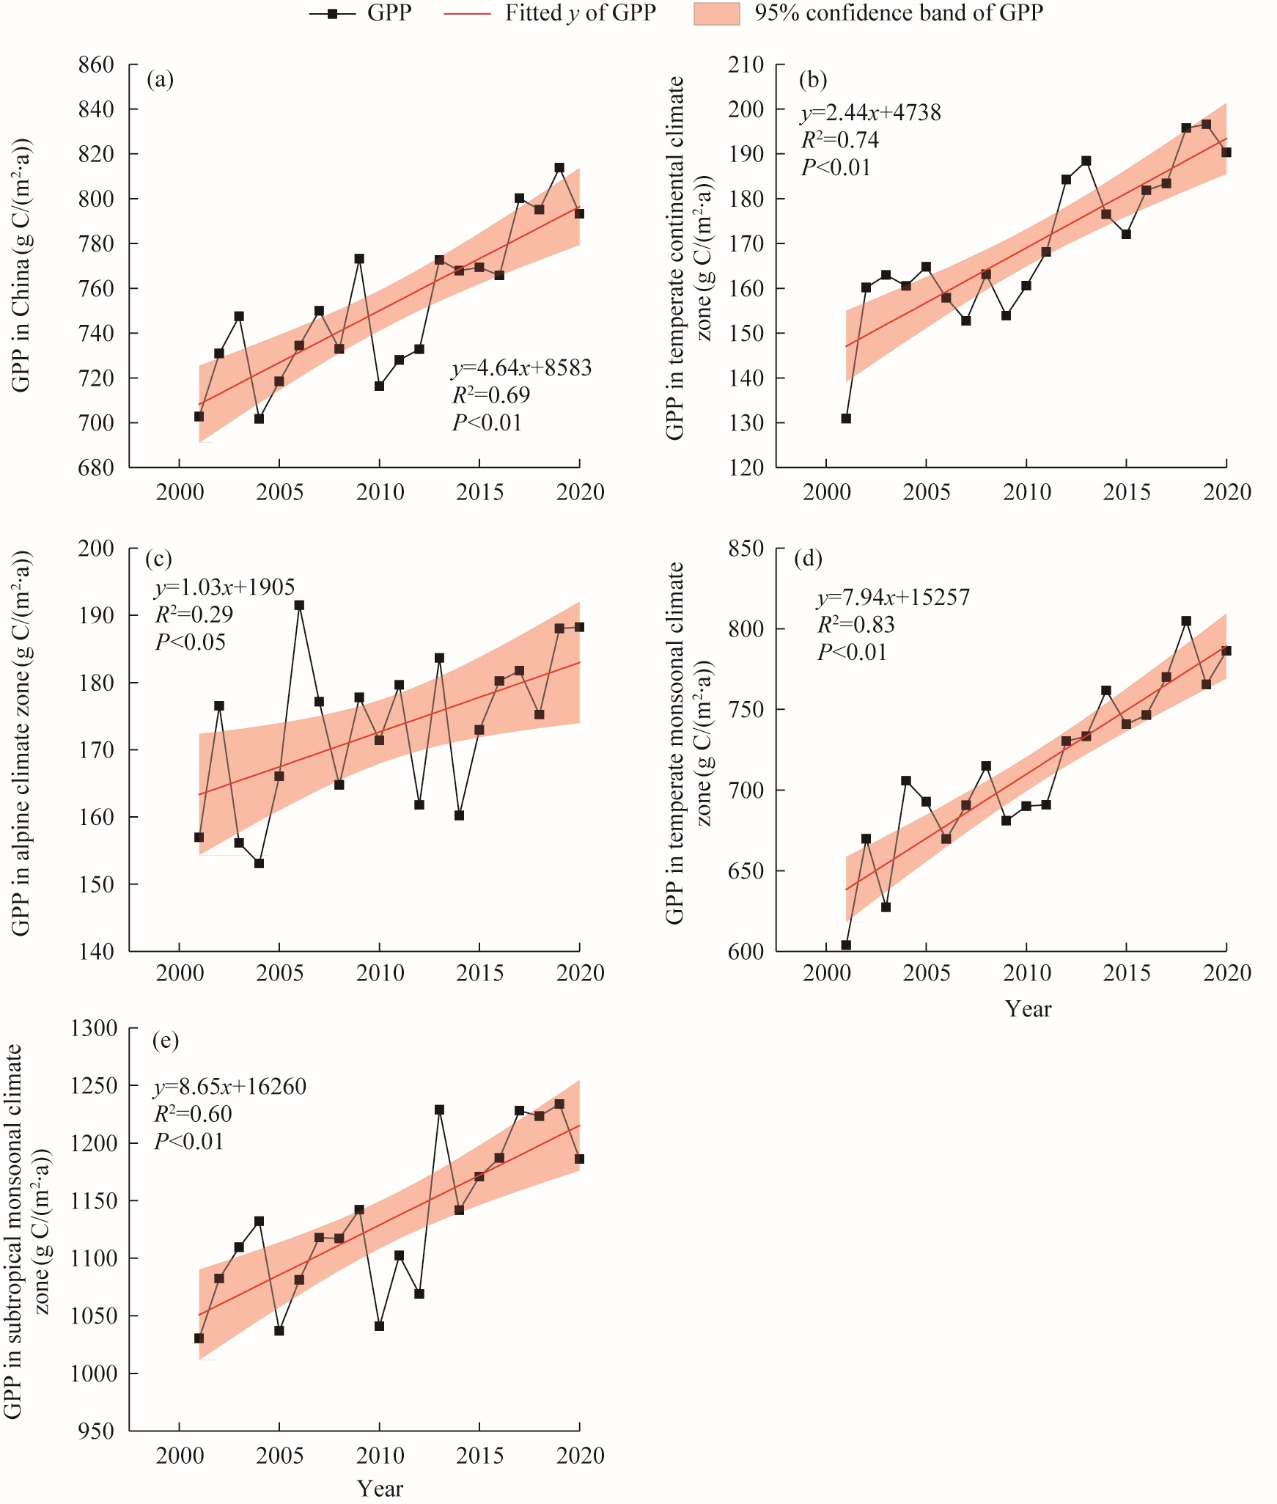
Fig. 3Interannual variation of GPP from 2001 to 2020 in China. (a), China; (b), temperate continental climate zone; (c), alpine climate zone; (d), temperate monsoonal climate zone; (e), subtropical monsoonal climate zone.
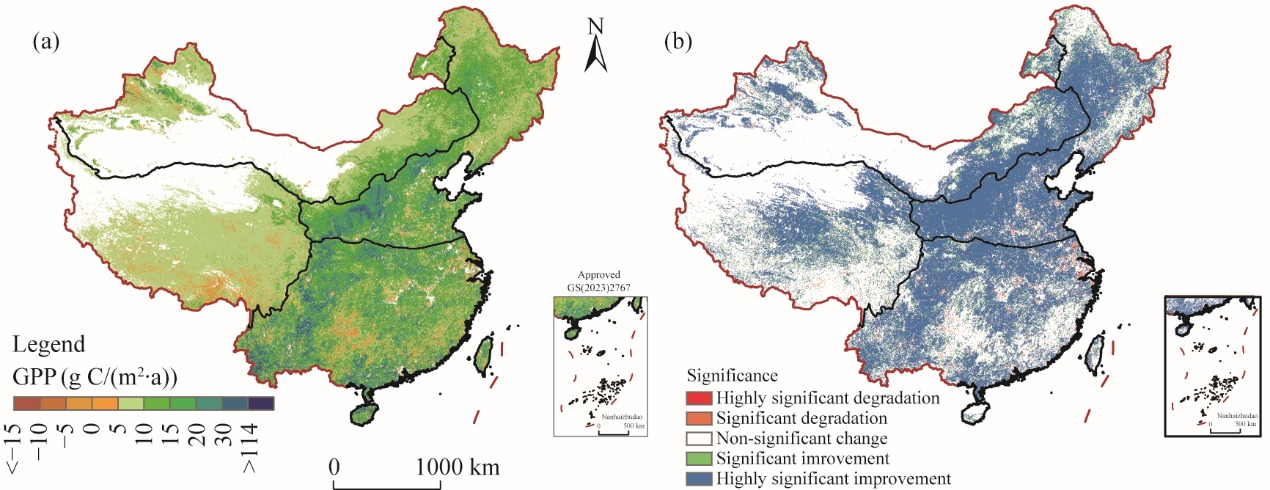
Fig. 4Spatial patterns (a) and significance distribution (b) of GPP in China. The white area represents desert bare land where GPP is close to 0 year-round in Figure 4a.
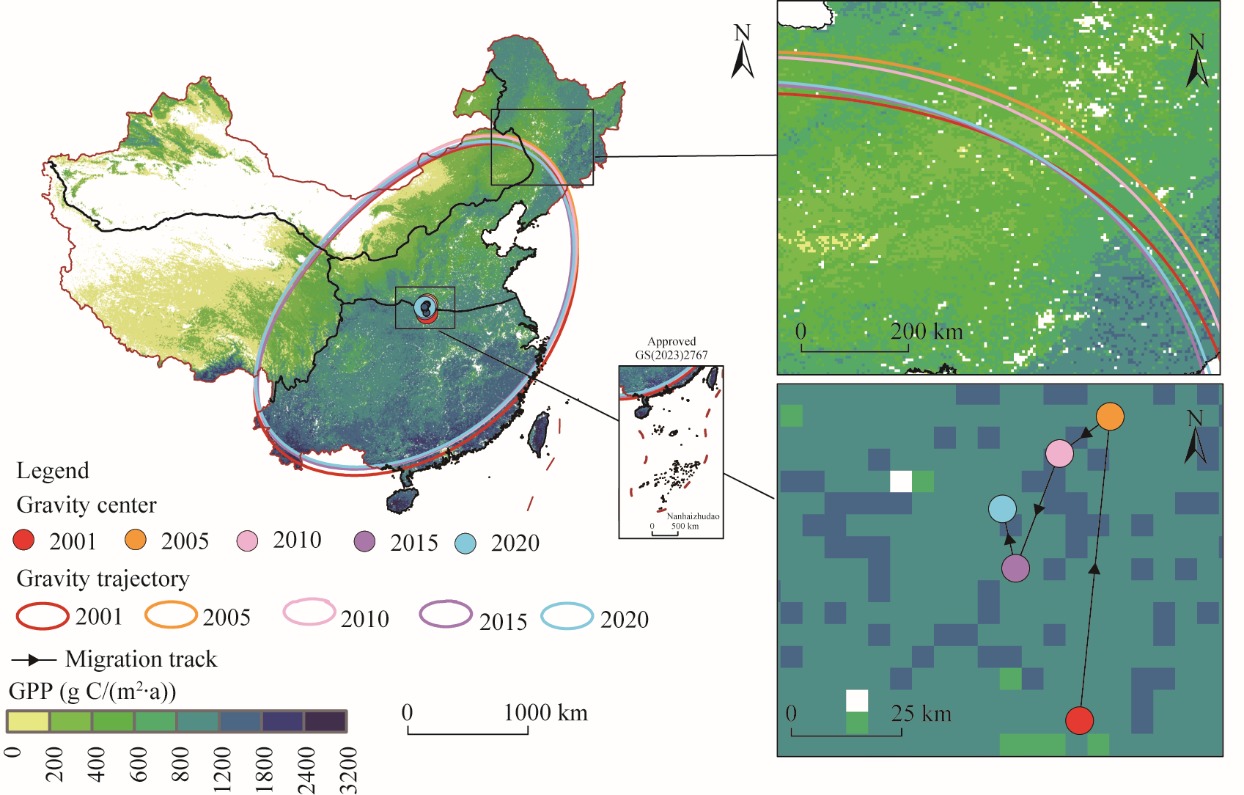
Fig. 5GPP standard deviation ellipse and its center of gravity migration trajectory in China. The white area represents desert bare land where GPP is close to 0 year-round.
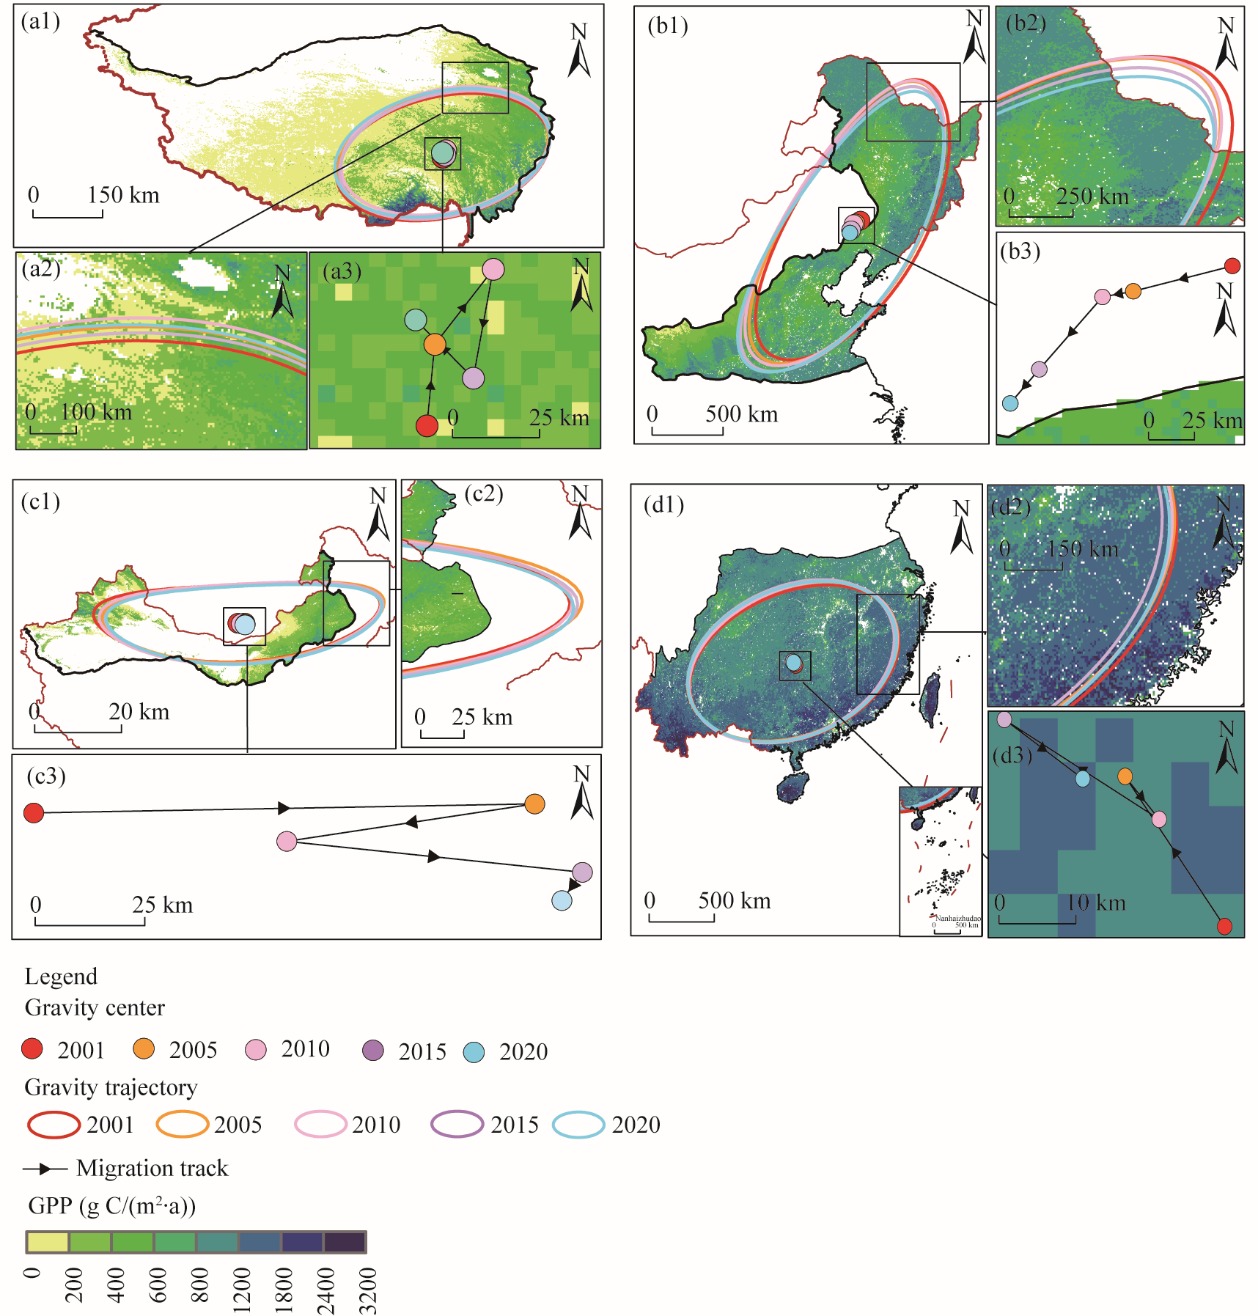
Fig. 6Standard deviation ellipse of GPP and centroid migration trajectory in climate zones. (a), alpine climate zone; (b), temperate monsoonal climate zone; (c), temperate continental climate zone; (d), subtropical monsoonal climate zone. The white area represents desert bare land where GPP is close to 0 year-round.
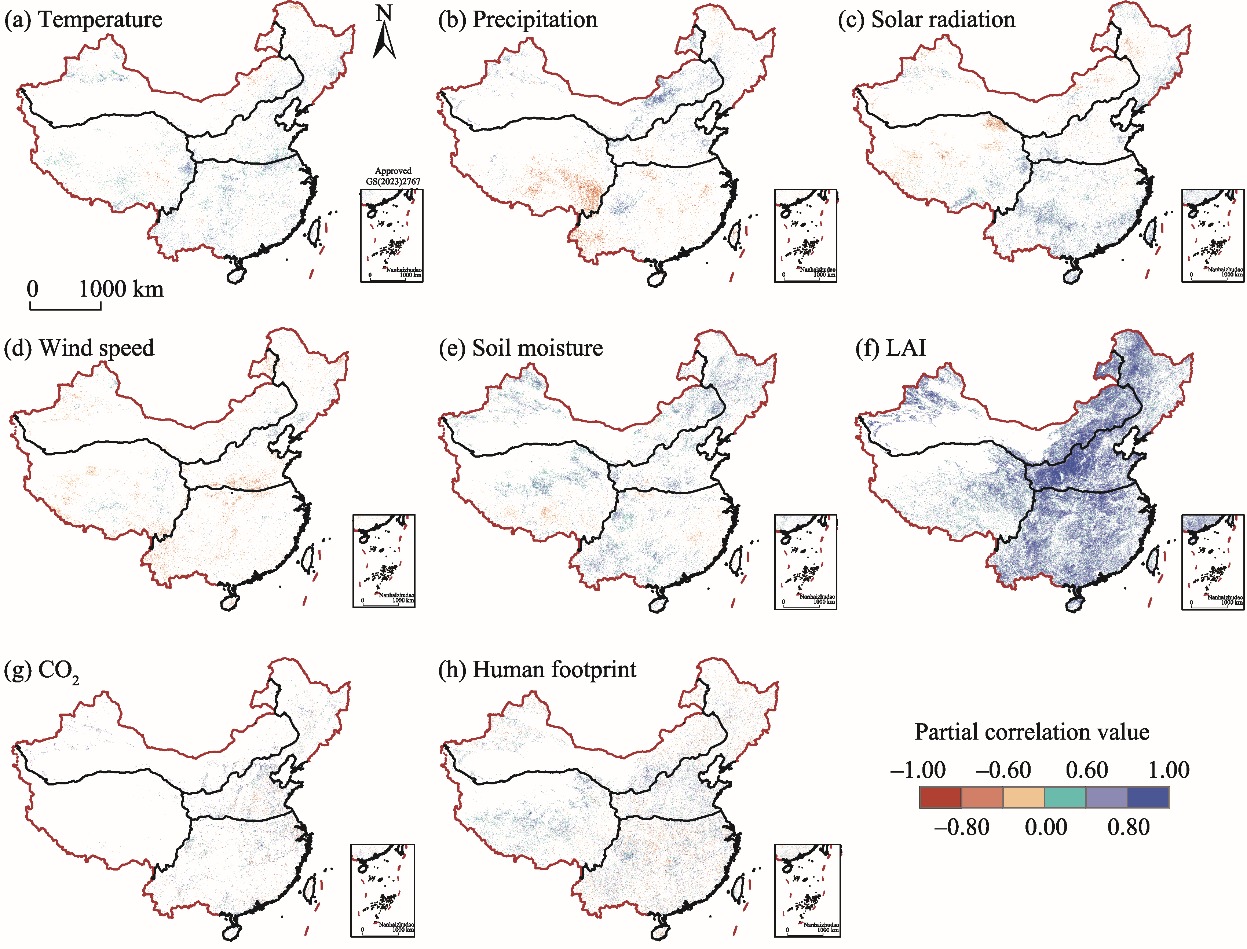
Fig. 7Spatial distribution of the partial correlation coefficients between GPP and driving factors in China. (a), temperature; (b), precipitation; (c), solar radiation; (d), wind speed; (e), soil moisture; (f), leaf area index (LAI); (g), carbon dioxide (CO2); (h), human footprint. Blank areas comprise both raw-data gaps and computational nulls from invalid partial correlations.
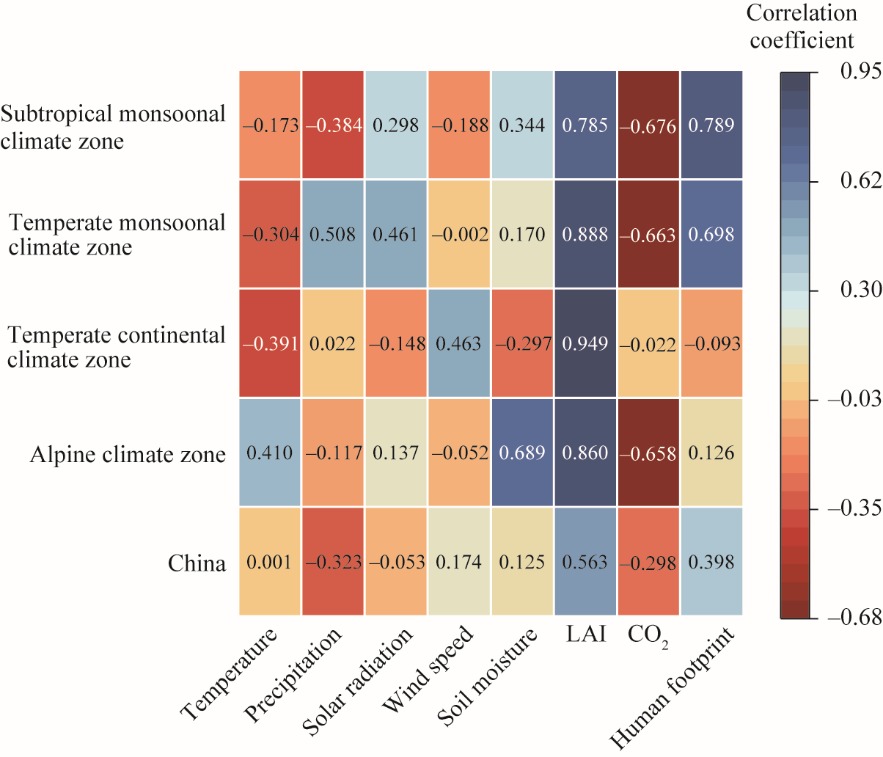
Fig. 8Matrix diagram of partial correlation coefficients
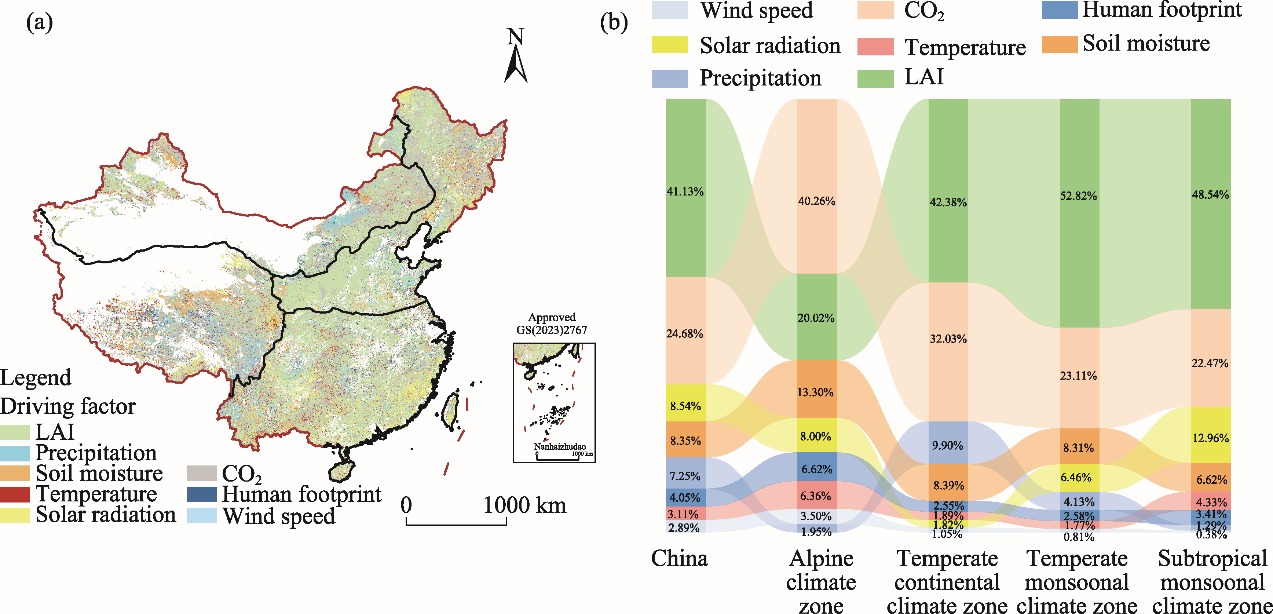
Fig. 9Spatial distribution (a) and percentage statistics (b) of regression coefficients. The white area in Figure 9a represents desert bare land where GPP is close to 0 year-round.
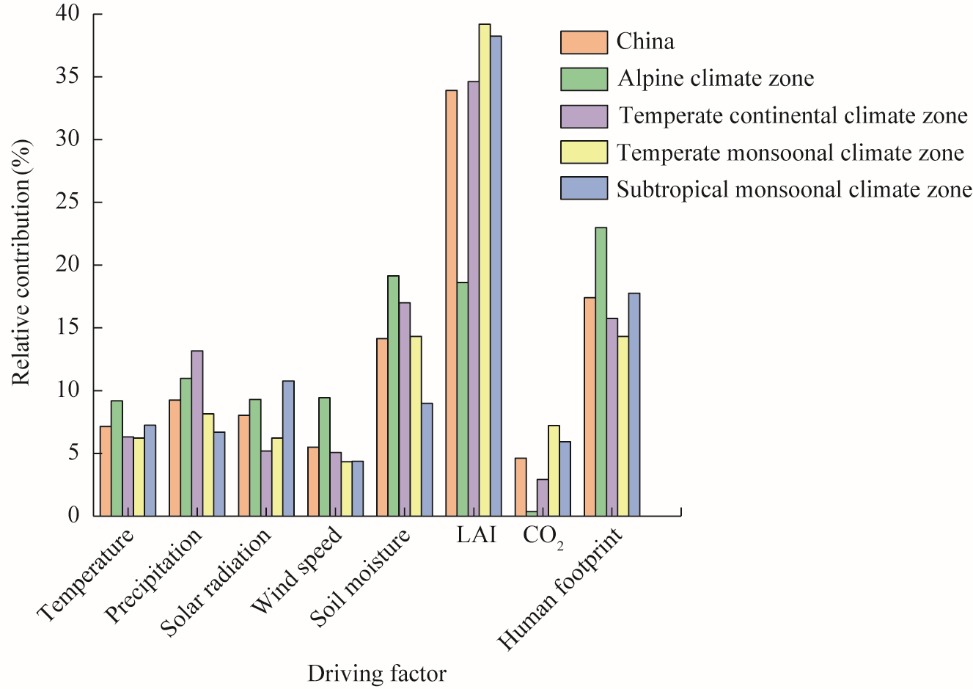
Fig. 10Relative contribution of each driving factor in different climate zones
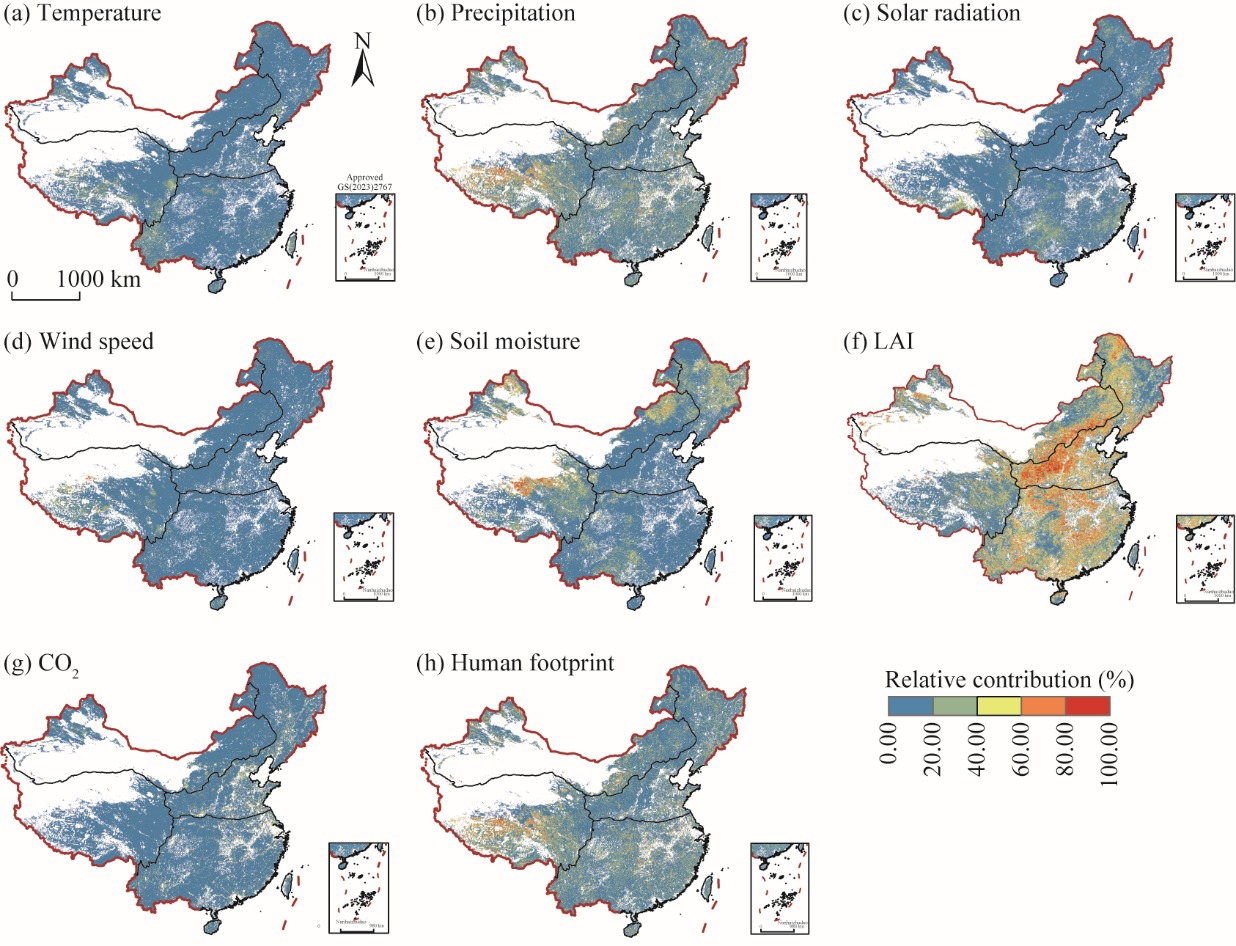
Fig. 11Relative contributions of driving factors to interannual GPP in China from 2001 to 2020. (a), temperature; (b), precipitation; (c), solar radiation; (d), wind speed; (e), soil moisture; (f), LAI; (g), carbon dioxide (CO2); (h), human footprint. The white area represents desert bare land where GPP is close to 0 year-round.
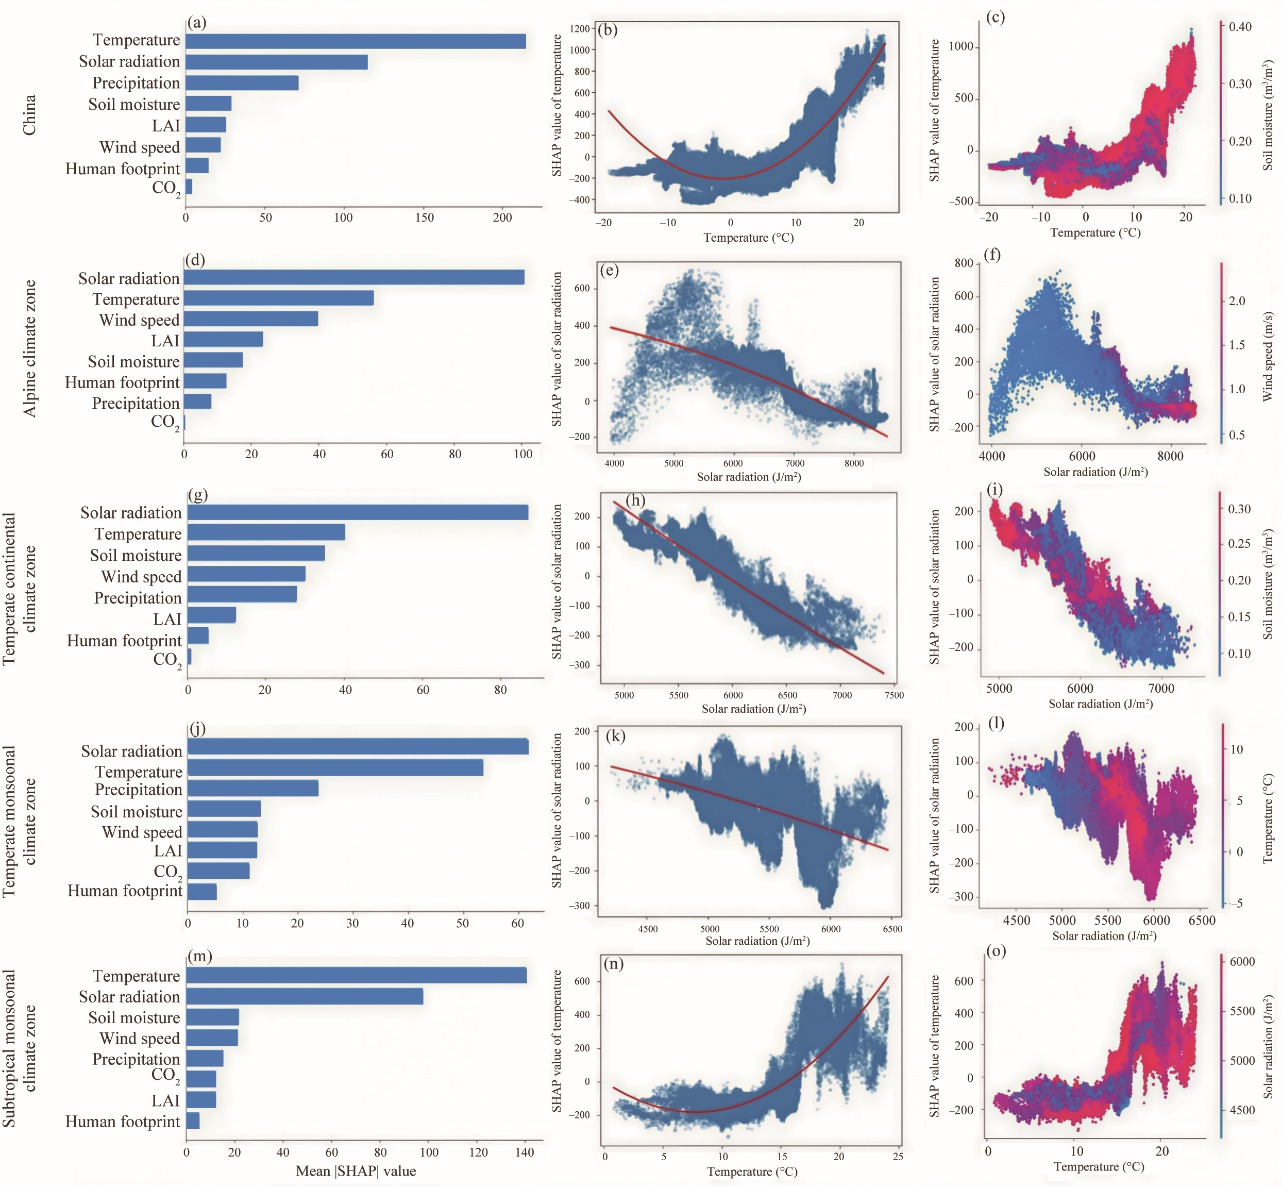
Fig. 12Global SHapley Additive exPlanations (SHAP) bar (a, d, g, j, and m), univariate polynomial SHAP dependence curve (b, e, h, k, and n), and dominant factor interaction SHAP (c, f, i, l, and o) graphs. The point colors in Figure 12c, f, i, l, and o indicate the magnitude of the interacting variable, and blue represents low values and red represents high values.
[1]
Baptist F, Choler P. 2008. A simulation of the importance of length of growing season and canopy functional properties on the seasonal gross primary production of temperate alpine meadows. Annals of Botany, 101(4): 549-559.
doi: 10.1093/aob/mcm318
pmid: 18182383
[2]
Beer C, Reichstein M, Tomelleri E, et al. 2010. Terrestrial gross carbon dioxide uptake: global distribution and covariation with climate. Science, 329(5993): 834-838.
doi: 10.1126/science.1184984
pmid: 20603496
[3]
Cai W J, Prentice I C. 2020. Recent trends in gross primary production and their drivers: Analysis and modelling at flux-site and global scales. Environmental Research Letters, 15(12): 124050, doi: 10.1088/1748-9326/abc64e.
[4]
Cao B, Wang Y, Zhang X L, et al. 2024. Spatial heterogeneity and the increasing trend of vegetation and their driving mechanisms in the mountainous area of Haihe River Basin. Remote Sensing, 16(3): 587, doi: 10.3390/rs16030587.
[5]
Chen M Z, Xue Y Y, Xue Y B, et al. 2024a. Assessing the effects of climate and human activity on vegetation change in northern China. Environmental Research, 247: 118233, doi: 10.1016/j.envres.2024.118233.
[6]
Chen X, Cai A N, Guo R J, et al. 2023. Variation of gross primary productivity dominated by leaf area index in significantly greening area. Journal of Geographical Sciences, 33(8): 1747-1764.
doi: 10.1007/s11442-023-2151-5
[7]
Chen Z F, Wang W G, Forzieri G, et al. 2024b. Transition from positive to negative indirect CO2 effects on vegetation carbon uptake. Nature Communications, 15(1): 1500, doi: 10.1038/s41467-024-45957-x.
[8]
Clifford M J, Royer P D, Cobb N S, et al. 2013. Precipitation thresholds and drought-induced tree die-off: Insights from patterns of Pinus edulis mortality along an environmental stress gradient. New Phytologist, 200(2): 413-421.
doi: 10.1111/nph.12362
pmid: 23772860
[9]
de Kauwe M G, Keenan T F, Medlyn B E, et al. 2016. Satellite based estimates underestimate the effect of CO2 fertilization on net primary productivity. Nature Climate Change, 6(10): 892-893.
doi: 10.1038/nclimate3105
[10]
Dong J Q, Li L H, Li Y Z, et al. 2022. Inter-comparisons of mean, trend and interannual variability of global terrestrial gross primary production retrieved from remote sensing approach. Science of The Total Environment, 822: 153343, doi: 10.1016/j.scitotenv.2022.153343.
[11]
Fan J, Liu B Y, Lei T J, et al. 2025. Exploring how economic level drives urban flood risk. Nature Communications, 16: 4857, doi: 10.1038/s41467-025-60267-6.
[12]
Gao J B, Jiao K W, Wu S H, et al. 2017. Past and future effects of climate change on spatially heterogeneous vegetation activity in China. Earth's Future, 5(7): 679-692.
doi: 10.1002/eft2.2017.5.issue-7
[13]
He P C, Ye Q, Yu K L, et al. 2025. Relationship between wind speed and plant hydraulics at the global scale. Nature Ecology & Evolution, 9(2): 273-281.
[14]
Huang X J, Ma M G, Wang X F, et al. 2018. The uncertainty analysis of the MODIS GPP product in global maize croplands. Frontiers of Earth Science, 12(4): 739-749.
doi: 10.1007/s11707-018-0716-x
[15]
Kang Y H, Bassiouni M, Gaber M, et al. 2025. CEDAR-GPP: spatiotemporally upscaled estimates of gross primary productivity incorporating CO2 fertilization. Earth System Science Data, 17(6): 3009-3046.
doi: 10.5194/essd-17-3009-2025
[16]
Li H Z, He Y Y, Zhang L F, et al. 2023. Spatiotemporal changes of gross primary production in the Yellow River Basin of China under the influence of climate-driven and human activity. Global Ecology and Conservation, 46: e02550, doi: 10.1016/j.gecco.2023.e02550.
[17]
Li S, Chen Y N, Wei W, et al. 2024a. Increase in extreme precipitation and its proportion over global land. Journal of Hydrology, 628: 130456, doi: 10.1016/j.jhydrol.2023.130456.
[18]
Li W W, Yan D H, Weng B S, et al. 2024b. Nonlinear effects of surface soil moisture changes on vegetation greenness over the Tibetan Plateau. Remote Sensing of Environment, 302: 113971, doi: 10.1016/j.rse.2023.113971.
[19]
Liu Y, Liu H H, Chen Y, et al. 2022. Quantifying the contributions of climate change and human activities to vegetation dynamic in China based on multiple indices. Science of The Total Environment, 838: 156553, doi: 10.1016/j.scitotenv.2022.156553.
[20]
Liu Y Y, Liu R G, Chen J M. 2012. Retrospective retrieval of long-term consistent global leaf area index (1981-2011) from combined AVHRR and MODIS data. Journal of Geophysical Research: Biogeosciences, 117(G4): G04003, doi: 10.1029/2012JG002084.
[21]
Lu Q K, Liu H, Wei L F, et al. 2024. Global prediction of gross primary productivity under future climate change. Science of The Total Environment, 912: 169239, doi: 10.1016/j.scitotenv.2023.169239.
[22]
Lundberg S M, Lee S I. 2017. A unified approach to interpreting model predictions. In:Proceedings of the 31st International Conference on Neural Information Processing Systems (NIPS 2017). Long Beach: Neural Information Processing Systems Foundation, 4768-4777.
[23]
McMurtrie R E, Norby R J, Medlyn B E, et al. 2008. Why is plant-growth response to elevated CO2 amplified when water is limiting? Functional Plant Biology, 35(6): 521-534.
doi: 10.1071/FP08128
pmid: 32688808
[24]
Mu H W, Li X C, Wen Y N, et al. 2022. A global record of annual terrestrial human footprint dataset from 2000 to 2018. Scientific Data, 9: 176, doi: 10.1038/s41597-022-01284-8.
pmid: 35440581
[25]
Muñoz Sabater J. 2019. ERA5-Land monthly averaged data from 1950 to present. [2025-09-24]. https://cds.climate.copernicus.eu/datasets/reanalysis-era5-land-monthly-means?tab=overview.
[26]
Myhre G, Alterskjær K, Stjern C W, et al. 2019. Frequency of extreme precipitation increases extensively with event rareness under global warming. Scientific Reports, 9: 16063, doi: 10.1038/s41598-019-52277-4.
pmid: 31690736
[27]
Nemani R R, Keeling C D, Hashimoto H, et al. 2003. Climate-driven increases in global terrestrial net primary production from 1982 to 1999. Science, 300(5625): 1560-1563.
pmid: 12791990
[28]
Oda T, Maksyutov S. 2011. A very high-resolution (1 km×1 km) global fossil fuel CO2 emission inventory derived using a point source database and satellite observations of nighttime lights. Atmospheric Chemistry and Physics, 11(2): 543-556.
[29]
Pearson T R H, Brown S, Casarim F M. 2014. Carbon emissions from tropical forest degradation caused by logging. Environmental Research Letters, 9(3): 034017, doi: 10.1088/1748-9326/9/3/034017.
[30]
Peñuelas J, Filella I. 2001. Responses to a warming world. Science, 294(5543): 793-795.
doi: 10.1126/science.1066860
pmid: 11679652
[31]
Piao S L, Nan H J, Huntingford C, et al. 2014. Evidence for a weakening relationship between interannual temperature variability and northern vegetation activity. Nature Communications, 5: 5018, doi: 10.1038/ncomms6018.
pmid: 25318638
[32]
Piao S L, Wang X H, Park T, et al. 2020. Characteristics, drivers and feedbacks of global greening. Nature Reviews Earth & Environment, 1: 14-27.
[33]
Puma M J, Koster R D, Cook B I. 2013. Phenological versus meteorological controls on land-atmosphere water and carbon fluxes. Journal of Geophysical Research: Biogeosciences, 118(1): 14-29.
doi: 10.1029/2012JG002088
[34]
Reich P B, Hobbie S E, Lee T D. 2014. Plant growth enhancement by elevated CO2 eliminated by joint water and nitrogen limitation. Nature Geoscience, 7(12): 920-924.
doi: 10.1038/ngeo2284
[35]
Ren Y H, Wang H, Yang K, et al. 2024. Vegetation productivity slowdown on the Tibetan Plateau around the late 1990s. Geophysical Research Letters, 51(4): e2023GL103865, doi: 10.1029/2023GL103865.
[36]
Robinson A, Lehmann J, Barriopedro D, et al. 2021. Increasing heat and rainfall extremes now far outside the historical climate. npj Climate and Atmospheric Science, 4: 45, doi: 10.1038/s41612-021-00202-w.
[37]
Running S, Zhao M. 2021. MODIS/Terra gross primary productivity gap-filled 8-day L4 global 500m SIN grid V061. [2025-09-24]. https://lpdaac.usgs.gov/products/mod17a2hgfv061/.
[38]
Running S W, Nemani R R, Heinsch F A, et al. 2004. A continuous satellite-derived measure of global terrestrial primary production. BioScience, 54(6): 547-560.
doi: 10.1641/0006-3568(2004)054[0547:ACSMOG]2.0.CO;2
[39]
Schimel D, Stephens B B, Fisher J B. 2015. Effect of increasing CO2 on the terrestrial carbon cycle. Proceedings of the National Academy of Sciences, 112(2): 436-441.
[40]
Sen P K. 1968. Estimates of the regression coefficient based on Kendall's tau. Journal of the American Statistical Association, 63(324): 1379-1389.
doi: 10.1080/01621459.1968.10480934
[41]
Shapley L S. 1953. A value for n-person games. Annals of Mathematical Studies, 28: 307-317.
[42]
Sun Z Y, Wang X F, Yamamoto H, et al. 2018. Spatial pattern of GPP variations in terrestrial ecosystems and its drivers: Climatic factors, CO2 concentration and land-cover change, 1982-2015. Ecological Informatics, 46: 156-165.
doi: 10.1016/j.ecoinf.2018.06.006
[43]
Sun Z Y, Wang X F, Yamamoto H, et al. 2020. The effects of spatiotemporal patterns of atmospheric CO2 concentration on terrestrial gross primary productivity estimation. Climatic Change, 163(2): 913-930.
doi: 10.1007/s10584-020-02903-2
[44]
Wang B Y, Si J H, Jia B, et al. 2024a. Monitoring spatial-temporal variability of vegetation coverage and its influencing factors in the Yellow River Source Region from 2000 to 2020. Remote Sensing, 16(24): 4772, doi: 10.3390/rs16244772.
[45]
Wang J, Price K P, Rich P M. 2001. Spatial patterns of NDVI in response to precipitation and temperature in the central Great Plains. International Journal of Remote Sensing, 22(18): 3827-3844.
doi: 10.1080/01431160010007033
[46]
Wang L R, Shi P J, Luo J, et al. 2024b. Region-county characteristics of spatiotemporal dynamic evolution and influencing factors on agricultural net carbon sink in Hexi Region of Gansu Province. Ecological Indicators, 169: 112817, doi: 10.1016/j.ecolind.2024.112817.
[47]
Wang M M, Zhang L M. 2023. Synchronous changes of GPP and solar-induced chlorophyll fluorescence in a subtropical evergreen coniferous forest. Plants, 12(11): 2224, doi: 10.3390/plants12112224.
[48]
Wang S H, Zhang Y G, Ju W M, et al. 2020. Recent global decline of CO2 fertilization effects on vegetation photosynthesis. Science, 370(6522): 1295-1300.
doi: 10.1126/science.abb7772
[49]
Wen Y Y, Liu X P, Xin Q C, et al. 2019. Cumulative effects of climatic factors on terrestrial vegetation growth. Journal of Geophysical Research: Biogeosciences, 124(4): 789-806.
doi: 10.1029/2018JG004751
[50]
Wu S H, Yin Y H, Zhao D S, et al. 2010. Impact of future climate change on terrestrial ecosystems in China. International Journal of Climatology, 30(6): 866-873.
doi: 10.1002/joc.v30:6
[51]
Xu X J, Jiao F S, Liu H Y, et al. 2022. Persistence of increasing vegetation gross primary production under the interactions of climate change and land use changes in Northwest China. Science of The Total Environment, 834: 155086, doi: 10.1016/j.scitotenv.2022.155086.
[52]
Yang Z H, Gong J, Wang S M, et al. 2023. Shifts bidirectional dependency between vegetation greening and soil moisture over the past four decades in China. Science of The Total Environment, 897: 166388, doi: 10.1016/j.scitotenv.2023.166388.
[53]
Yun H B, Ciais P, Zhu Q, et al. 2024. Changes in above-versus belowground biomass distribution in permafrost regions in response to climate warming. Proceedings of the National Academy of Sciences of the United States of America, 121(25): e2314036121, doi: 10.1073/pnas.2314036121.
[54]
Zaitchik B F, Rodell M, Biasutti M, et al. 2023. Wetting and drying trends under climate change. Nature Water, 1(6): 502-513.
doi: 10.1038/s44221-023-00073-w
[55]
Zhang K, Kimball J S, Nemani R R, et al. 2015. Vegetation greening and climate change promote multidecadal rises of global land evapotranspiration. Scientific Reports, 5: 15956, doi: 10.1038/srep15956.
pmid: 26514110
[56]
Zhang W X, Furtado K, Wu P L, et al. 2021. Increasing precipitation variability on daily-to-multiyear time scales in a warmer world. Science Advances, 7(31): eabf8021, doi: 10.1126/sciadv.abf8021.
[57]
Zhang X, Su J X, Ji Y H, et al. 2024. Nitrogen deposition affects the productivity of planted and natural forests by modulating forest climate and community functional traits. Forest Ecology and Management, 563: 121970, doi: 10.1016/j.foreco.2024.121970.
[58]
Zhang Z S, Xue Y Y, Chen M Z, et al. 2025. Spatiotemporal patterns and driving mechanisms of evapotranspiration in China simulated by the Priestley-Taylor Jet Propulsion Laboratory mode. Ecological Indicators, 179: 114183, doi: 10.1016/j.ecolind.2025.114183.
[59]
Zhao M S, Running S W. 2010. Drought-induced reduction in global terrestrial net primary production from 2000 through 2009. Science, 329(5994): 940-943.
doi: 10.1126/science.1192666
pmid: 20724633
[60]
Zhao Y, Chen Y, Wu C, et al. 2023. Exploring the contribution of environmental factors to evapotranspiration dynamics in the Three-River-Source region, China. Journal of Hydrology, 626: 130222, doi: 10.1016/j.jhydrol.2023.130222.
[61]
Zhu Z C, Piao S L, Myneni R B, et al. 2016. Greening of the Earth and its drivers. Nature Climate Change, 6(8): 791-795.
doi: 10.1038/NCLIMATE3004