Mechanisms driving surface wind speed increases in an ecologically fragile region of Northwest China: Insights from circulation anomalies and geographical detector analysis
WANG Yongliang*(), ZHANG Weijiang
School of Civil and Hydraulic Engineering, Ningxia University, Yinchuan 750021, China
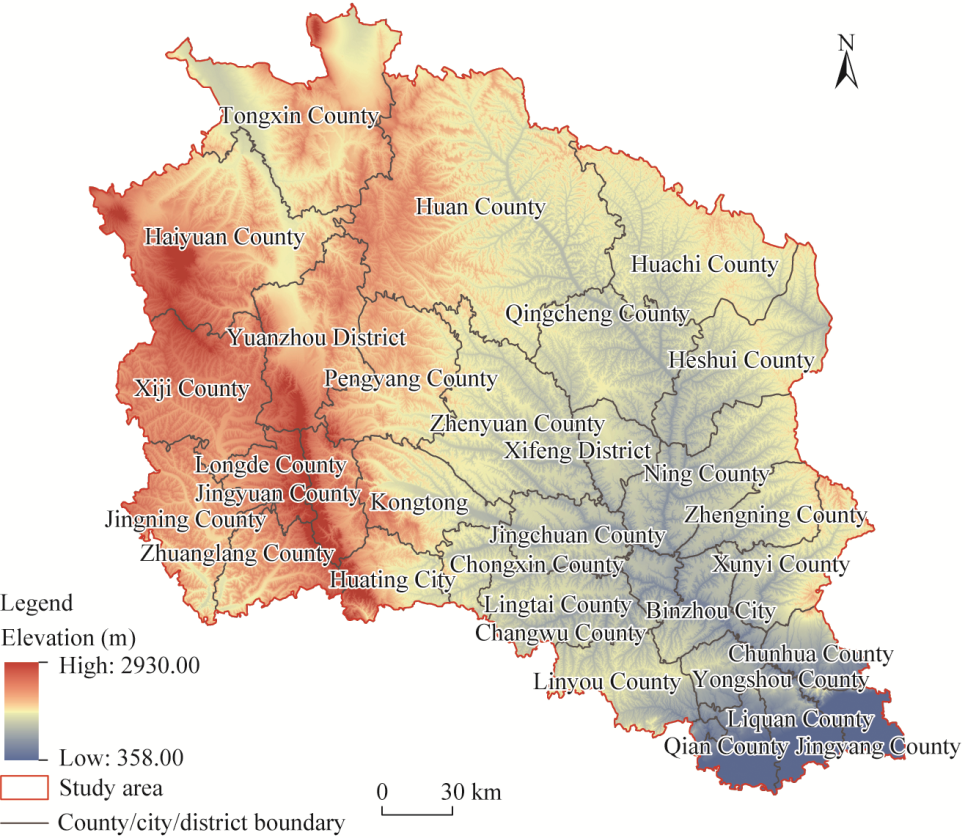
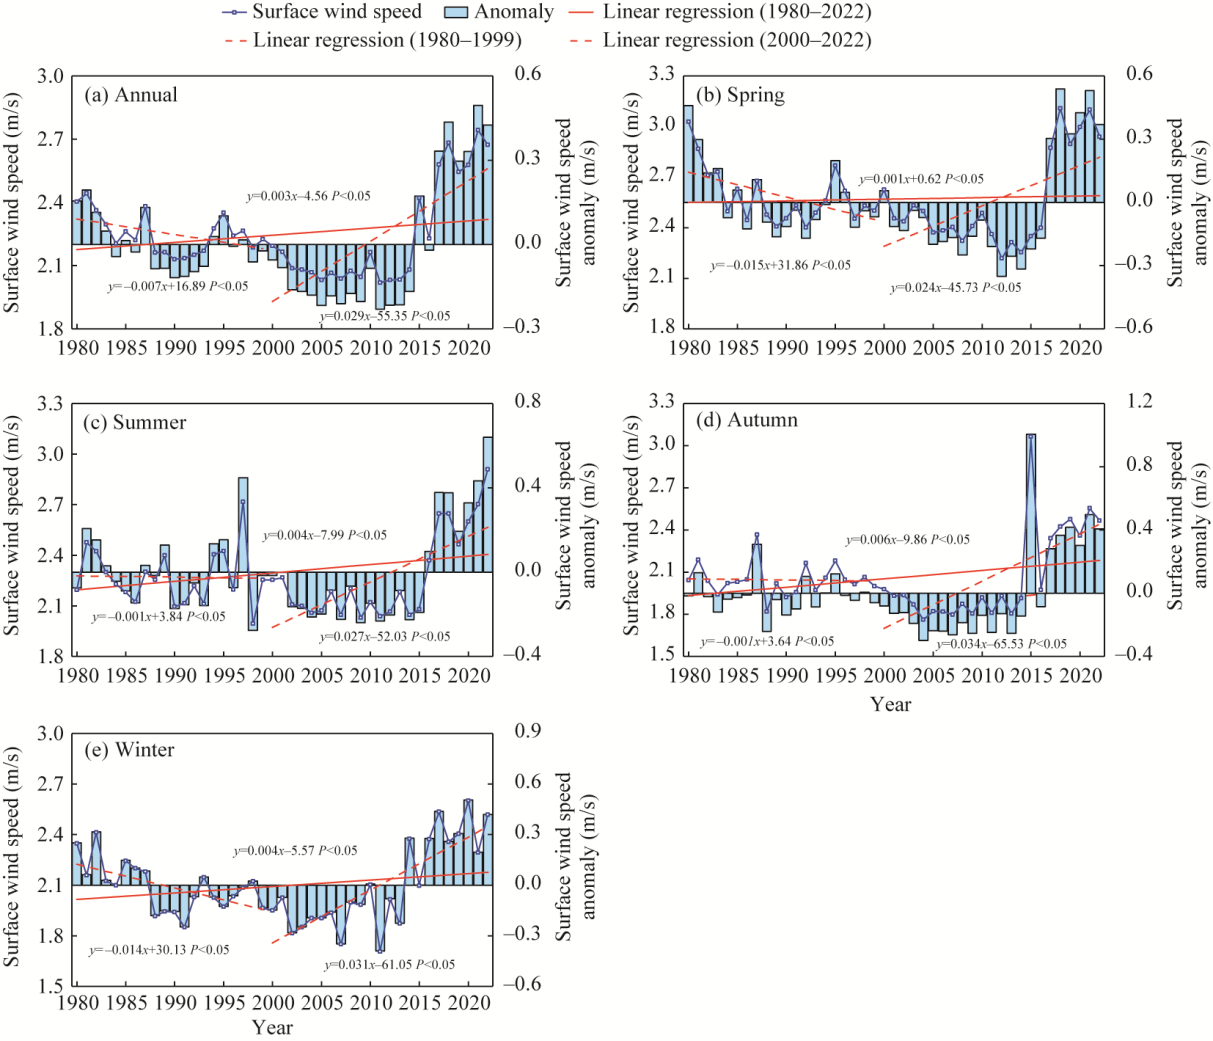
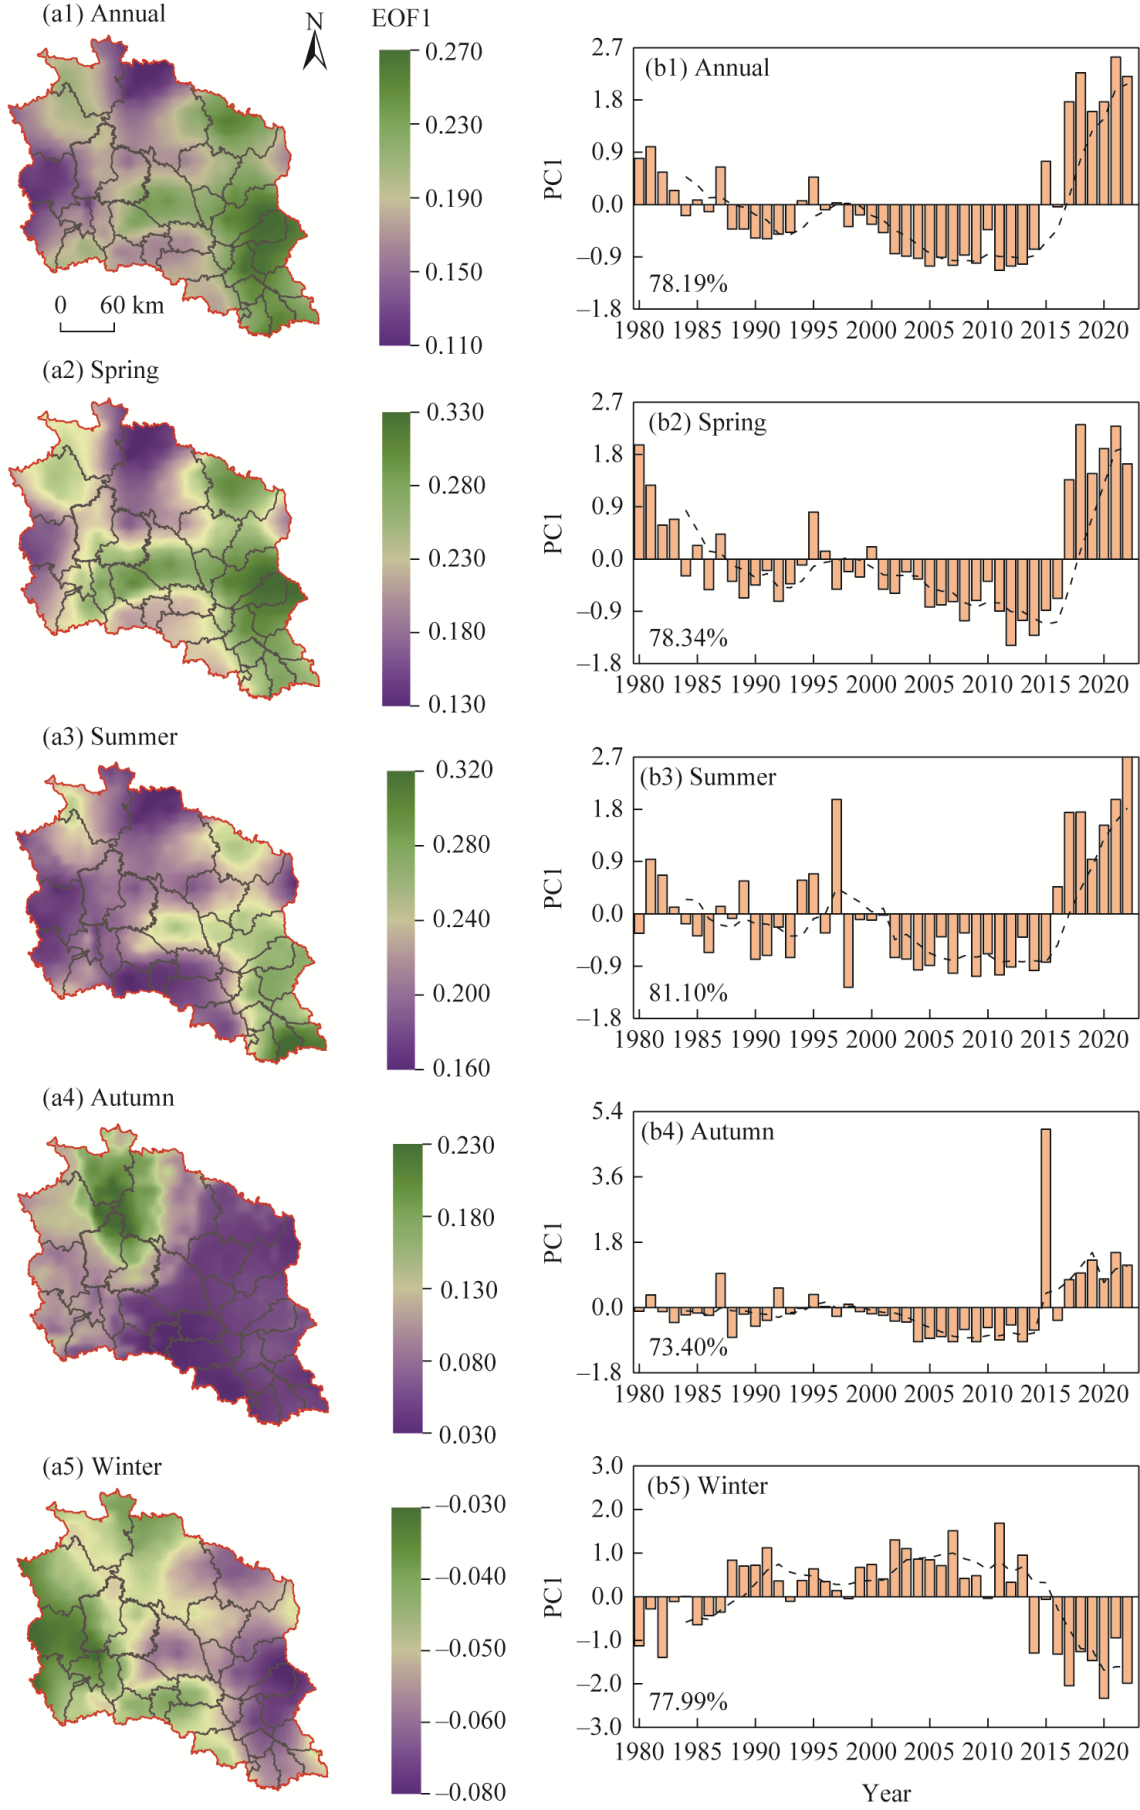
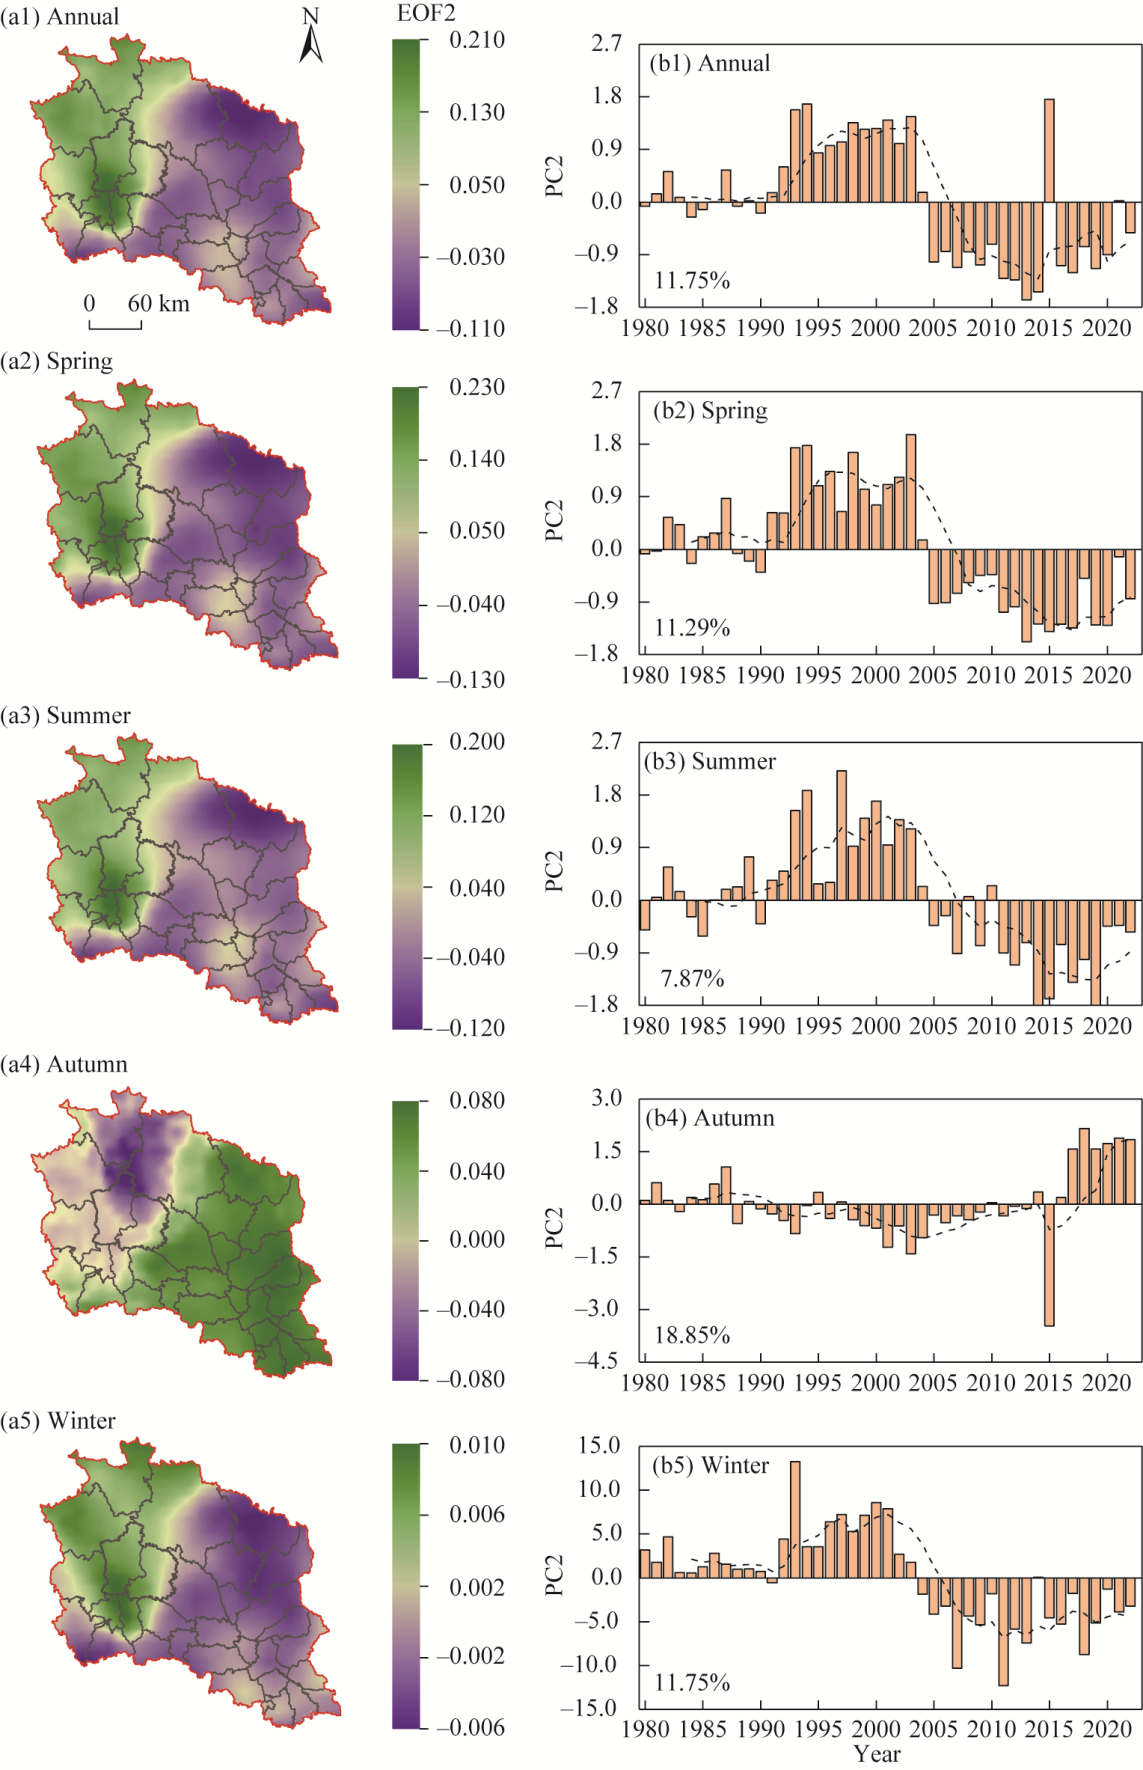
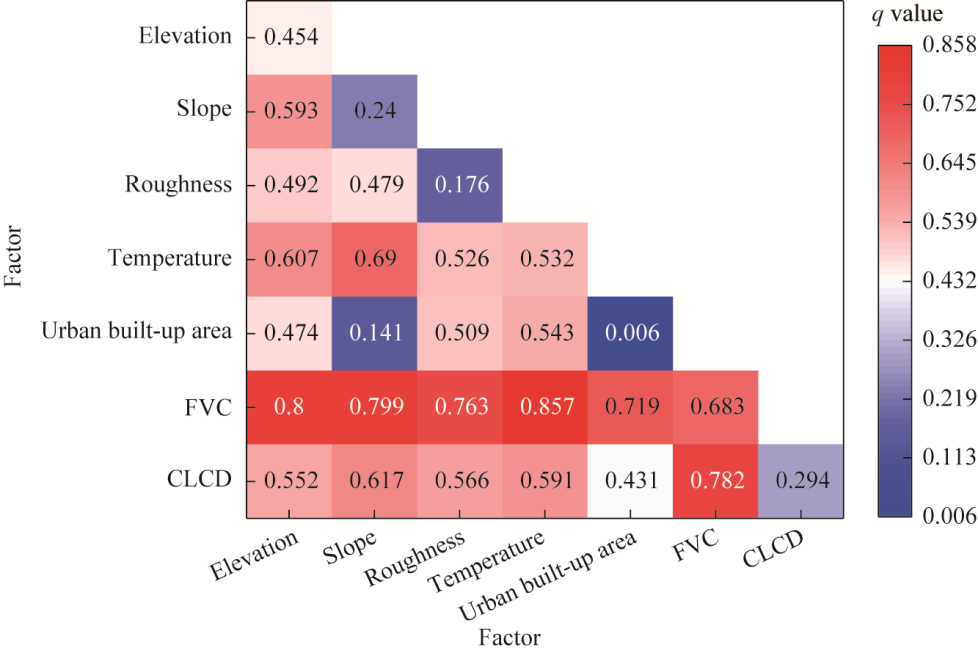
The Shaanxi-Gansu-Ningxia (SGN) border region, as a typical transitional zone between the East Asian monsoon and the westerlies, features a fragile ecological environment. In this study, the spatiotemporal evolution and multiscale driving mechanisms of surface winds in this ecologically fragile transition zone were investigated by integrating trend analysis, empirical orthogonal function (EOF) decomposition, and geographic detector method. The results indicated that from 1980 to 2022, the annual mean surface wind speeds in the SGN border region significantly increased, with a linear growth rate of 0.003 m/(s•a). However, the anomaly series revealed a clear interdecadal transition: surface wind speed anomalies were predominantly negative from 1980 to 1999 and shifted to persistently positive and increasing anomalies after 2000. Consistent strengthening was observed in summer, autumn, and winter, with the most pronounced increase occurring in autumn. The spatial distribution generally followed a pattern of higher values in the northwest and lower values in the southeast. Spring presented the strongest surface wind speeds and the most extensive areas with high values. EOF analysis revealed two dominant spatial modes: the first mode (variance contribution>73.40%) reflected regionally consistent changes, and its temporal coefficients increased continuously, corresponding to the overall strengthening trend of surface wind speed; and the second mode exhibited an east-west dipole oscillation pattern, dominated by interannual fluctuations. The geographic detector results revealed that fractional vegetation cover (FVC), temperature, and topographic elevation were key factors influencing the spatial differentiation of surface wind speeds, with all the factors exhibiting enhanced interactive effects—especially the synergistic effect between vegetation cover and temperature. Background circulation analysis indicated that enhanced westerlies and decreased geopotential height in the mid- to upper-troposphere provided favourable dynamic conditions for increased surface wind speeds. This study advances the understanding of surface wind speed changes in climate transition zones, providing a scientific basis for regional wind energy planning, ecological protection, and wind erosion control.
Received: 16 December 2025
Published: 30 June 2026
Writing - original draft preparation: WANG Yongliang; Visualization: WANG Yongliang; Software: WANG Yongliang; Methodology: WANG Yongliang, ZHANG Weijiang; Formal analysis: WANG Yongliang; Data curation: WANG Yongliang; Writing - review & editing: WANG Yongliang; Supervision: ZHANG Weijiang; Funding acquisition: ZHANG Weijiang. All authors approved the manuscript.
WANG Yongliang, ZHANG Weijiang. Mechanisms driving surface wind speed increases in an ecologically fragile region of Northwest China: Insights from circulation anomalies and geographical detector analysis. Journal of Arid Land, 2026, 18(6): 928-948.
Table S1 Classification thresholds for continuous factors
Interaction criteria
Interaction type
q(X1∩X2)<Min(q(X1), q(X2))
Nonlinear weakening
Min(q(X1), q(X2))<q(X1∩X2)<Max(q(X1), q(X2))
Univariate weakening
q(X1∩X2)>Max(q(X1), q(X2))
Bivariate enhancement
q(X1∩X2)=q(X1)+q(X2)
Independent
q(X1∩X2)>q(X1)+q(X2)
Nonlinear enhancement
Table 1 Criteria of the interaction types
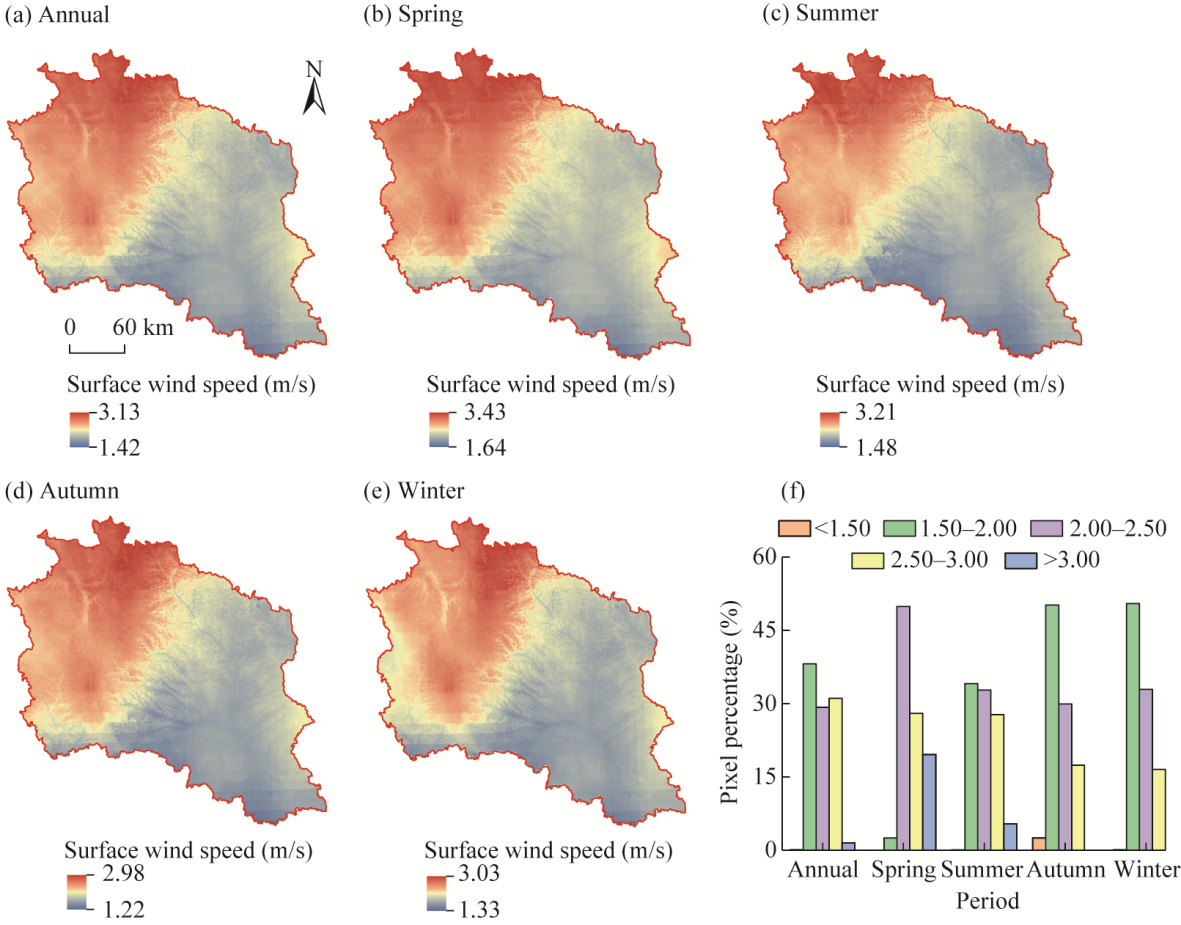
Fig. 2Spatial (a-e) and percentage (f) distribution of the annual and seasonal surface wind speeds in the study area from 1980 to 2022
Fig. 3Temporal variation in the annual (a), spring (b), summer (c), autumn (d), and winter (e) surface wind speeds in the study area from 1980 to 2022
Fig. 4Spatial distribution (a) and temporal coefficient (b) of the first eigenvector field in the study area from 1980 to 2022. EOF1, first mode of empirical orthogonal function; PC1, first principal component (temporal coefficient). The black dashed line represents the 5 a moving average of the PC1 temporal coefficient. The value in the lower-left corner denotes the variance contribution of the first mode.
Fig. 5Spatial distribution (a) and temporal coefficient of the second eigenvector field in the study area from 1980 to 2022. EOF2, second mode of empirical orthogonal function; PC2, second principal component (temporal coefficient). The black dashed line represents the 5 a moving average of the PC2 temporal coefficient. The value in the lower-left corner denotes the variance contribution of the second mode.
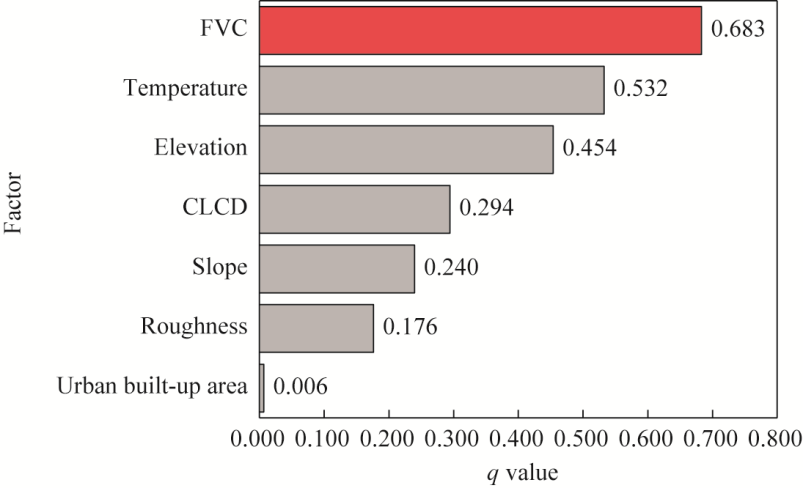
Fig. 6q value of each factor to surface wind speed in the Shaanxi-Gansu-Ningxia (SGN) border region. FVC, fractional vegetation cover; CLCD, China Land Cover Dataset.
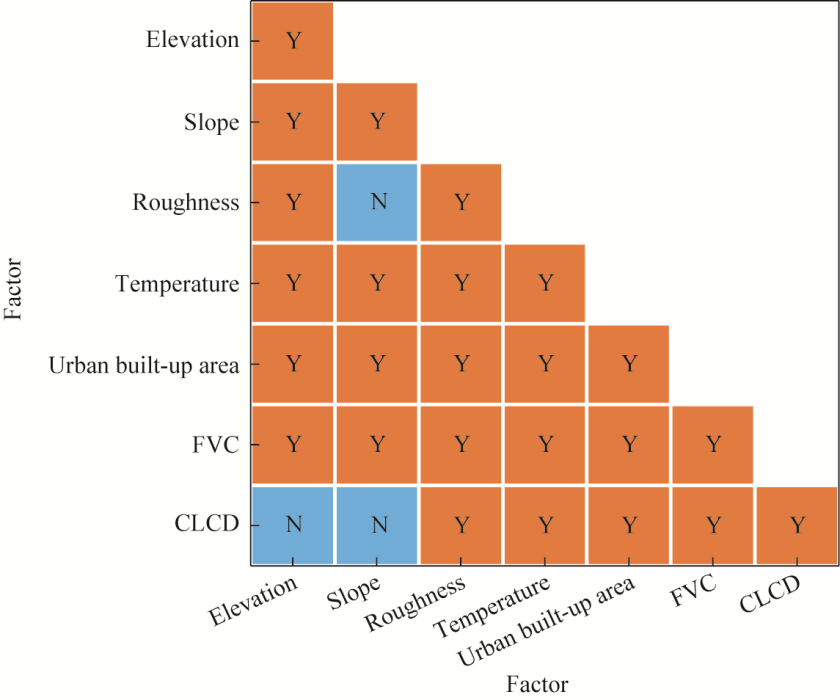
Fig. 7Ecological detection in the SGN border region. In the matrix, 'Y' indicates a statistically significant difference (P<0.05) between the effects of the two factors on surface wind speeds, whereas 'N' indicates no significant difference.
Fig. 8Interaction detection between factor-pairs in the SGN border region. The error bars represent the 95% confidence intervals of the q values based on 1000 bootstrap resamples.
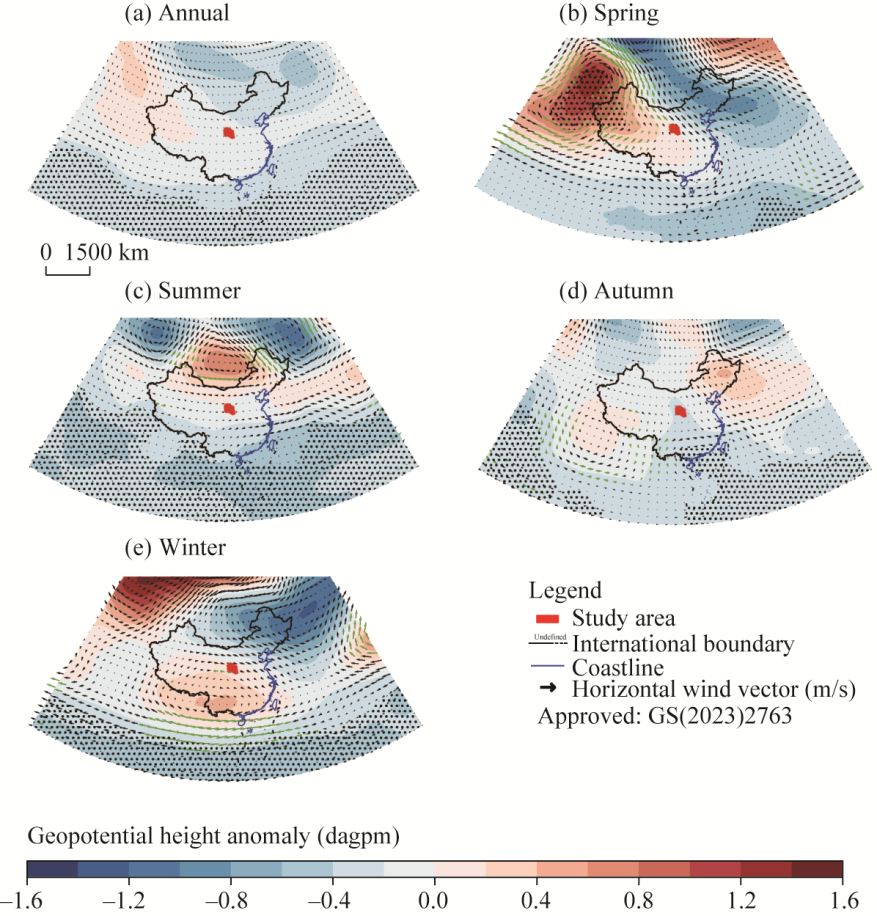
Fig. 9Composite differences in the annual (a), spring (b), summer (c), autumn (d), and winter (e) 500-hPa geopotential height and horizontal winds in the SGN border region from 2000-2022 minus 1980-1999. Stippling represents the statistical significance of the 500-hPa geopotential height exceeding the 90% confidence level. The light green vectors refer to the 500-hPa horizontal wind differences exceeding the 90% confidence level.
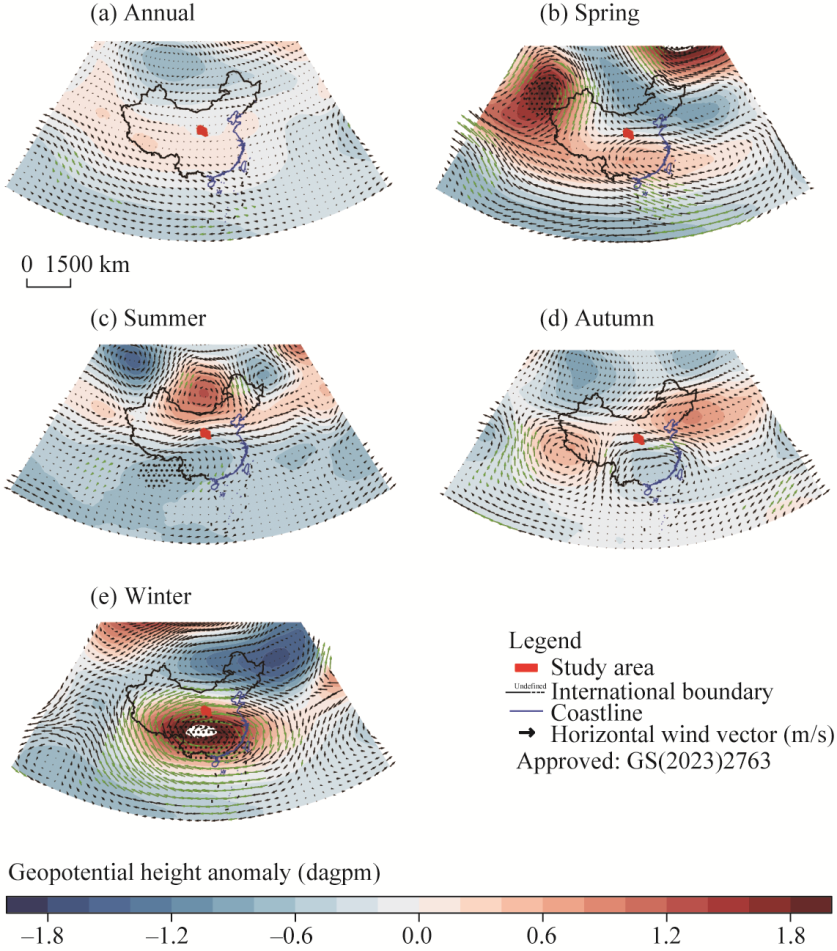
Fig. 10Composite differences in the annual (a), spring (b), summer (c), autumn (d), and winter (e) 200-hPa geopotential height and horizontal winds in the SGN border region from 2000-2022 minus 1980-1999. Stippling represents the statistical significance of the 200-hPa geopotential height exceeding the 90% confidence level. The light green vectors refer to the 200-hPa horizontal wind differences exceeding the 90% confidence level. In panel e (winter), the white areas indicate that the absolute difference in 200-hPa geopotential height between the two periods is near zero, implying little to no change in the mean geopotential height.
[1]
Ahmed K, Sachindra D A, Shahid S, et al. 2020. Multi-model ensemble predictions of precipitation and temperature using machine learning algorithms. Atmospheric Research, 236: 104806, doi: 10.1016/j.atmosres.2019.104806.
[2]
Akinsanola A A, Ogunjobi K O, Abolude A T, et al. 2021. Projected changes in wind speed and wind energy potential over West Africa in CMIP6 models. Environmental Research Letters, 16(4): 044033, doi: 10.1088/1748-9326/abed7a.
[3]
Azorin-Molina C, Rehman S, Guijarro J A, et al. 2018. Recent trends in wind speed across Saudi Arabia, 1978-2013: a break in the stilling. International Journal of Climatology, 38: e966-e984.
[4]
Chen Y Z, Feng X M, Tian H Q, et al. 2021. Accelerated increase in vegetation carbon sequestration in China after 2010: a turning point resulting from climate and human interaction. Global Change Biology, 27(22): 5848-5864.
doi: 10.1111/gcb.15854
pmid: 34416063
[5]
Deng H X, Tang Q H, Yun X B, et al. 2022a. Wetting trend in Northwest China reversed by warmer temperature and drier air. Journal of Hydrology, 613: 128435, doi: 10.1016/j.jhydrol.2022.128435.
[6]
Deng X J, Hu S, Zhan C S. 2022b. Attribution of vegetation coverage change to climate change and human activities based on the geographic detectors in the Yellow River Basin, China. Environmental Science and Pollution Research, 29: 44693-44708.
doi: 10.1007/s11356-022-18744-8
[7]
Diao W J, Zhao Y, Dong Y Y, et al. 2020. Spatiotemporal variability of surface wind speed during 1961-2017 in the Jing-Jin-Ji Region, China. Journal of Meteorological Research, 34(3): 621-632.
doi: 10.1007/s13351-020-9119-5
[8]
Ge J, Feng D P, You Q L, et al. 2021. Characteristics and causes of surface wind speed variations in Northwest China from 1979 to 2019. Atmospheric Research, 254: 105527, doi: 10.1016/j.atmosres.2021.105527.
[9]
Guo Q K, Cheng C C, Jiang H T, et al. 2019. Comparative rates of wind and water erosion on typical farmland at the northern end of the Loess Plateau, China. Geoderma, 352: 104-115.
doi: 10.1016/j.geoderma.2019.05.011
[10]
He P C, Ye Q, Yu K L, et al. 2025. Relationship between wind speed and plant hydraulics at the global scale. Nature Ecology & Evolution, 9(2): 273-281.
[11]
Hersbach H, Bell B, Berrisford P, et al. 2020. The ERA5 global reanalysis. Quarterly Journal of the Royal Meteorological Society, 146(730): 1999-2049.
doi: 10.1002/qj.v146.730
[12]
Hu Y Y, Zhang L. 2024. Added value of merging techniques in precipitation estimates relative to gauge-interpolation algorithms of varying complexity. Journal of Hydrology, 645: 132214, doi: 10.1016/j.jhydrol.2024.132214.
[13]
Kim J, Paik K. 2015. Recent recovery of surface wind speed after decadal decrease: a focus on South Korea. Climate Dynamics, 45(5): 1699-1712.
doi: 10.1007/s00382-015-2546-9
[14]
Laurila T K, Sinclair V A, Gregow H. 2021. Climatology, variability, and trends in near-surface wind speeds over the North Atlantic and Europe during 1979-2018 based on ERA5. International Journal of Climatology, 41(4): 2253-2278.
doi: 10.1002/joc.v41.4
[15]
Li X, Pan Y J, Jiang Y S. 2022. The analysis of the spatiotemporal variations and mechanisms for the near-surface wind speed over China in the last 40 years. Theoretical and Applied Climatology, 148(3): 1163-1180.
doi: 10.1007/s00704-022-03991-z
[16]
Li Y P, Chen Y N, Li Z, et al. 2018. Recent recovery of surface wind speed in Northwest China. International Journal of Climatology, 38(12): 4445-4458.
doi: 10.1002/joc.2018.38.issue-12
[17]
Li Z B, Sun M, Shen C, et al. 2025. ENSO‐driven seasonal variability in near‐surface wind speed and wind power potential across China. Geophysical Research Letters, 52(9): e2025GL115537, doi: 10.1029/2025GL115537.
[18]
Liu R H, Zhang X L, Wang W, et al. 2024. Global-scale ERA 5 product precipitation and temperature evaluation. Ecological Indicators, 166: 112481, doi: 10.1016/j.ecolind.2024.112481.
[19]
Ma Y T, Gong J, Jin T T, et al. 2025. Comparison of different vegetation indices for estimating vegetation changes and analyzing driving factors in a semi-arid area, China. Journal of Arid Land, 17(12): 1785-1805.
doi: 10.1007/s40333-025-0035-5
[20]
Meng Z J, Dang X H, Gao Y, et al. 2018. Interactive effects of wind speed, vegetation coverage and soil moisture in controlling wind erosion in a temperate desert steppe, Inner Mongolia of China. Journal of Arid Land, 10(4): 534-547.
doi: 10.1007/s40333-018-0059-1
[21]
Öztürk Ş, Yılmaz K, Dinçer A E, et al. 2024. Effect of urbanization on surface runoff and performance of green roofs and permeable pavement for mitigating urban floods. Natural Hazards, 120(13): 12375-12399.
doi: 10.1007/s11069-024-06688-w
[22]
Piao S L, Wang X H, Park T, et al. 2020. Characteristics, drivers and feedbacks of global greening. Nature Reviews Earth & Environment, 1: 14-27.
[23]
Sun Y, Zhang X B, Ding Y H, et al. 2022. Understanding human influence on climate change in China. National Science Review, 9(3): nwab113, doi: 10.1093/nsr/nwab113.
[24]
Wang J F, Zhang T L, Fu B J. 2016. A measure of spatial stratified heterogeneity. Ecological Indicators, 67: 250-256.
doi: 10.1016/j.ecolind.2016.02.052
[25]
Wang L, Hou C Z, Pang X H, et al. 2025. Slowdown of dune migration in East Asia's inland deserts: A 35‐year response to wind stilling. Geophysical Research Letters, 52(16): e2024GL113506, doi: 10.1029/2024GL113506.
[26]
Wang R, Mo Z W, Yang L T, et al. 2024a. Long-term trend of surface wind speed in the Guangdong-Hong Kong-Macau Greater Bay Area during 1980-2020: spatiotemporal variation and urbanization effect. Urban Climate, 56: 101999, doi: 10.1016/j.uclim.2024.101999.
[27]
Wang Y L, Zhang W J, Zhang P C, et al. 2024b. Spatial and temporal variations of precipitation in Northwest China during 1973-2019. Theoretical and Applied Climatology, 155(6): 4347-4356.
doi: 10.1007/s00704-024-04884-z
[28]
Woolway R I, Kraemer B M, Lenters J D, et al. 2020. Global lake responses to climate change. Nature Reviews Earth & Environment, 1(8): 388-403.
[29]
Wu H H, Fu C S, Zhang L L, et al. 2025. Significant sensitivity of global vegetation productivity to terrestrial surface wind speed changes. Nature Communications, 16(1): 9315, doi: 10.1038/s41467-025-65000-x.
[30]
Yan Y W, Wang G H, Wang X H, et al. 2023. Relationship between subsurface diurnal warming and wind speed. Deep Sea Research Part I: Oceanographic Research Papers, 199: 104106, doi: 10.1016/j.dsr.2023.104106.
[31]
You Q L, Fraedrich K, Min J Z, et al. 2014. Observed surface wind speed in the Tibetan Plateau since 1980 and its physical causes. International Journal of Climatology, 34(6): 1873-1882.
doi: 10.1002/joc.2014.34.issue-6
[32]
Yu W S, Yao T D, Tian L D, et al. 2008. Relationships between δ18O in precipitation and air temperature and moisture origin on a south-north transect of the Tibetan Plateau. Atmospheric Research, 87(2): 158-169.
doi: 10.1016/j.atmosres.2007.08.004
[33]
Zha J L, Wu J, Zhao D M. 2017. Effects of land use and cover change on the near-surface wind speed over China in the last 30 years. Progress in Physical Geography, 41(1): 46-67.
[34]
Zha J L, Chuan T, Wu J, et al. 2024. Attribution of terrestrial near‐surface wind speed changes across China at a centennial scale. Geophysical Research Letters, 51(7): e2024GL108241, doi: 10.1029/2024GL108241.
[35]
Zhang G F, Cesar A M, Chen D L, et al. 2021a. Uneven warming likely contributed to declining near‐surface wind speeds in northern China between 1961 and 2016. Journal of Geophysical Research: Atmospheres, 126(11): e2020JD033637, doi: 10.1029/2020JD033637.
[36]
Zhang G F, Cesar A M, Chen D L, et al. 2024a. Variability and trends of near-surface wind speed over the Tibetan Plateau: the role played by the westerly and Asian monsoon. Advances in Climate Change Research, 15(3): 525-536.
doi: 10.1016/j.accre.2024.04.007
[37]
Zhang L, Li X, Zheng D H, et al. 2021b. Merging multiple satellite-based precipitation products and gauge observations using a novel double machine learning approach. Journal of Hydrology, 594: 125969, doi: 10.1016/j.jhydrol.2021.125969.
[38]
Zhang R H, Zhang S Y, Luo J L, et al. 2019. Analysis of near-surface wind speed change in China during 1958-2015. Theoretical and Applied Climatology, 137(3): 2785-2801.
doi: 10.1007/s00704-019-02769-0
[39]
Zhang T, Xu X, Jiang H L, et al. 2022. Widespread decline in winds promoted the growth of vegetation. Science of The Total Environment, 825: 153682, doi: 10.1016/j.scitotenv.2022.153682.
[40]
Zhang W, Zhang L S, Liu J K. 2024b. Satellite-based re-examination of changes in terrestrial near-surface wind speed in the last 30 years. Frontiers in Earth Science, 12: 1398638, doi: 10.3389/feart.2024.1398638.
[41]
Zhang Z T, Wang K C. 2020. Stilling and recovery of the surface wind speed based on observation, reanalysis, and geostrophic wind theory over China from 1960 to 2017. Journal of Climate, 33(10): 3989-4008.
doi: 10.1175/JCLI-D-19-0281.1
[42]
Zhou L H, Zeng Z Z, Cesar A M, et al. 2021. A continuous decline of global seasonal wind speed range over land since 1980. Journal of Climate, 34(23): 9443-9461.
[43]
Zuo Y F, Li Y H, He K N, et al. 2022. Temporal and spatial variation characteristics of vegetation coverage and quantitative analysis of its potential driving forces in the Qilian Mountains, China, 2000-2020. Ecological Indicators, 143: 109429, doi: 10.1016/j.ecolind.2022.109429.