Moderate threshold friction velocities dominate Gobi Desert dust emission: evidence from integrated optical and microwave satellite sensors
Batjargal BUYANTOGTOKH1,2, MAO Rui1,*(), JIN Jianbing3, Naransukh URTNASAN2
1School of National Safety and Emergency Management, Beijing Normal University, Beijing 100875, China 2Information and Research Institute of Meteorology, Hydrology, and Environment, Ulaanbaatar 15160, Mongolia 3State Key Laboratory of Climate System Prediction and Risk Management, School of Environmental Science and Engineering, Nanjing University of Information Science and Technology, Nanjing 210044, China
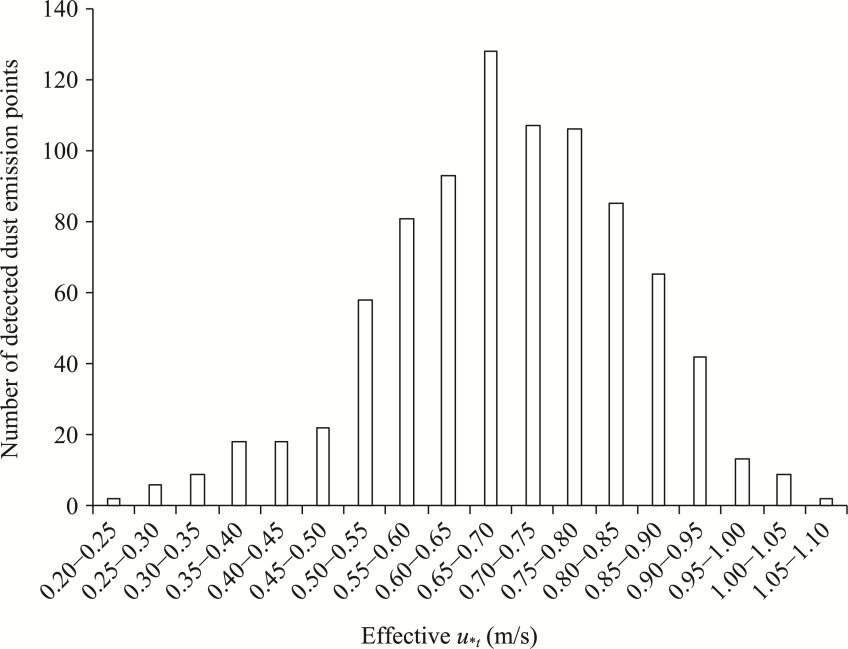
Dust emission is initiated when the wind friction velocity exceeds a surface-dependent threshold; however, whether low-, moderate-, or high-threshold surfaces contribute most to dust emission, particularly across the Gobi Desert, remains unclear. This study addressed this question by detecting dust emission point sources across southern Mongolia and northern China using nine years (January 2017-May 2025) of high- and moderate-resolution optical satellite imagery from Sentinel-2, Landsat-8/9, and Sentinel-3 through visual interpretation. We estimated effective threshold friction velocities (u*t) from Sentinel-1 C-band synthetic aperture radar (SAR) data and analyzed these values under dry spring conditions and during confirmed dust emission events. Our analysis of 4984 dust emission point sources revealed five major and nine minor dust source regions, primarily associated with lake basins, topographic depressions, mountain foothills, and gully systems. The major dust source regions included the Gaxun Nur Basin, Urad Rear Banner, and Alagxa Left Banner in China and the Ulaan Lake Basin, Orog Lake Basin, and Taatsiin Tsagaan Lake Basin in Mongolia. These regions exhibited moderate effective u*t ranging from 0.50 to 0.95 m/s. In contrast, little or no dust emission was detected from mountain ranges characterized by high effective u*t (>1.20 m/s) or from major sandy deserts (e.g., the Badain Jaran, Tengger, and Ulan Buh deserts), despite their extremely low effective u*t (<0.20 m/s). Limited dust emission was observed in settings with moderate-to-high effective u*t (0.95-1.10 m/s), such as mountain foothills and gully systems, and on surfaces with low-to-moderate effective u*t (0.20-0.50 m/s). These findings indicated that frequent dust emission is confined to geomorphological settings with moderate effective u*t and active fluvial sediment supply, whereas mountain foothills and gully systems act as secondary, episodic sources because of their relatively high effective u*t. Identifying this moderate effective u*t range for frequent dust emission refines the representation of surface erodibility in dust emission models and highlights priority regions for future field-based measurements of sediment properties.
Received: 07 December 2025
Published: 31 October 2026
Conceptualization: Batjargal BUYANTOGTOKH, MAO Rui; Methodology: Batjargal BUYANTOGTOKH, MAO Rui, JIN Jianbing; Formal analysis and investigation: Batjargal BUYANTOGTOKH, MAO Rui, JIN Jianbing, Naransukh URTNASAN; Original draft preparation: Batjargal BUYANTOGTOKH, MAO Rui; Writing- review and editing: Batjargal BUYANTOGTOKH, MAO Rui, JIN Jianbing; Resources: Batjargal BUYANTOGTOKH, Naransukh URTNASAN; Supervision: MAO Rui, JIN Jianbing; Funding acquisition: Batjargal BUYANTOGTOKH, MAO Rui. All authors approved the manuscript.
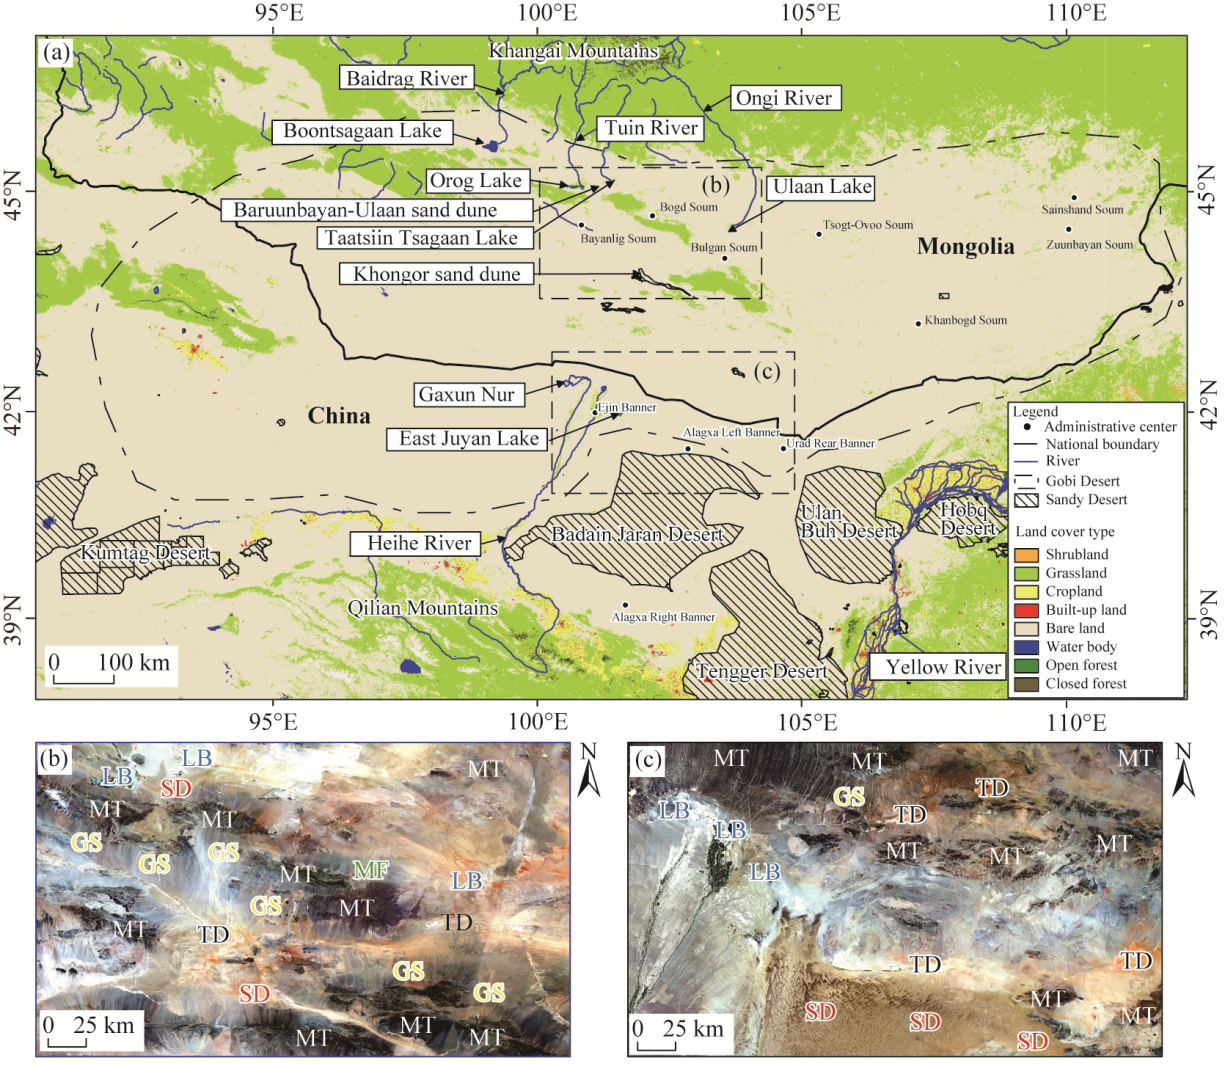
Fig. 1Overview of the study area based on the land cover map (a) and major geomorphological features in two typical regions based on Sentinel-2 true-color imagery (b and c). The land cover map is sourced from the Copernicus Land Monitoring Service (CLMS) Land Cover dataset in 2020 (https://land.copernicus.eu). Geomorphological units are labelled as follows: lake basin (LB), topographic depression (TD), gully system (GS), mountain (MT), mountain foothill (MF), and sand dune (SD). Note that Figure 1a is based on the standard map (GS(2016)1666) of the National Platform for Common GeoSpatial Information Services (http:// bzdt.ch.mnr.gov.cn/), and the boundary of the standard map has not been modified.
Fig. 2Overview of the study area based on Sentinel-3 true-color imagery (1270-km swath width; a) and examples of dust emission point sources identified by visual interpretation of Sentinel-2 imagery (b and c), Landsat-9 imagery (d), and Sentinel-3 imagery of Urad Rear Banner, China (e). The black and white dashed rectangles indicate the swath widths of Sentinel-2 (290 km) and Landsat-8/9 (185 km), respectively.
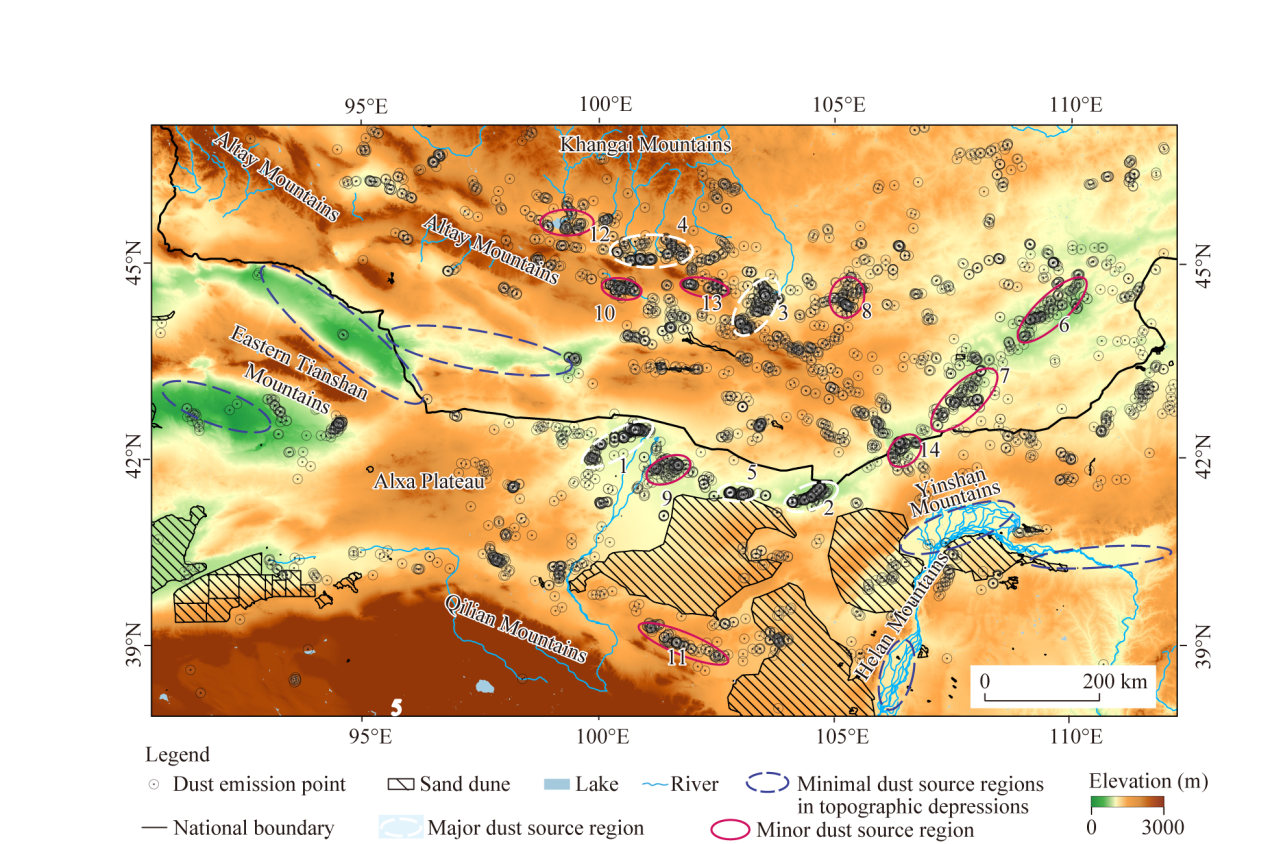
Fig. 3Spatial distribution of dust emission point sources identified from optical satellite imagery during the observation period from January 2017 to May 2025. Dust emission point sources are overlaid on a topographic background. The elevation data are sourced from OpenTopography (https://portal.opentopography.org/). The dust source regions are labelled with numbers: '1' indicates the Gaxun Nur Basin; '2' indicates the Urad Rear Banner; '3' indicates the Ulaan Lake Basin and Bulgan Soum; '4' indicates the Orog Lake Basin and Taatsiin Tsagaan Lake Basin; '5' indicates the Alagxa Left Banner; '6' indicates the Sainshand-Zuunbayan region; '7' indicates the eastern Khanbogd Soum; '8' indicates the Tsogt-Ovoo Soum; '9' indicates the East Juyan Lake Basin; '10' indicates the Bayanlig Soum; '11' indicates the Alagxa Right Banner; '12' indicates the Boontsagaan Lake Basin; '13' indicates the Bogd Soum; and '14' indicates a small depression located on the Mongolia-China border.
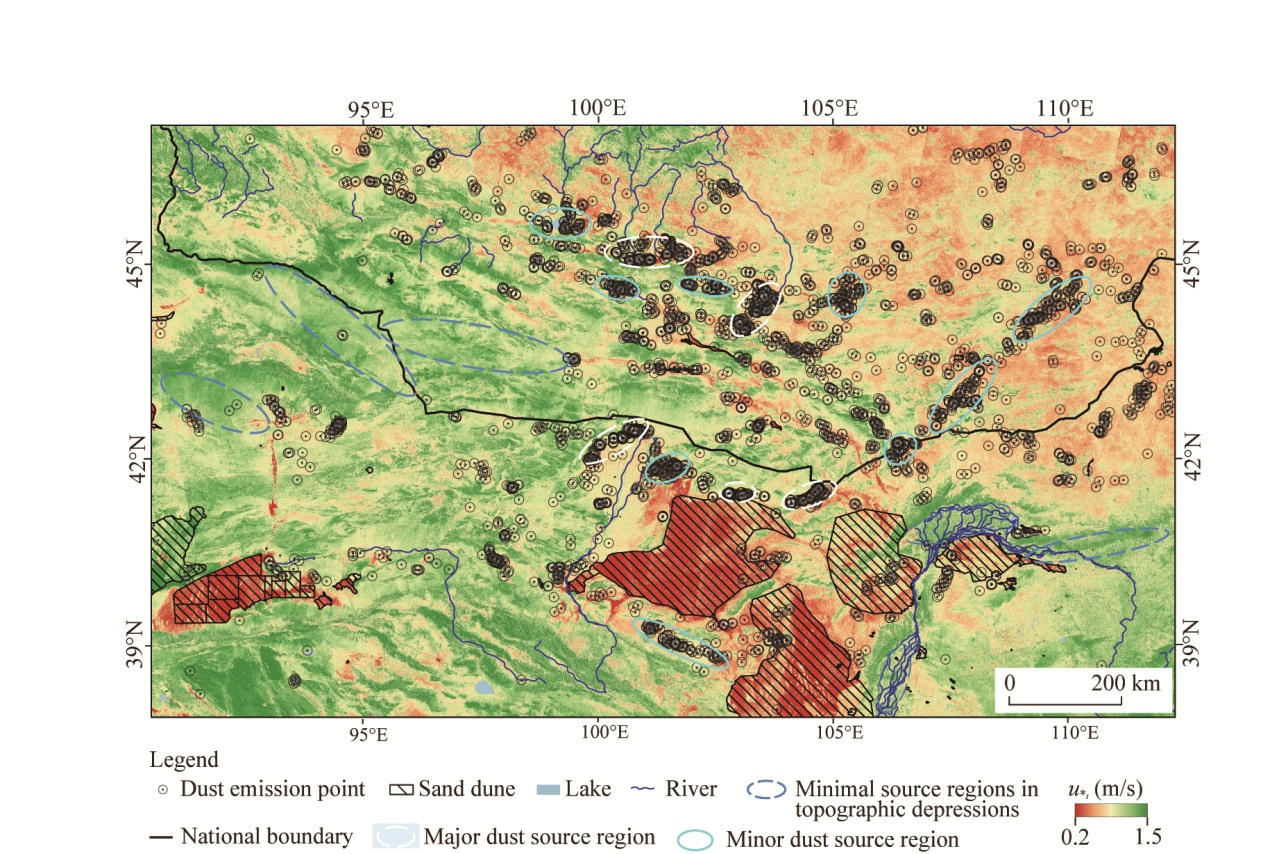
Fig. 4Spatial distribution of Sentinel-1 synthetic aperture radar (SAR) derived effective threshold friction velocities (u*t) under dry spring conditions in 2018, 2020, and 2021 and dust emission point sources during the observation period from January 2017 to May 2025. The estimated u*t results are based on 101 SAR acquisitions, including 87 scenes from April-May 2021, 10 scenes from February-April 2018, and 4 scenes from May 2020.
Fig. 5Time-series characteristics of effective u*t and dust emission activity (a1-a10) and corresponding Sentinel-2 true-color imagery showing dust emission conditions (b1-b10) in the Urad Rear Banner depression. The effective u*t maps in Figure 5a1-a10 are derived from the additional event-based SAR scenes used to investigate temporal variations in effective u*t at active dust-source regions, rather than from the 101 SAR scenes used for regional spatial coverage.
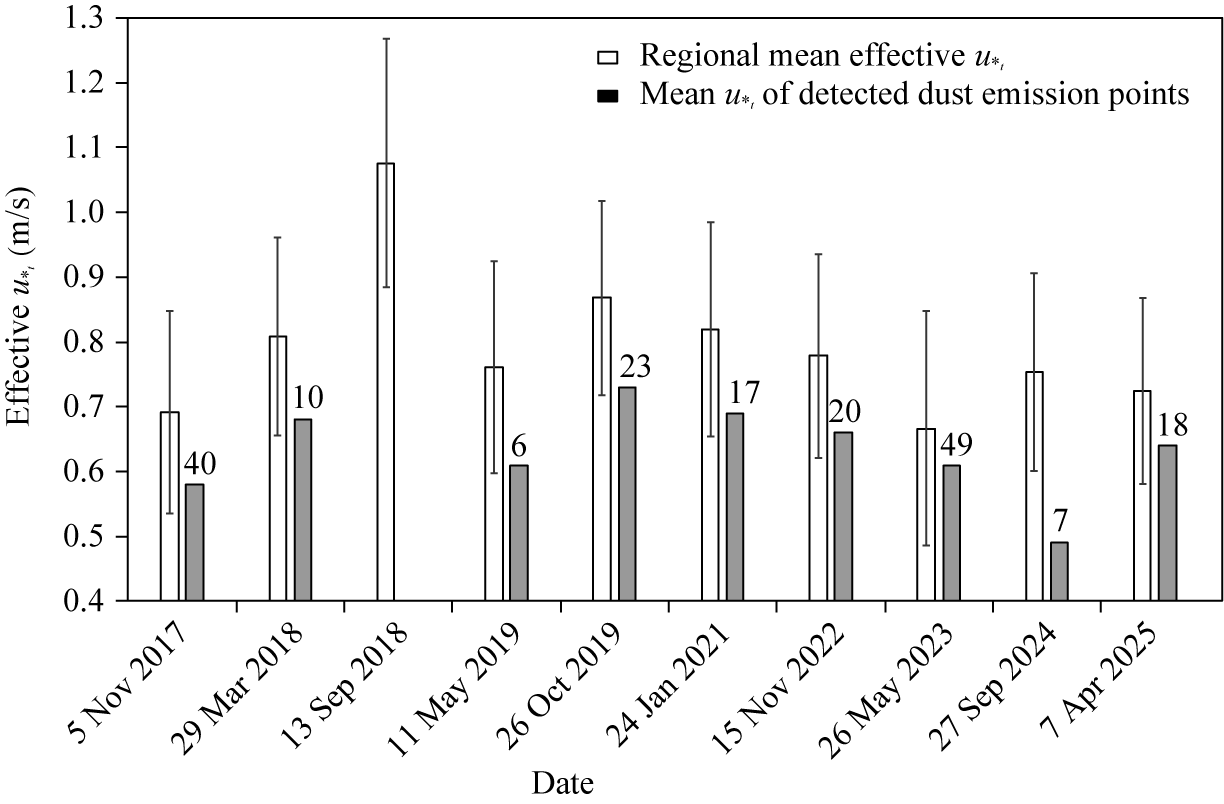
Fig. 6Temporal variation in regional mean effective u*t and mean effective u*t values sampled at specific dust emission point sources in the Urad Rear Banner depression. The regional mean effective u*t represents the mean effective u*t within the blue rectangle shown in Figure 5 and the error bars indicate the corresponding standard deviation. The numbers above the black bars indicate the total number of dust emission point sources detected during the observation period.
Fig. 7Frequency distribution of effective u*t values sampled at individual dust emission point sources. The distribution comprises a total of 865 effective u*t values sampled at dust emission point sources identified during April-May 2021 across the study area and during selected dust emission events from 2017 to 2025 in major dust source regions. For each identified dust emission point sources, the effective u*t values were extracted from the temporally closest SAR-derived effective u*t map within 0-5 d of the corresponding dust emission event. Dust emission points were identified from Sentinel-2 and Landsat-8/9 true-color imagery.
Fig. 8Representative patterns of effective u*t (a1-a6), dust emission conditions (b1-b6), and non-emission conditions (c1-c6) across key geomorphological settings. Sentinel-2 true-color imagery serves as the background for Figure 8b1-b6 and c1-c6.
[1]
Amazirh A, Merlin O, Er-Raki S, et al. 2018. Retrieving surface soil moisture at high spatio-temporal resolution from a synergy between Sentinel-1 radar and Landsat thermal data: a study case over bare soil. Remote Sensing of Environment, 211: 321-337.
doi: 10.1016/j.rse.2018.04.013
[2]
Baddock M C, Bryant R G, Acosta M D, et al. 2021. Understanding dust sources through remote sensing: making a case for CubeSats. Journal of Arid Environments, 184: 104335, doi: 10.1016/j.jaridenv.2020.104335.
[3]
Bah M K, Gunshor M M, Schmit T J. 2018. Generation of GOES-16 true color imagery without a green band. Earth and Space Science, 5(9): 549-558.
doi: 10.1029/2018EA000379
[4]
Bao X, Zhang R, Lü J C, et al. 2023. Vegetation descriptors from Sentinel-1 SAR data for crop growth monitoring. ISPRS Journal of Photogrammetry and Remote Sensing, 203: 86-114.
doi: 10.1016/j.isprsjprs.2023.07.023
[5]
Boloorani A D, Shorabeh S N, Samany N N, et al. 2021. Vulnerability mapping and risk analysis of sand and dust storms in Ahvaz, Iran. Environmental Pollution, 279: 116859, doi: 10.1016/j.envpol.2021.116859.
[6]
Boloorani A D, Papi R, Soleimani M, et al. 2023. Visual interpretation of satellite imagery for hotspot dust sources identification. Remote Sensing Applications: Society and Environment, 29: 100888, doi: 10.1016/j.rsase.2022.100888.
[7]
Boloorani A D, Nasiri N, Soleimani M, et al. 2024. A new approach to dust source mapping using visual interpretation and object-oriented segmentation of satellite imagery. Applied Computing and Geosciences, 23: 100182, doi: 10.1016/j.acags.2024.100182.
[8]
Brungard C W, Boettinger J L, Hipps L E. 2015. Wind erosion potential of lacustrine and alluvial soils before and after disturbance in the eastern Great Basin, USA: Estimating threshold friction velocity using easier-to-measure soil properties. Aeolian Research, 18: 185-203.
doi: 10.1016/j.aeolia.2015.07.006
[9]
Bullard J E, Harrison S P, Baddock M C, et al. 2011. Preferential dust sources: A geomorphological classification designed for use in global dust-cycle models. Journal of Geophysical Research, 116: F04034, doi: 10.1029/2011JF002061.
[10]
Buyantogtokh B, Kurosaki Y, Tsunekawa A, et al. 2021. Effect of stones on the sand saltation threshold during natural sand and dust storms in a stony desert in Tsogt-Ovoo in the Gobi Desert, Mongolia. Journal of Arid Land, 13(7): 653-673.
doi: 10.1007/s40333-021-0072-7
[11]
Buyantogtokh B, Kurosaki Y, Tsunekawa A, et al. 2022. Estimating the sand saltation thresholds from Sentinel-1 SAR data in the Gobi Desert, Mongolia. Journal of Arid Environments, 202: 104772, doi: 10.1016/j.jaridenv.2022.104772.
[12]
Chen L L, Schepanski K, Crocker A J, et al. 2025. Dust source activation frequency across East Asia. Environmental Research Letters, 20(7): 074056, doi: 10.1088/1748-9326/addee6.
[13]
Cooke R U. 1970. Stone pavements in deserts. Annals of the Association of American Geographers, 60(3): 560-577.
doi: 10.1111/j.1467-8306.1970.tb00741.x
[14]
Deroin J P, Company A, Simonin A. 1997. An empirical model for interpreting the relationship between backscattering and arid land surface roughness as seen with the SAR. IEEE Transactions on Geoscience and Remote Sensing, 35(1): 86-92.
doi: 10.1109/36.551937
[15]
Fécan F, Marticorena B, Bergametti G. 1998. Parametrization of the increase of the aeolian erosion threshold wind friction velocity due to soil moisture for arid and semi-arid areas. Annales Geophysicae, 17(1): 149-157.
doi: 10.1007/s00585-999-0149-7
[16]
Geudtner D, Torres R, Snoeij P, et al. 2014. Sentinel-1 system capabilities and applications. In: Proceedings of the 2014 IEEE Geoscience and Remote Sensing Symposium (IGARSS 2014). IEEE, 1457-1460.
[17]
Gillette D A. 1988. Threshold friction velocities for dust production for agricultural soils. Journal of Geophysical Research: Atmospheres, 93(D10): 12645-12662.
doi: 10.1029/JD093iD10p12645
[18]
Ginoux P, Chin M, Tegen I, et al. 2001. Sources and distributions of dust aerosols simulated with the GOCART model. Journal of Geophysical Research: Atmospheres, 106(D17): 20255-20273.
doi: 10.1029/2000JD000053
[19]
Hahnenberger M, Nicoll K. 2014. Geomorphic and land cover identification of dust sources in the eastern Great Basin of Utah, USA. Geomorphology, 204: 657-672.
doi: 10.1016/j.geomorph.2013.09.013
[20]
Ishizuka M, Mikami M, Yamada Y, et al. 2009. Threshold friction velocities of saltation sand particles for different soil moisture conditions in the Taklimakan Desert. Scientific Online Letters on the Atmosphere, 5: 184-187.
[21]
Kandakji T, Gill T E, Lee J A. 2020. Identifying and characterizing dust point sources in the southwestern United States using remote sensing and GIS. Geomorphology, 353: 107019, doi: 10.1016/j.geomorph.2019.107019.
[22]
Kok J F, Mahowald N M, Fratini G, et al. 2014. An improved dust emission model-Part 1: Model description and comparison against measurements. Atmospheric Chemistry and Physics, 14(23): 13023-13041.
[23]
Kok J F, Adebiyi A A, Albani S, et al. 2021. Contribution of the world's main dust source regions to the global cycle of desert dust. Atmospheric Chemistry and Physics, 21(10): 8169-8193.
[24]
Liu S J, Chen H, Tang K, et al. 2025. Innovative SAR-optical data fusion for reflectance time series reconstruction in vegetation-covered regions. International Journal of Applied Earth Observation and Geoinformation, 140: 104567, doi: 10.1016/j.jag.2025.104567.
[25]
Marticorena B, Bergametti G. 1995. Modeling the atmospheric dust cycle: 1. Design of a soil-derived dust emission scheme. Journal of Geophysical Research: Atmospheres, 100(D8): 16415-16430.
doi: 10.1029/95JD00690
[26]
Marticorena B, Kardous M, Bergametti G, et al. 2006. Surface and aerodynamic roughness in arid and semiarid areas and their relation to radar backscatter coefficient. Journal of Geophysical Research: Earth Surface, 111(F3): F03017, doi: 10.1029/2006JF000462.
[27]
Middleton N, Tozer P, Tozer B. 2019. Sand and dust storms: underrated natural hazards. Disasters, 43(2): 390-409.
doi: 10.1111/disa.12320
pmid: 30488534
[28]
Okin G S, Gillette D A, Herrick J E. 2006. Multi-scale controls on and consequences of aeolian processes in landscape change in arid and semi-arid environments. Journal of Arid Environments, 65(2): 253-275.
doi: 10.1016/j.jaridenv.2005.06.029
[29]
Raupach M R, Gillette D A, Leys J F. 1993. The effect of roughness elements on wind erosion threshold. Journal of Geophysical Research: Atmospheres, 98(D2): 3023-3032.
doi: 10.1029/92JD01922
[30]
Richards J A. 2009. Remote Sensing with Imaging Radar. Berlin: Springer, 150-210.
[31]
Shao Y P, Lu H. 2000. A simple expression for wind erosion threshold friction velocity. Journal of Geophysical Research: Atmospheres, 105(D17): 22437-22443.
doi: 10.1029/2000JD900304
[32]
Shao Y P. 2008. Physics and Modelling of Wind Erosion (2nd ed.). Dordrecht: Springer, 45-90.
[33]
Tan L H, Zhang W M, An Z S, et al. 2019. The effect of roughness density of gobi beds on the entrainment of sediment by wind: a wind tunnel study. Journal of Wind Engineering and Industrial Aerodynamics, 190: 183-189.
doi: 10.1016/j.jweia.2019.05.002
[34]
Ulaby F T, Dubois P C, van Zyl J. 1996. Radar mapping of surface soil moisture. Journal of Hydrology, 184(1-2): 57-84.
doi: 10.1016/0022-1694(95)02968-0
[35]
Ullmann T, Stauch G. 2020. Surface roughness estimation in the Orog Nuur basin (Southern Mongolia) using Sentinel-1 SAR time series and ground-based photogrammetry. Remote Sensing, 12(19): 3200, doi: 10.3390/rs12193200.
[36]
von Holdt J R, Eckardt F D, Wiggs G F S. 2017. Landsat identifies aeolian dust emission dynamics at the landform scale. Remote Sensing of Environment, 198: 229-243.
doi: 10.1016/j.rse.2017.06.010
[37]
Walker A L, Liu M, Miller S D, et al. 2009. Development of a dust source database for mesoscale forecasting in southwest Asia. Journal of Geophysical Research: Atmospheres, 114(D18): D18207, doi: 10.1029/2008JD011541.
[38]
Wang S K, Yang X Y, Luo C H, et al. 2026a. The 2025 extreme dust events in China: Evidence, attribution, and implications for regional air quality assessment. Atmosphere, 17(2): 213, doi: 10.3390/atmos17020213.
[39]
Wang T, Tsunekawa A, Xue X, et al. 2022. Combating Aeolian Desertification in Northeast Asia. Singapore: Springer, 17-58.
[40]
Wang T, Xiao X, Tan L H, et al. 2026b. Sand transport rate and turbulent fluctuation in aeolian transport over the Gobi surface under extremely high winds. Geophysical Research Letters, 53(1): e2025GL119770, doi: 10.1029/2025GL119770.
[41]
Wang X S, Zhang C L. 2021. Field observations of sand flux and dust emission above a gobi desert surface. Journal of Soils and Sediments, 21(4): 1815-1825.
doi: 10.1007/s11368-021-02883-5
[42]
Yang X H, Yang F, Zhou C L, et al. 2020. Improved parameterization for effect of soil moisture on threshold friction velocity for saltation activity based on observations in the Taklimakan Desert. Geoderma, 369: 114322, doi: 10.1016/j.geoderma.2020.114322.
[43]
Zhang K C, Zhang W M, Tan L H, et al. 2015. Effects of gravel mulch on aeolian transport: a field wind tunnel simulation. Journal of Arid Land, 7(3): 296-303.
doi: 10.1007/s40333-015-0121-1
[44]
Zribi M, Le Hégarat-Mascle S, Taconet O, et al. 2003. Derivation of wild vegetation cover density in semi-arid regions: ERS2/SAR evaluation. International Journal of Remote Sensing, 24(6): 1335-1352.
doi: 10.1080/01431160210146668