Unraveling the driving mechanisms of landscape connectivity dynamics in the Mu Us Sandy Land, northern China
JIN Xiaoze1,2,3, HE Zhaoquan1,2,3,4,*(), SHANG Xue1,2,3, WANG Xiukang1,2,3, XING Yingying1,2,3
1School of Life Sciences, Yan'an University, Yan'an 716000, China 2Key Laboratory of Applied Ecology of Universities in Shaanxi Province on the Loess Plateau, College of Life Sciences, Yan'an University, Yan'an 716000, China 3Shaanxi Key Laboratory of Research and Utilization of Resource Plants on the Loess Plateau, College of Life Sciences, Yan'an University, Yan'an 716000, China 4Northwest Institute of Eco-Environment and Resources, Chinese Academy of Sciences, Lanzhou 730000, China
The Mu Us Sandy Land, a critical agro-pastoral ecotone in northern China, served as a key region for understanding landscape connectivity dynamics under coupled climate-human pressures. This study used landscape pattern indices and the Geodetector model to systematically quantify the spatiotemporal dynamics of structural landscape connectivity in the Mu Us Sandy Land from 1990 to 2020 by integrating multi-temporal land use and meteorological data. The driving mechanisms of the landscape connectivity dynamics and present status of regional ecological restoration were analyzed. The results showed an overall decline in structural landscape connectivity over the past three decades, marked by a distinct spatial pattern of "decreasing in the east and increasing in the west". Fragmentation in the east was driven by intensive human expansion, while aggregation in the west resulted from long-term ecological restoration. Factor analysis revealed that structural landscape connectivity was jointly influenced by climatic and anthropogenic factors, with wide-ranging synergistic interactions. The dominant drivers changed temporally, i.e., in the early phases (1990-2000), natural factors (e.g., wind speed and temperature) and agricultural activities were the main drivers; in the transitional phase (2000-2010), precipitation played an important role; and in the later phases (2010-2020), the human-land synergy regime characterized by human activity factors, particularly residential density, gained predominant explanatory power. This study revealed the multifactor synergistic driving mechanisms and their temporal evolution, providing a scientific basis for adaptive ecological restoration and spatial planning in semi-arid regions.
Received: 21 March 2026
Published: 31 October 2026
Conceptualization: HE Zhaoquan, SHANG Xue, JIN Xiaoze; Data curation: XING Yingying; Formal analysis: HE Zhaoquan, WANG Xiukang; Funding acquisition: HE Zhaoquan; Investigation: XING Yingying; Methodology: SHANG Xue; Project administration: WANG Xiukang; Resources: WANG Xiukang; Software: WANG Xiukang; Supervision: JIN Xiaoze, XING Yingying; Validation: XING Yingying; Visualization: SHANG Xue, JIN Xiaoze; Writing - original draft preparation: JIN Xiaoze; Writing - review and editing: HE Zhaoquan, SHANG Xue, XING Yingying, WANG Xiukang. All authors approved the manuscript.
JIN Xiaoze, HE Zhaoquan, SHANG Xue, WANG Xiukang, XING Yingying. Unraveling the driving mechanisms of landscape connectivity dynamics in the Mu Us Sandy Land, northern China. Journal of Arid Land, 2026, 18(10): 1720-1738.
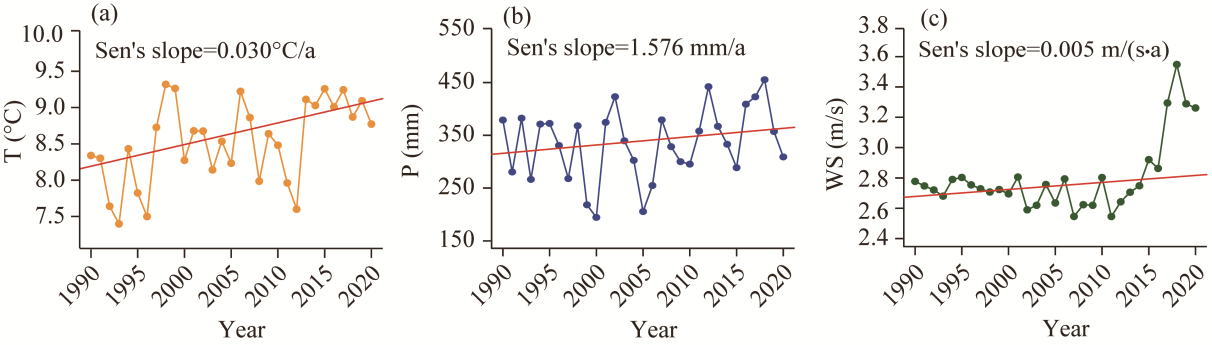
Table 2 Trend and persistence characteristic of meteorological factors
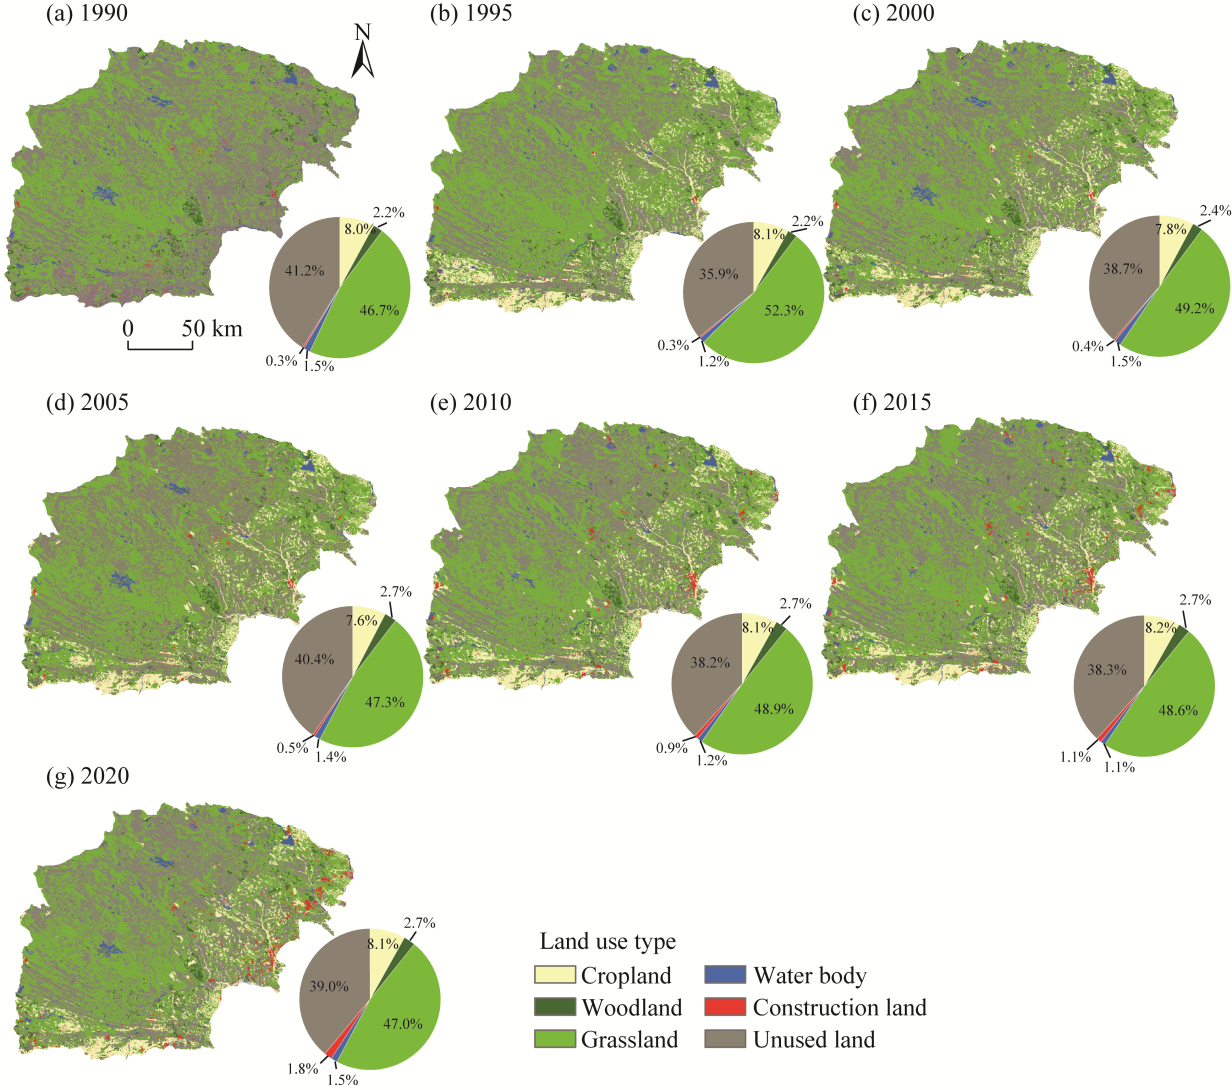
Fig. 4Spatial distribution and area proportion of land use types in the Mu Us Sandy Land from 1990 to 2020. (a), 1990; (b), 1995; (c), 2000; (d), 2005; (e), 2010; (f), 2015; (g), 2020.
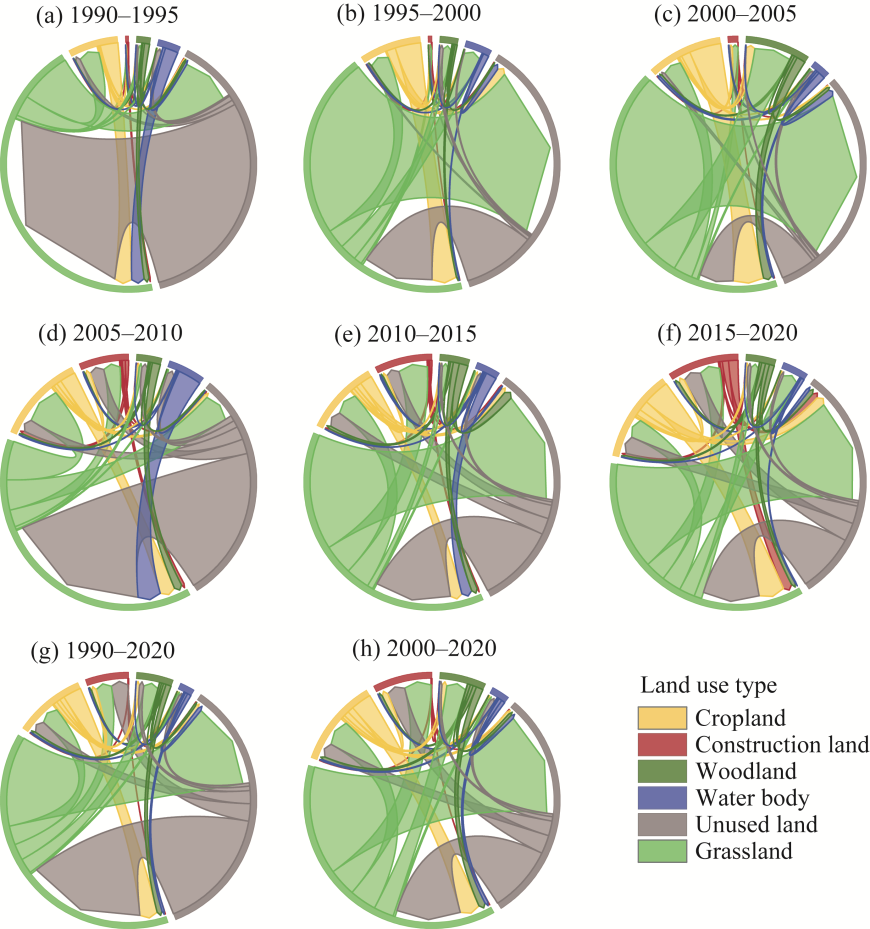
Fig. 5String diagram of land use type transition in the Mu Us Sandy Land in different periods. (a), 1990-1995; (b), 1995-2000; (c), 2000-2005; (d), 2005-2010; (e), 2010-2015; (f), 2015-2020; (g), 1990-2020; (h), 2000-2020.
Type
Grassland
Cropland
Construction land
Woodland
Water body
Unused land
Loss
(km2)
Grassland
15,978.070
260.277
222.630
205.957
25.526
1235.679
1950.069
Cropland
251.084
2615.525
65.247
51.768
17.575
50.446
2800.561
Construction land
2.092
4.743
124.228
0.232
0.482
1.184
130.869
Woodland
71.108
36.449
26.727
698.905
2.409
26.906
791.396
Water body
31.461
16.072
6.079
0.726
471.536
50.688
545.101
Unused land
1687.359
178.737
238.697
61.018
43.315
13,589.940
14,111.710
Gain
2043.104
2851.526
460.978
812.649
535.317
13,719.164
-
Table 3 Land use conversion matrix in the Mu Us Sandy Land from 1990 to 2020
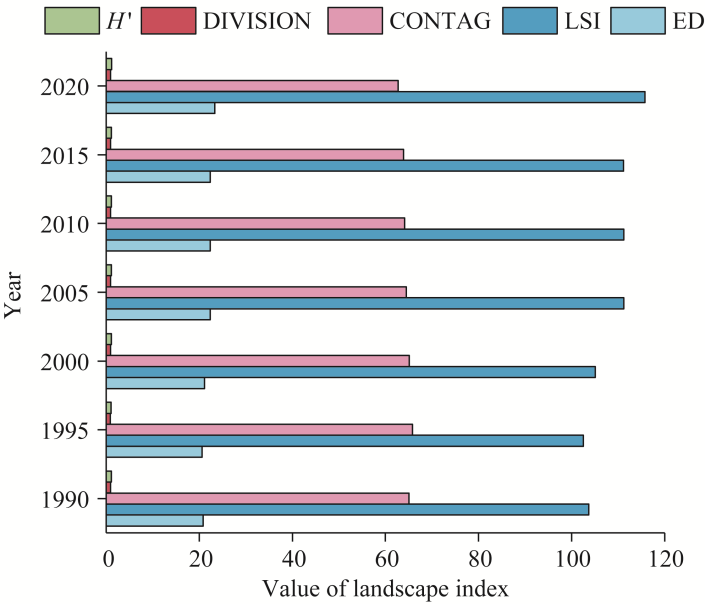
Fig. 6Landscape indices in the Mu Us Sandy Land from 1990 to 2020. H', Shannon's diversity index; DIVISION, landscape division index; CONTAG, contagion index; LSI, landscape shape index; ED, edge density.
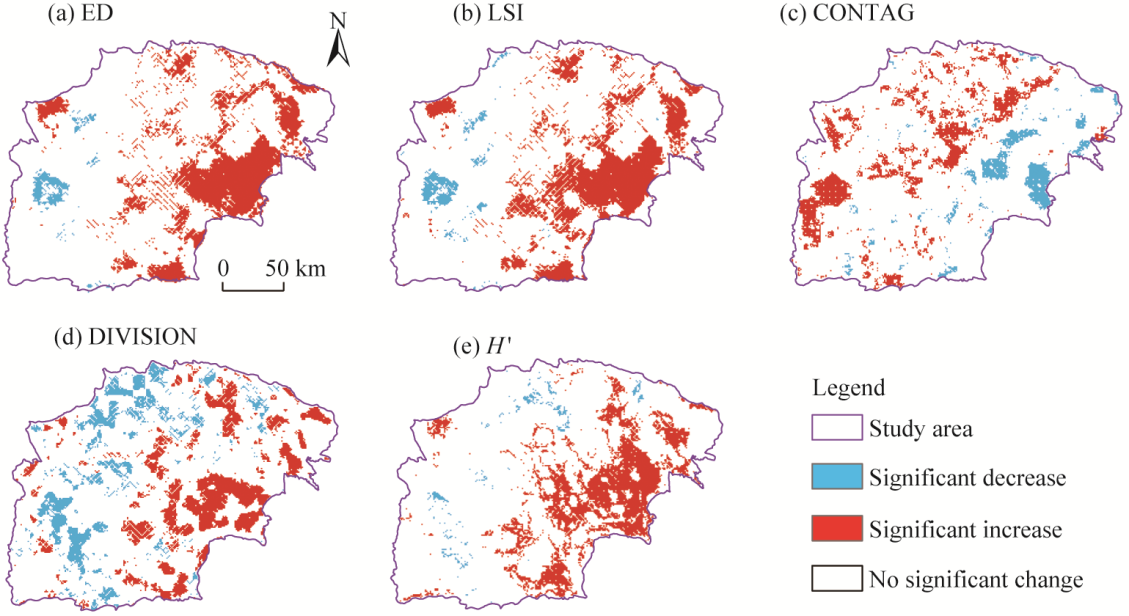
Fig. 7Spatial variation of structural landscape connectivity in the Mu Us Sandy Land from 1990 to 2020. (a), ED; (b), LSI; (c), CONTAG; (d), DIVISION; (e), H'.
Region
ED
LSI
CONTAG
DIVISION
H'
Trend direction
East
25.736→29.681
4.083→4.562
56.149→55.773
0.669→0.698
0.892→0.973
Fragmentation
West
17.261→18.492
3.124→3.284
55.451→57.695
0.565→0.554
0.727→0.740
Aggregation
Note: ED, edge density; LSI, landscape shape index; CONTAG, contagion index; DIVISION, landscape division index; H', Shannon's diversity index. All inter-regional differences were statistically significant at P<0.050 level.
Table 4 Comparison of structural landscape connectivity indices between eastern and western Mu Us Sandy Land from 1990 to 2020
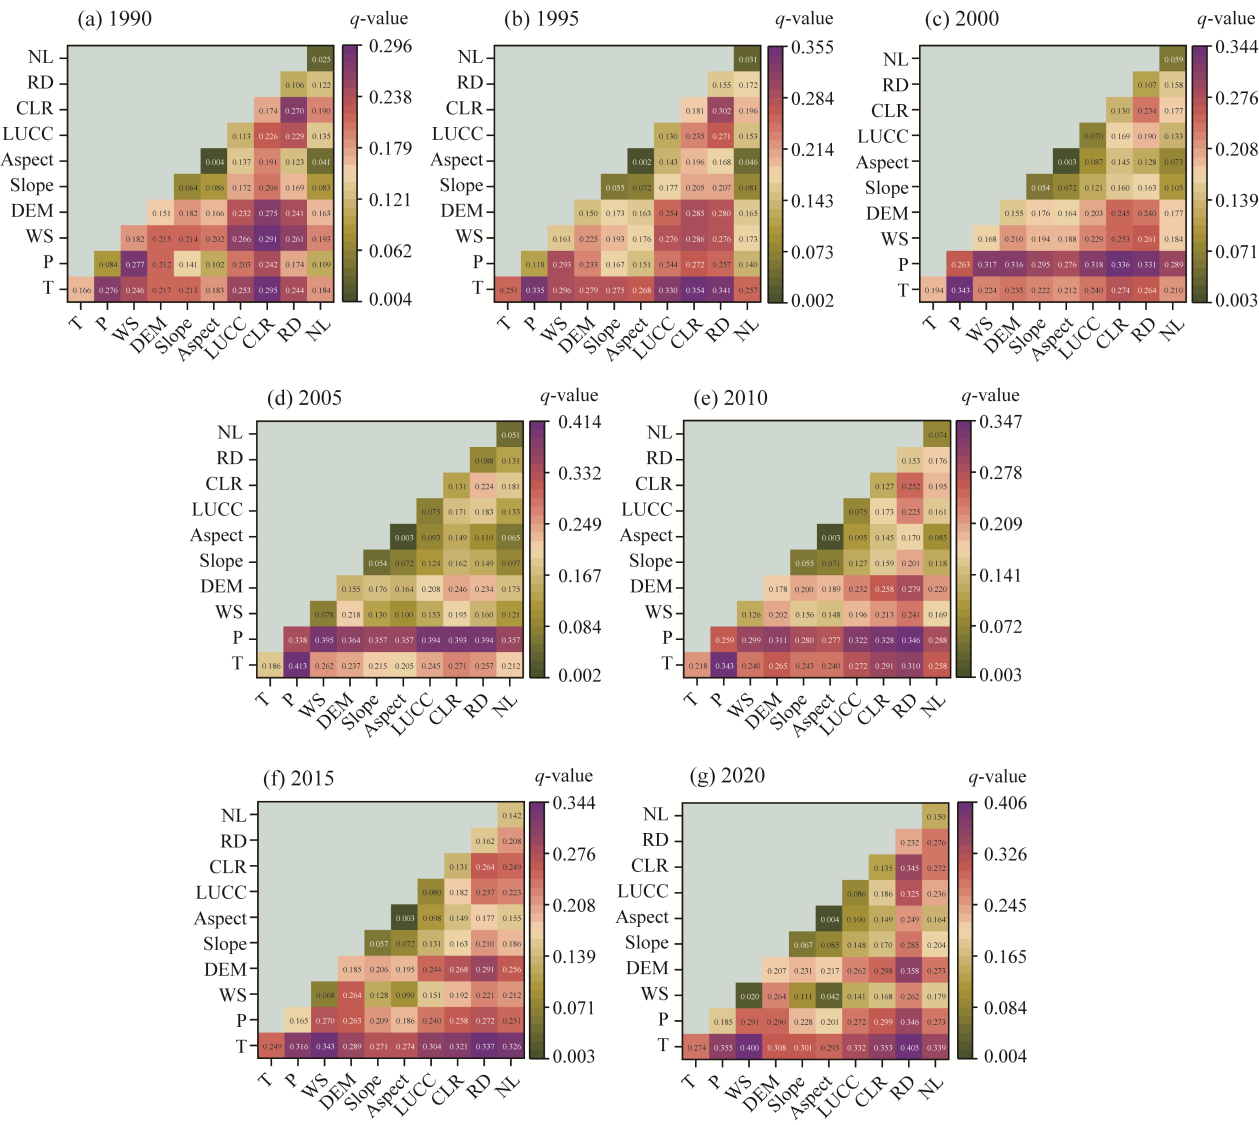
Fig. 9Interaction result of the Geodetector (GD). (a), 1990; (b), 1995; (c), 2000; (d), 2005; (e), 2010; (f), 2015; (g), 2020. NL, nighttime light; RD, residential density; CLR, cropland ratio; LUCC, land use/cover change; DEM, digital elevation model.
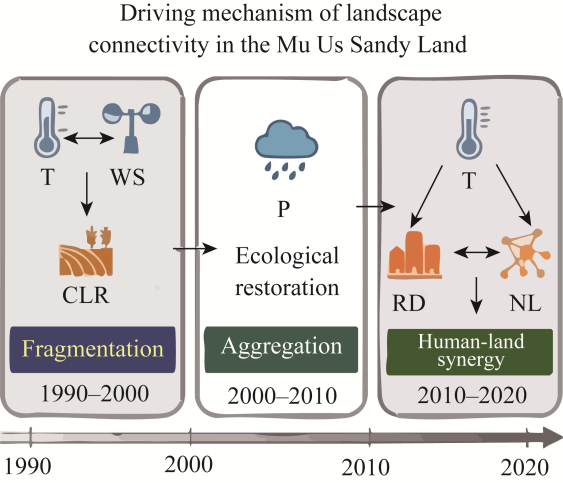
Fig. 10Conceptual diagram of the driving mechanisms of structural landscape connectivity in the Mu Us Sandy Land from 1990 to 2020. Arrows indicate causal relationships and bidirectional arrows indicate synergistic interaction.
[1]
Armando S, Javier M, Carmen C V, et al. 2023. Modelling the effects of climate and land-cover changes on the potential distribution and landscape connectivity of three earth snakes (Genus Conopsis, Günther 1858) in central Mexico. The Science of Nature, 110(6): 52, doi: 10.1007/s00114-023-01880-7.
[2]
Bishop-Taylor R, Tulbure M G, Broich M. 2017. Impact of hydroclimatic variability on regional-scale landscape connectivity across a dynamic dryland region. Ecological Indicators, 94: 142-150.
doi: 10.1016/j.ecolind.2017.07.029
[3]
Chen H J, Ge J Y, He W, et al. 2025. Quantifying urban vitality in Guangzhou through multi-source data: a comprehensive analysis of land use change, streetscape elements, POI distribution, and smartphone-GPS data. Land, 14(6): 1309, doi: 10.3390/land14061309.
[4]
Clauzel C, Jeliazkov A, Mimet A, et al. 2018. Coupling a landscape-based approach and graph theory to maximize multispecific connectivity in bird communities. Landscape and Urban Planning, 179: 1-16.
doi: 10.1016/j.landurbplan.2018.07.002
[5]
Dong F F, Qin F C, Dong X Y, et al. 2024. Spatiotemporal evolution and drivers of ecological quality in the Tengger Desert (2001-2021). Land, 13(11): 1838, doi: 10.3390/land13111838.
[6]
Duan H C, Wang T, Xue X, et al. 2012. Spatial-temporal evolution of aeolian desertification and landscape pattern in Horqin Sandy Land: a case study of Naiman Banner in Inner Mongolia. Acta Geographica Sinica, 67(7): 917-928. (in Chinese)
doi: 10.11821/xb201207005
[7]
Fang F H, Li Y L, Li Y Q, et al. 2025. Changes in landscape patterns and their driving factors of the typical dune alternated with meadow area in the Horqin Sandy Land. Journal of Desert Research, 45(4): 285-294. (in Chinese)
doi: 10.7522/j.issn.1000-694X.2025.00181
[8]
Foley J A, Defries R, Asner G P, et al. 2005. Global consequences of land use. Science, 309(5734): 570-574.
doi: 10.1126/science.1111772
pmid: 16040698
[9]
Guan B C, Gao J J, Chen W, et al. 2021. The effects of climate change on landscape connectivity and genetic clusters in a small subtropical and warm-temperate tree. Frontiers in Plant Science, 12: 671336, doi: 10.3389/fpls.2021.671336.
[10]
Haddad N M, Brudvig L A, Clobert J, et al. 2015. Habitat fragmentation and its lasting impact on Earth's ecosystems. Science Advances, 1(2): e1500052, doi: 10.1126/sciadv.1500052.
[11]
Han J X, Dalaibaatar E. 2023. A study on the influencing factors of China's ecological footprint based on EEMD-GeoDetector. Sustainability, 15(8): 6680, doi: 10.3390/SU15086680.
[12]
Han X Y, Jia G P, Yang G, et al. 2020. Spatiotemporal dynamic evolution and driving factors of desertification in the Mu Us Sandy Land in 30 years. Scientific Reports, 10: 21734, doi: 10.1038/s41598-020-78665-9.
[13]
Haverland M B, Veech J A. 2017. Examining the occurrence of mammal species in natural areas within a rapidly urbanizing region of Texas, USA. Landscape and Urban Planning, 157: 221-230.
doi: 10.1016/j.landurbplan.2016.06.001
[14]
Ji X Y, Yang J Z, Liu J Y, et al. 2023. Analysis of spatial-temporal changes and driving forces of desertification in the Mu Us Sandy Land from 1991 to 2021. Sustainability, 15(13): 10399, doi: 10.3390/su151310399.
[15]
Johst K, Drechsler M, van Teeffelen A J A, et al. 2011. Biodiversity conservation in dynamic landscapes: trade-offs between number, connectivity and turnover of habitat patches. Journal of Applied Ecology, 48(5): 1227-1235.
doi: 10.1111/jpe.2011.48.issue-5
[16]
Korpach A M, Garroway C J, Mills A M, et al. 2022. Urbanization and artificial light at night reduce the functional connectivity of migratory aerial habitat. Ecography, 2022(8): e05581, doi: 10.1111/ecog.05581.
[17]
Kubiak E J. 2025. Hydrological drought trends and seasonality in selected polish catchments between 1993 and 2022 using a threshold based approach. Scientific Reports, 15: 40454, doi: 10.1038/s41598-025-24133-1.
[18]
Lavagnini I, Badocco D, Pastore P, et al. 2011. Theil-Sen nonparametric regression technique on univariate calibration, inverse regression and detection limits. Talanta, 87: 180-188.
doi: 10.1016/j.talanta.2011.09.059
pmid: 22099666
[19]
Li C X, Lei L T, Jia X, et al. 2025a. Accuracy and applicability assessment of vegetation types of the land cover products produced in China. Ecological Indicators, 174: 113506, doi: 10.1016/j.ecolind.2025.113506.
[20]
Li H C, Chen J J, Ling M, et al. 2025b. A framework for dynamic assessment of soil erosion and detection of driving factors in alpine grassland ecosystems using the RUSLE-InVEST (SDR) model and Geodetector: a case study of the source region of the Yellow River. Ecological Informatics, 85: 102928, doi: 10.1016/J.ECOINF.2024.102928.
[21]
Li J M, Liang L E, Chao Y, et al. 2025c. Construction of the ecological security pattern of Mu Us sandy land on the basis of the ''Source-Resistance-Corridor'' theory. Ecological Indicators, 171: 113162, doi: 10.1016/j.ecolind.2025.113162.
[22]
Li P X, Liu C G, Sun W. 2021. Quantifying changes of landscape connectivity based on ecological process simulation in a rapidly urbanized city: Nanjing, China. Environmental Earth Sciences, 80: 644, doi: 10.1007/s12665-021-09938-3.
[23]
Liang P, Yang X P. 2016. Landscape spatial patterns in the Maowusu (Mu Us) Sandy Land, northern China and their impact factors. CATENA, 145: 321-333.
doi: 10.1016/j.catena.2016.06.023
[24]
Liang L E, Chao Y, Wang X H, et al. 2025. Seasonal climate change characteristics of the Mu Us Sandy Land based on long time scale. Environmental Monitoring and Assessment, 197: 771, doi: 10.1007/s10661-025-14204-1.
pmid: 40536528
[25]
Lin M, Hou L Z, Qi Z M, et al. 2022. Impacts of climate change and human activities on vegetation NDVI in China's Mu Us Sandy Land during 2000-2019. Ecological Indicators, 142: 109164, doi: 10.1016/j.ecolind.2022.109164.
[26]
Lin J, Bo W H, Dong X P, et al. 2025. Evolution of vegetation cover and impacts of climate change and human activities in arid regions of Northwest China: a Mu Us Sandy Land case. Environment, Development and Sustainability, 27: 18977-18996.
doi: 10.1007/s10668-024-04704-4
[27]
Liu J, Liu H M, Zhuo Y, et al. 2017. Dynamics and driving forces of landscape patterns in Mu Us Sandy Land, from 1990 to 2014. Pratacultural Science, 34(2): 255-263. (in Chinese)
[28]
Liu J Y, Jia N, Kuang W H, et al. 2018. Spatio-temporal patterns and characteristics of land-use change in China during 2010-2015. Acta Geographica Sinica, 73(5): 789-802.
doi: 10.11821/dlxb201805001
[29]
Liu Q F, Zhang Q, Yan Y Z, et al. 2020. Ecological restoration is the dominant driver of the recent reversal of desertification in the Mu Us Desert (China). Journal of Cleaner Production, 268: 122241, doi: 10.1016/j.jclepro.2020.122241.
[30]
Mantyka-Pringle C S, Visconti P, Di Marco M, et al. 2015. Climate change modifies risk of global biodiversity loss due to land-cover change. Biological Conservation, 187: 103-111.
doi: 10.1016/j.biocon.2015.04.016
[31]
McGuire J L, Lawler J J, McRae B H, et al. 2016. Achieving climate connectivity in a fragmented landscape. Proceedings of the National Academy of Sciences of the United States of America, 113: 7195-7200.
[32]
Mestre F, Risk B B, Mira A, et al. 2017. A metapopulation approach to predict species range shifts under different climate change and landscape connectivity scenarios. Ecological Modelling, 359: 406-414.
doi: 10.1016/j.ecolmodel.2017.06.013
[33]
O'Connell E, O'Donnell G, Koutsoyiannis D, et al. 2023. On the spatial scale dependence of long-term persistence in global annual precipitation data and the Hurst phenomenon. Water Resources Research, 59(4): e2022WR033133, doi: 10.1029/2022WR033133.
[34]
Pelorosso R, Noce S, De Notaris C, et al. 2025. The nexus between connectivity, climate, and land use: a scenario assessment of bio-energy landscape connectivity in central Italy. Journal of Environmental Management, 376: 124521, doi: 10.1016/j.jenvman.2025.124521.
[35]
Peng J, Xu D M, Tang H, et al. 2025. A landscape ecological approach to spatial conservation planning-ecological security pattern. Trends in Ecology & Evolution, 40(10): 1010-1022.
doi: 10.1016/j.tree.2025.07.014
[36]
Raven P H, Wagner D L. 2021. Agricultural intensification and climate change are rapidly decreasing insect biodiversity. Proceedings of the National Academy of Sciences of the United States of America, 118(2): e2002548117, doi: 10.1073/pnas.2002548117.
[37]
Sang Y F, Wang Z G, Liu C M. 2014. Comparison of the MK test and EMD method for trend identification in hydrological time series. Journal of Hydrology, 510: 293-298.
doi: 10.1016/j.jhydrol.2013.12.039
[38]
Tischendorf L, Fahrig L. 2000. On the usage and measurement of landscape connectivity. Oikos, 90(1): 7-19.
doi: 10.1034/j.1600-0706.2000.900102.x
[39]
Tu W N, Crowther T W, Du Y Y, et al. 2025. Wilderness quality, habitat connectivity, and the effectiveness of protected areas diminish as human activities intensify. Conservation Letters, 18(5): e13149, doi: 10.1111/conl.13149.
[40]
Wang C X, Liu Y X, Chen J S, et al. 2025. Turning points of the relationship between human activity and environmental quality in China. Sustainable Cities and Society, 119: 106123, doi: 10.1016/j.scs.2025.106123.
[41]
Wang J F, Xu C D. 2017. Geodetector: Principle and prospective. Acta Geographica Sinica, 72(1): 116-134. (in Chinese)
doi: 10.11821/dlxb201701010
[42]
Wang N, Xie J C, Han J C, et al. 2014. A comprehensive framework on land-water resources development in Mu Us Sandy Land. Land Use Policy, 40: 69-73.
doi: 10.1016/j.landusepol.2013.09.022
[43]
Williams S H, Scriven S A, Burslem D F R P, et al. 2020. Incorporating connectivity into conservation planning for the optimal representation of multiple species and ecosystem services. Conservation Biology, 34(4): 934-942.
doi: 10.1111/cobi.13450
pmid: 31840279
[44]
Xu Z W, Lu H Y. 2021. Aeolian environmental change studies in the Mu Us Sandy Land, north-central China: theory and recent progress. Acta Geographica Sinica, 76(9): 2203-2223. (in Chinese)
doi: 10.11821/dlxb202109012
[45]
Zhang H D, Wei W, Xue S. 2015. Analysis on the variation of temperature and precipitation in Dingxi based on R/S and Mann-Kendall test. Research of Soil and Water Conservation, 22(6): 183-189. (in Chinese)
[46]
Zhang J X, Gong J, Liu D Q. 2018. Dynamics and driving factors of landscape fragmentation based on Geodetector in the Bailongjiang watershed of Gansu Province. Geographical Science, 38(8): 1370-1378. (in Chinese)
[47]
Zhang L X, Ren Z H, Chen B, et al. 2024a. A prolonged artificial nighttime-light dataset of China (1984-2020). Scientific Data, 11: 414, doi: 10.1038/s41597-024-03223-1.
[48]
Zhang Q M, Jia B Q, Li T, et al. 2024b. Research on the sustainability of "greening" process in the Mu Us Sandy Land based on the spatiotemporal stability of ecological land. PLoS ONE, 19(2): e0292469, doi: 10.1371/journal.pone.0292469.
[49]
Zhang W T, Fan Y R, Qiao Q, et al. 2025. Delineating ecological restoration zoning integrating functional and structural models in Horqin Sandy Land, China. Forests, 16(11): 1616, doi: 10.3390/f16111616.
[50]
Zheng X, Zhu J J, Wang G G, et al. 2025. Assessing the ecological effects of the world's largest forestry eco-engineering: Three-North Protective Forest Program within the initially scheduled range from 1978 to 2022. Science China Life Sciences, 68: 314-327.
doi: 10.1007/s11427-024-2705-4
[51]
Zhou S Q, Jing Y D, Zhang Q F, et al. 2013. Vegetation landscape pattern change and characteristics of spatial distribution in south edge of Mu Us Sandy Land. Acta Ecologica Sinica, 33(12): 3774-3782. (in Chinese)
doi: 10.5846/stxb
[52]
Zhu H Y, Li X B. 2003. Discussion on the index method of regional land use change. Acta Geographica Sinica, 58(5): 643-650. (in Chinese)
doi: 10.11821/xb200305001