| Research article |
|


|
|
|
| Habitat zonation shapes ecosystem multifunctionality and functional trade-offs in farmland across an oasis-desert ecotone in Xinjiang, China |
YANG Yan1, SHEN Liuji2, ZHOU Wenjie1, JIANG Chenfeng2, QIN Linfeng1, WU Yangyang2, ZHOU Zhengli2,*( ) ) |
1 School of Life Science and Technology, Tarim University, Alar 843300, China
2 School of Horticulture and Forestry, Tarim University, Alar 843300, China |
|
|
|
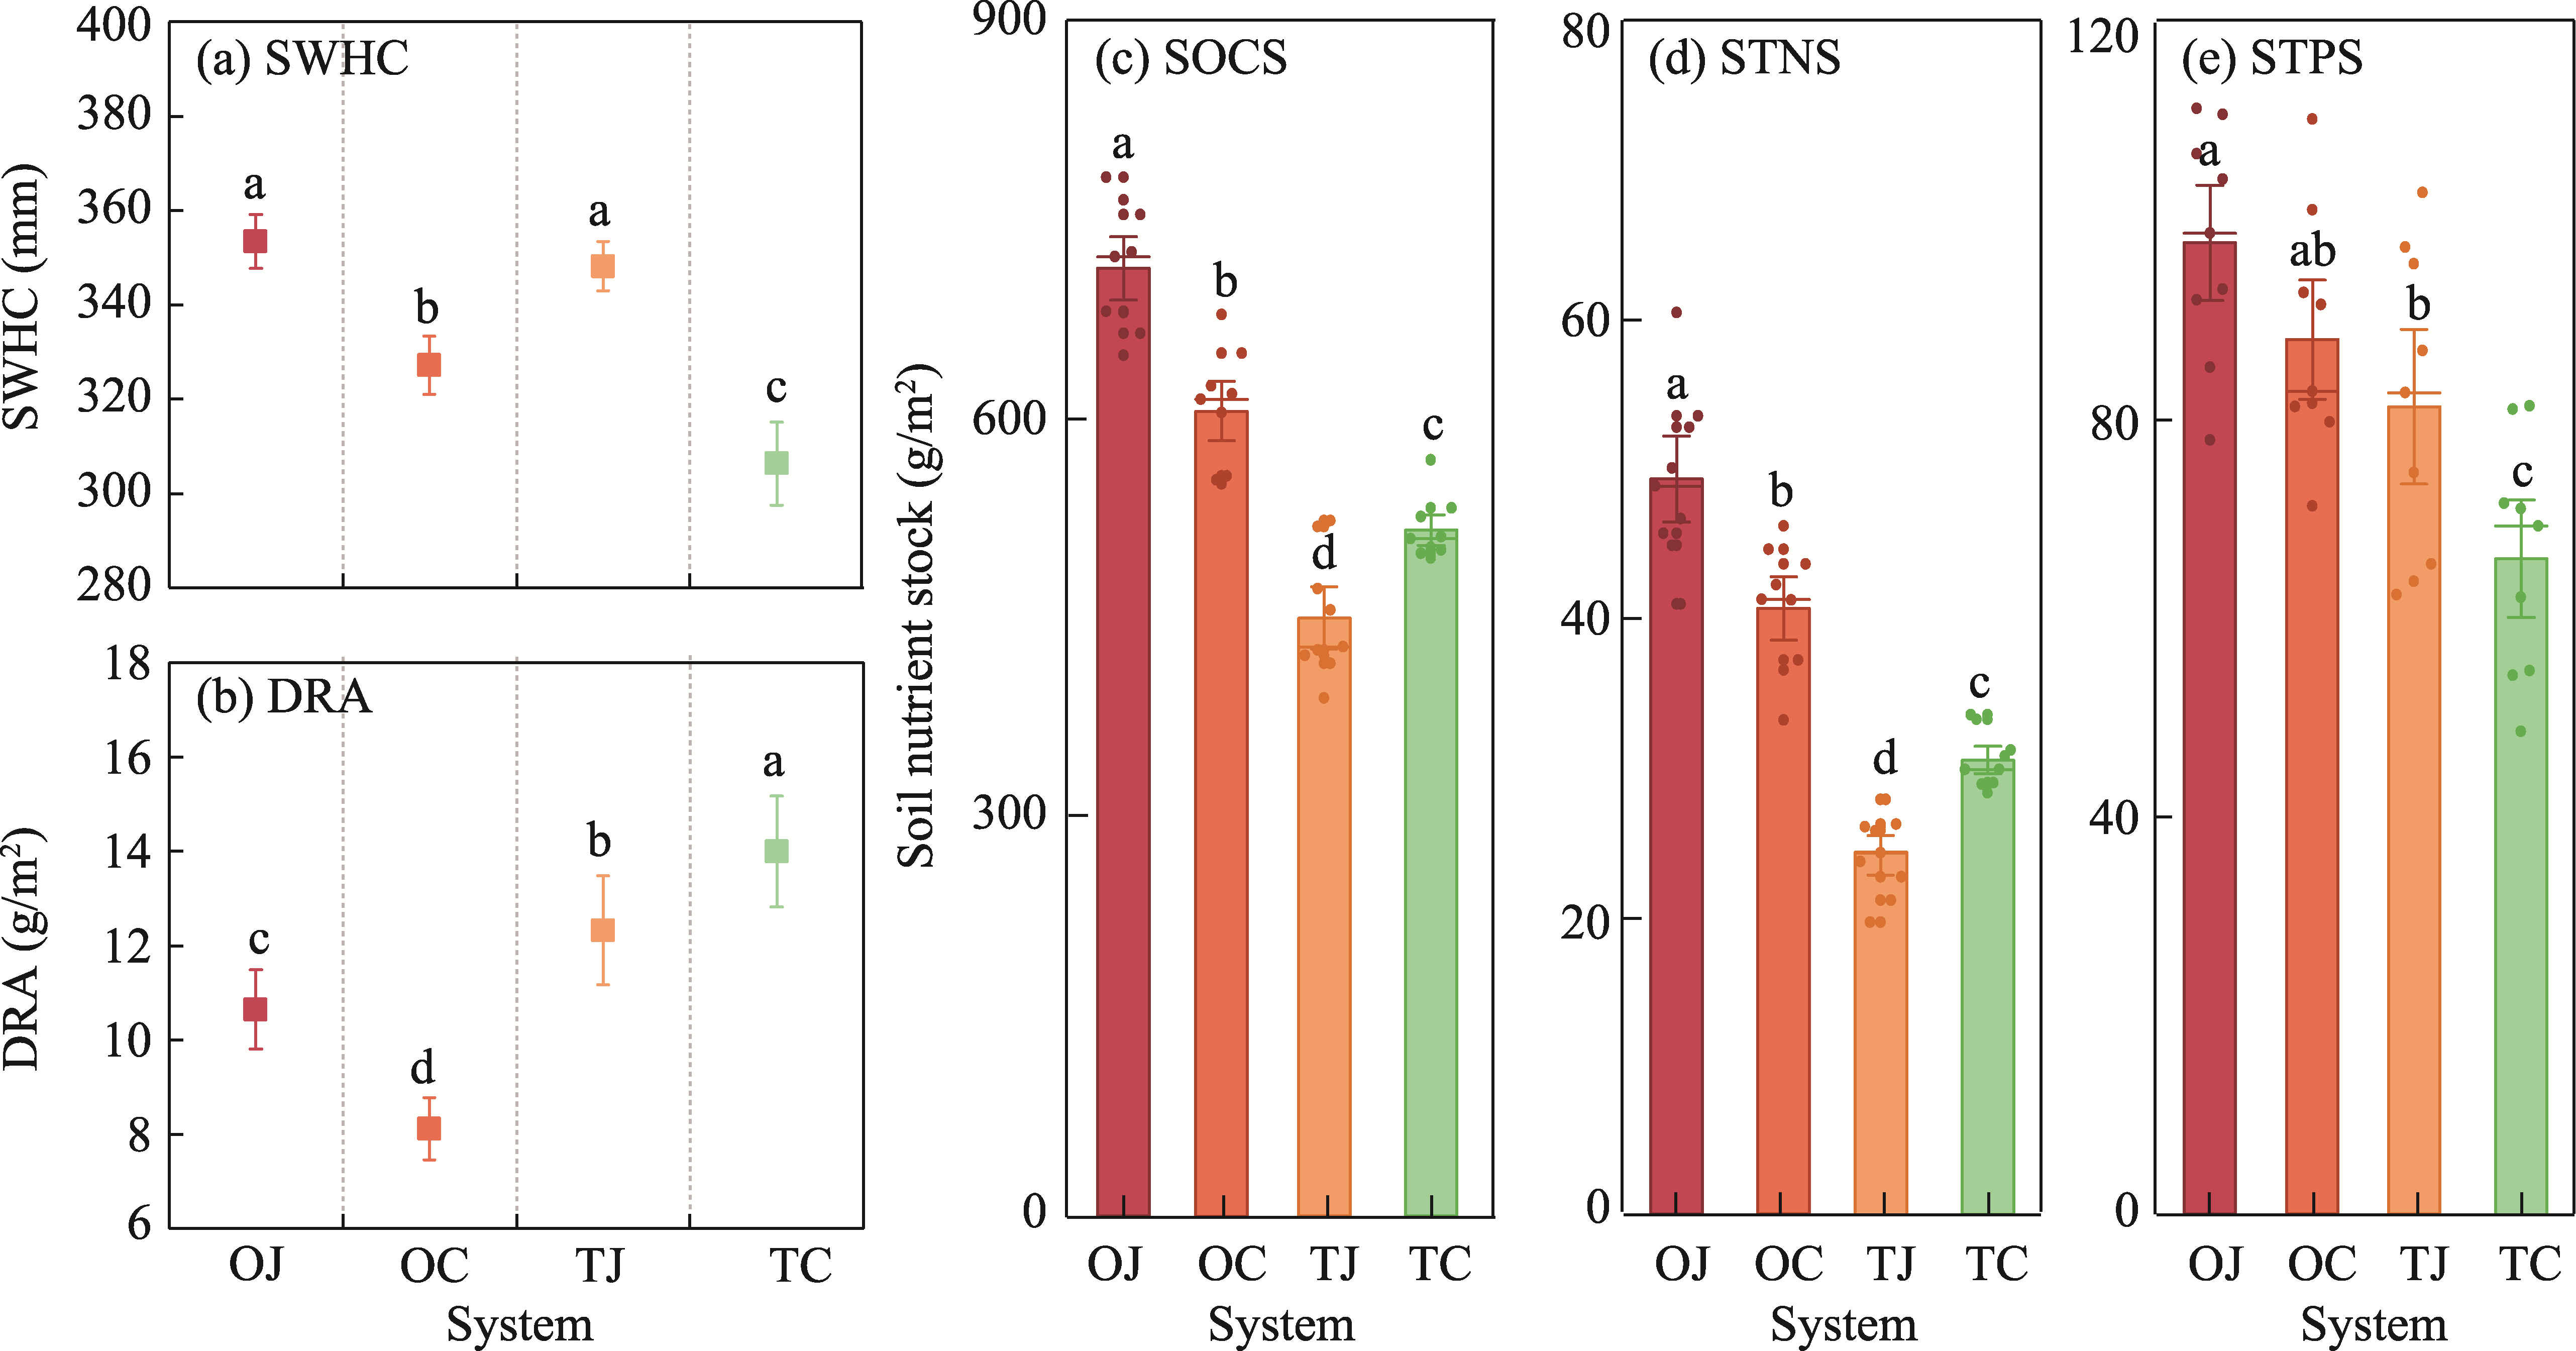
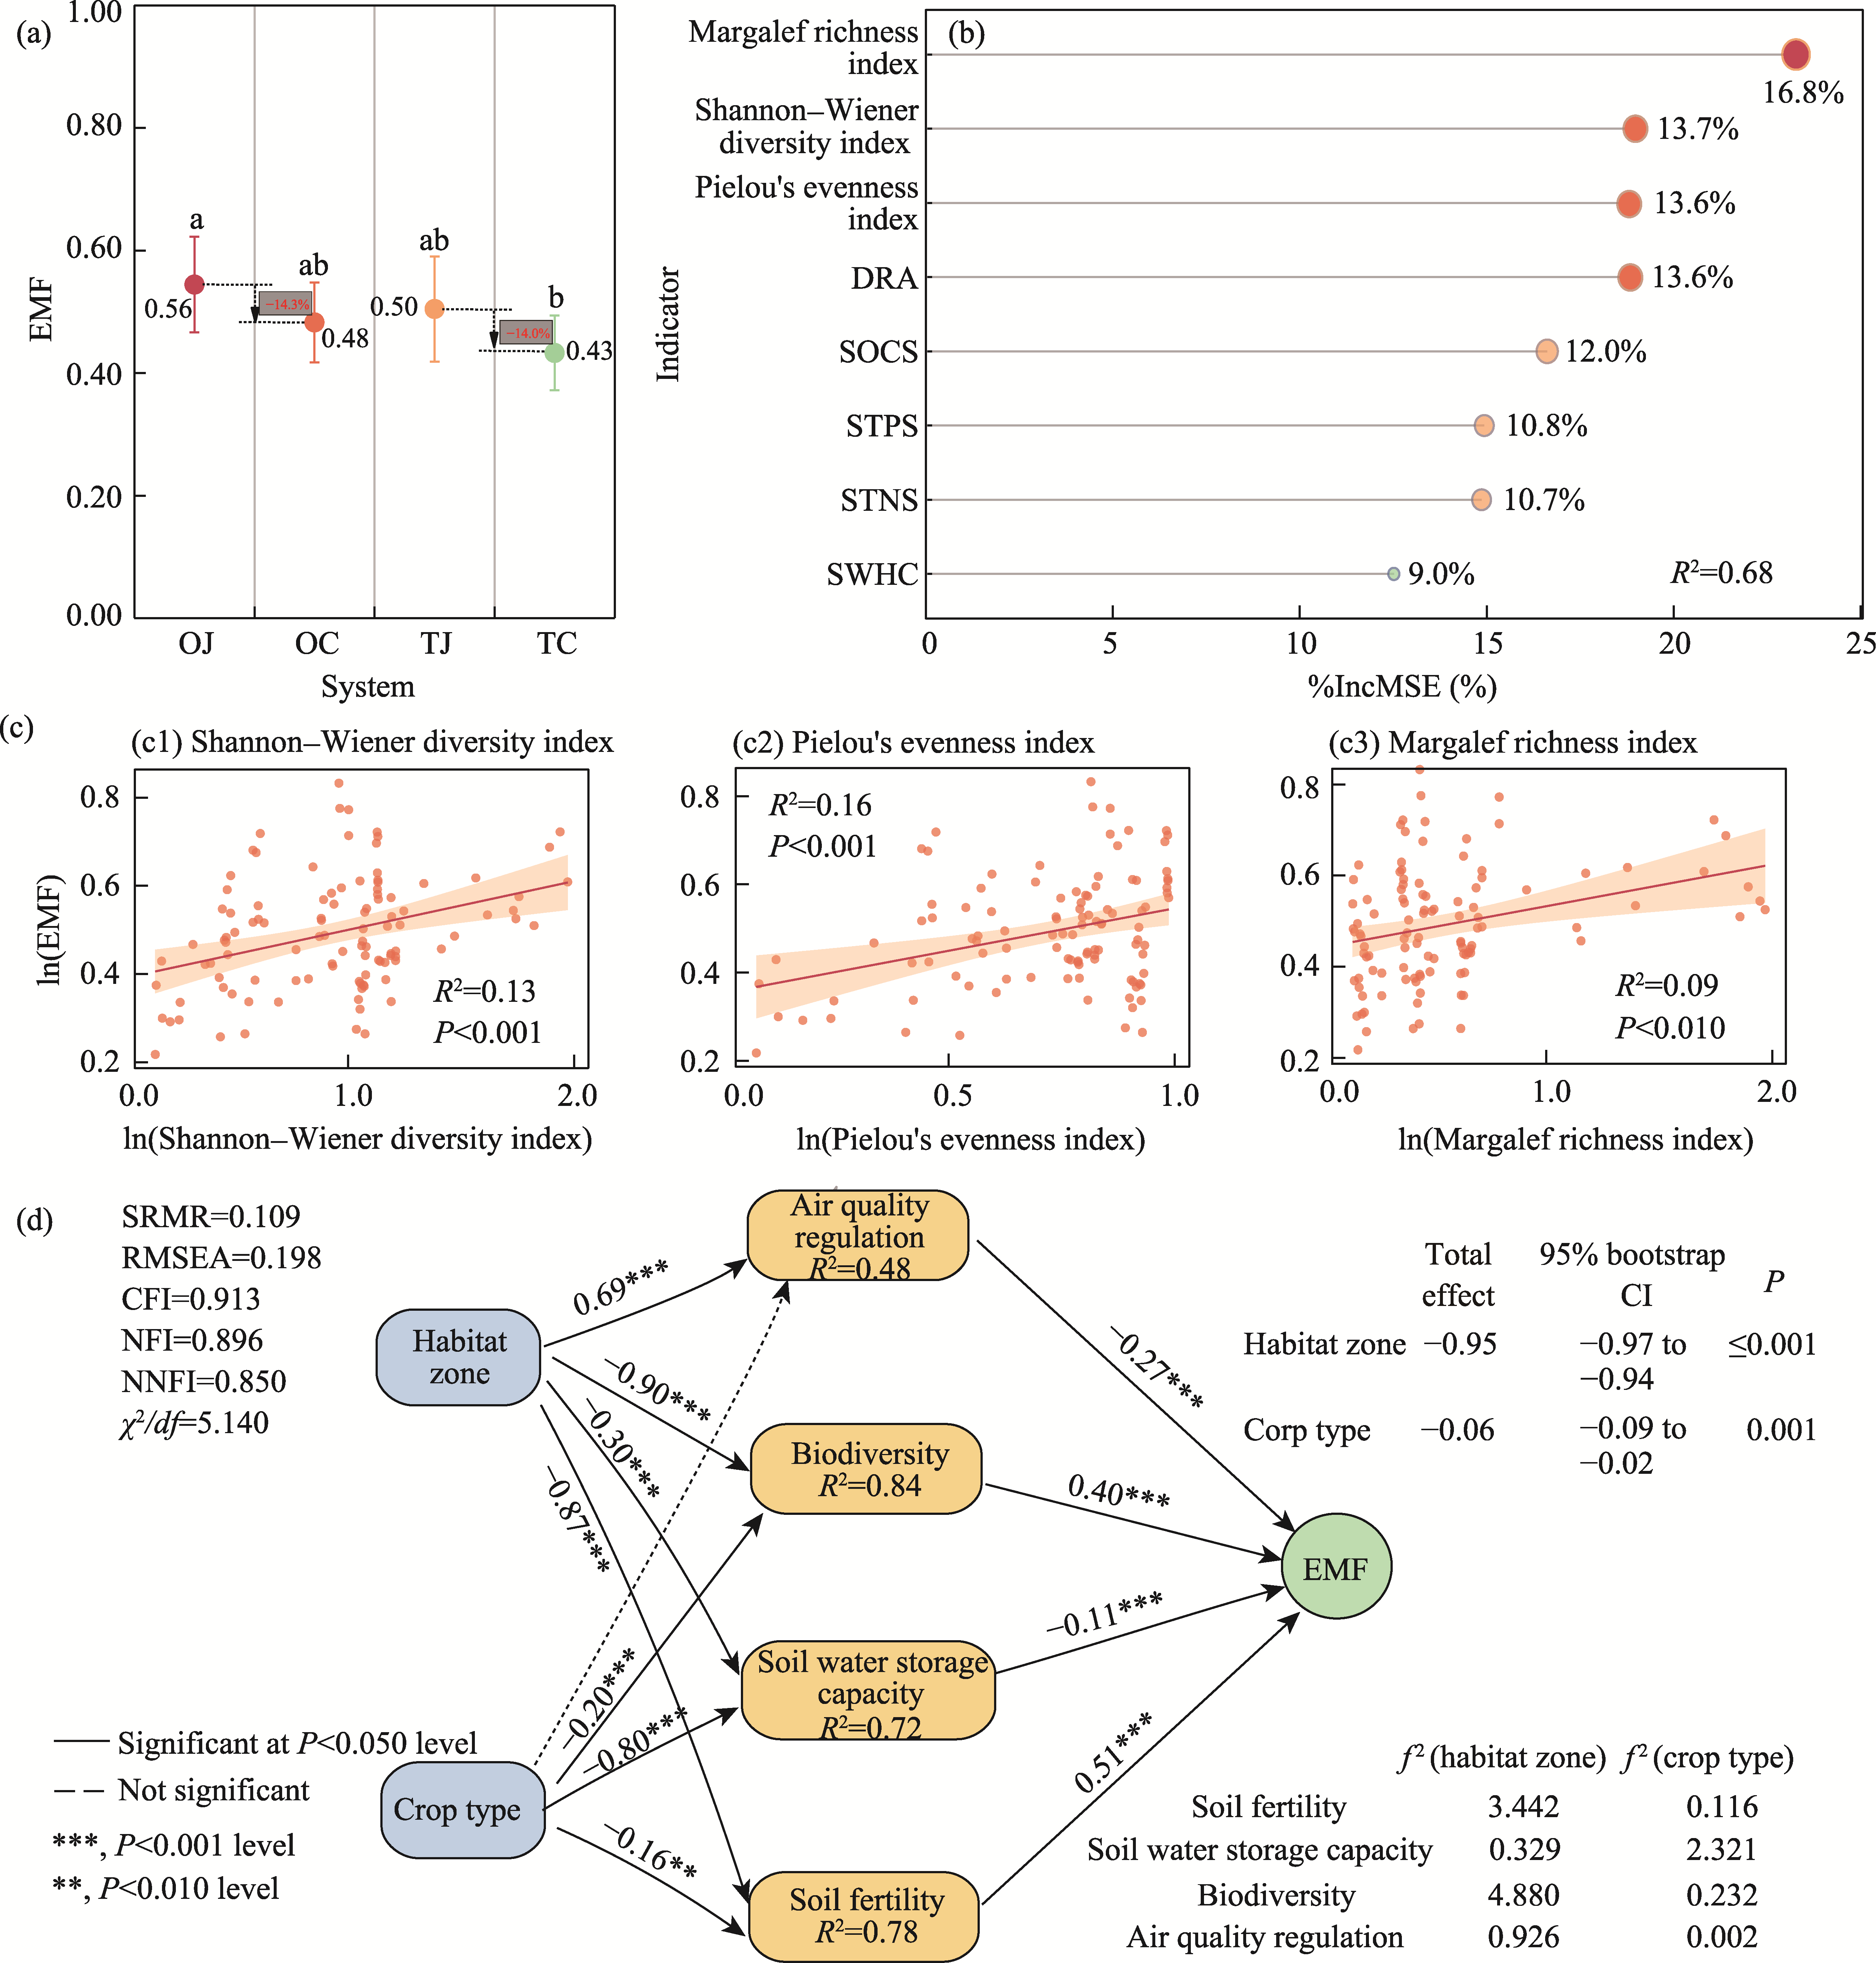
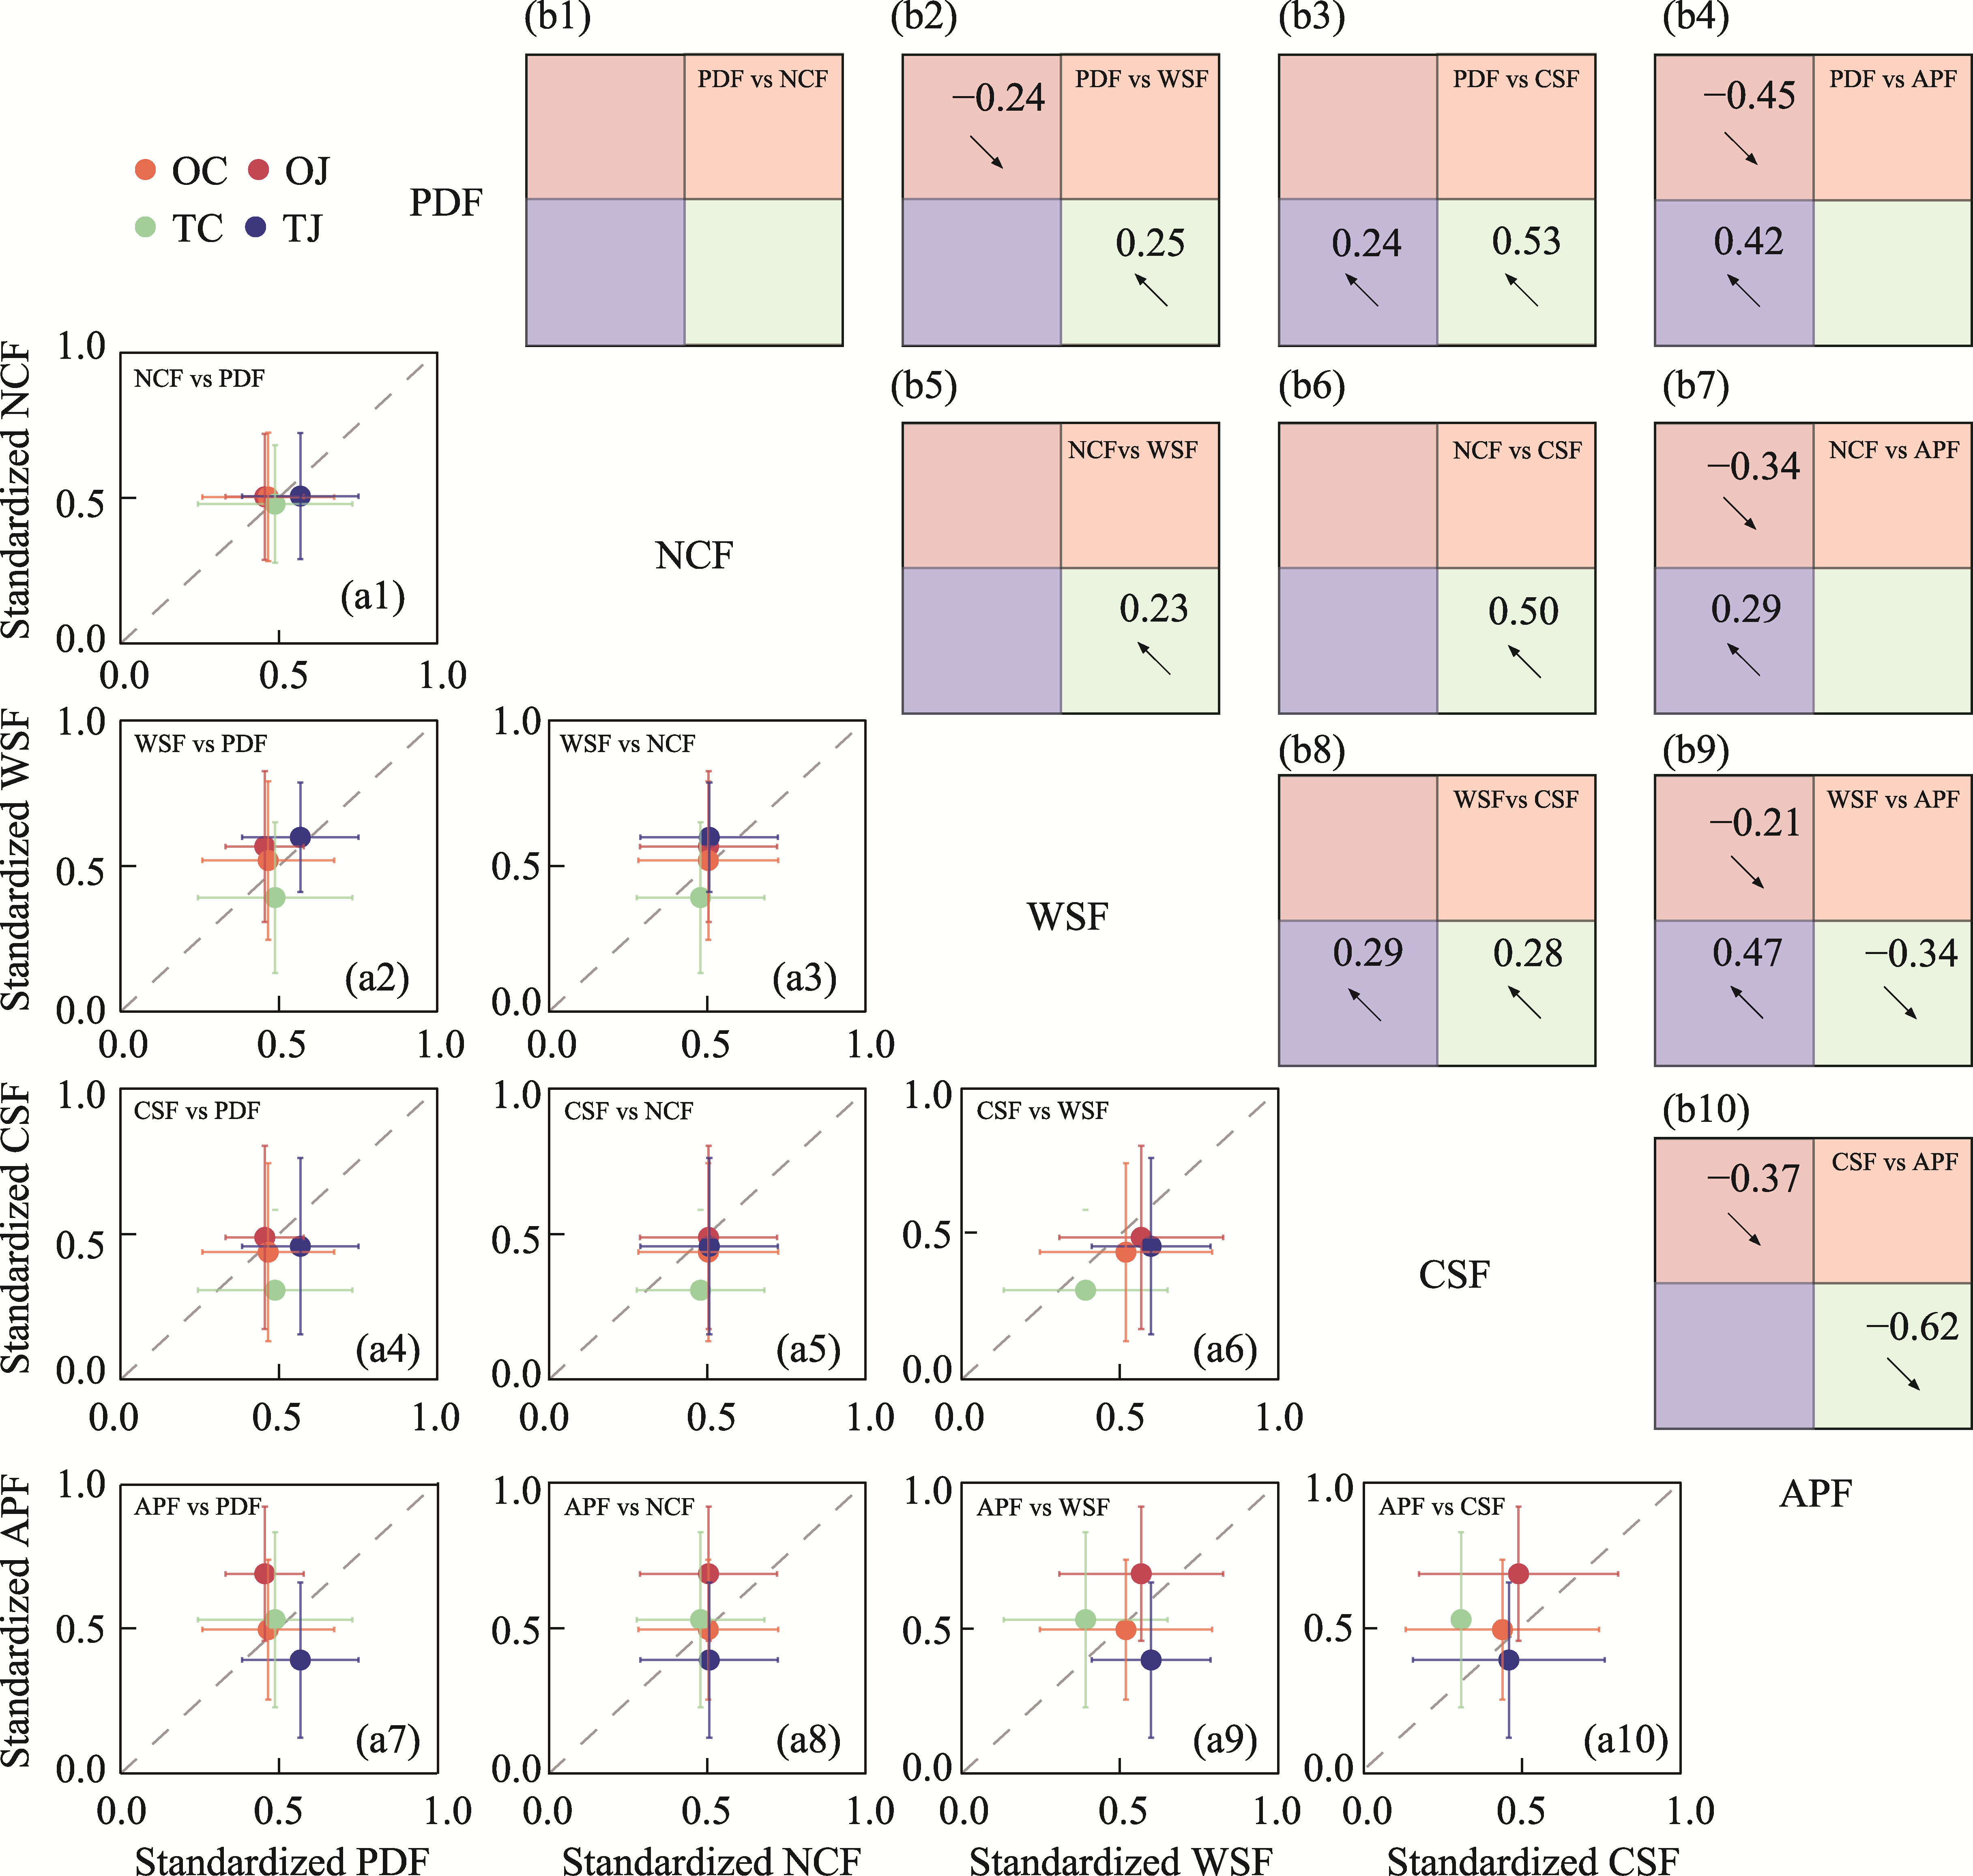
Abstract Farmland ecosystems within the oasis-desert ecotone of arid regions play a crucial role in sustaining regional ecological stability and environmental functioning. However, the spatial distribution patterns of ecosystem multifunctionality (EMF) and the key factors associated with its variation across different crop types and habitat zones remain inadequately understood. This study investigated jujube orchards and cotton fields across two contrasting habitat zones, namely the oasis core and the oasis-desert transition zone, in the Alar region of southern Xinjiang Uygur Autonomous Region, China, during the growing season from June to September 2024. Eight ecosystem functional indicators, including three soil nutrient pools, soil water-holding capacity, three herbaceous α-diversity indices, and dust retention per unit leaf area, were quantified and standardized to calculate EMF and subsequently integrated into five ecosystem functional dimensions representing carbon sequestration, nutrient cycling, water storage, plant diversity, and air purification. An integrated analytical framework combining random forest analysis, two-stage partial least squares structural equation modeling (PLS-SEM), and trade-off-synergy analysis was employed to identify dominant predictors associated with EMF, clarify potential pathways linking habitat zone and crop type to EMF, and characterize functional interactions across different habitat zone-crop type systems. Along the gradient from the oasis core to the oasis-desert transition zone, soil organic carbon, total nitrogen, and total phosphorus stocks in both jujube and cotton systems declined by 14.8%-37.2%, 25.0%-51.0%, and 16.9%-24.9%, respectively. Soil water-holding capacity also decreased by 5.3-20.8 mm, whereas dust retention per unit leaf area increased markedly by 16.0%-73.0%. Accordingly, EMF was approximately 10.0% lower in the oasis-desert transition zone than in the oasis core, but remained consistently higher in jujube orchards than in cotton fields within the same habitat zone. Random forest analysis and two-stage PLS-SEM consistently showed that habitat zone regulates EMF primarily through a soil fertility-biodiversity pathway, whereas crop type exerted a weaker effect mainly through soil water dynamics. Trade-off-synergy analysis revealed predominantly synergistic functional relationships in the oasis core, with all pairwise relationships among the five ecosystem functional dimensions in oasis-core cotton fields exhibiting synergy. In contrast, air purification in oasis-core jujube orchards showed clear trade-offs with the other four functional dimensions. Trade-offs became more frequent and pronounced in the oasis-desert transition zone, particularly in transition-zone cotton fields, where reductions in carbon sequestration and water storage are accompanied by enhancements in plant diversity, nutrient cycling, or air purification. Overall, this study elucidates the mechanistic basis of EMF decline and the intensification of functional trade-offs under conditions of farmland marginalization in oasis-desert ecotones. These results provide important scientific support for zone-specific management strategies that emphasize multifunctional co-benefit optimization in the oasis core, while prioritizing the conservation of carbon sequestration and water storage functions in environmentally vulnerable oasis-desert transition zones.
|
|
Received: 15 December 2025
Published: 30 September 2026
|
|
Corresponding Authors:
*ZHOU Zhengli (E-mail: zzlzkytd@163.com)
|
| About author: First author contact:
The first and second authors contributed equally to this work.
Author contributions
Conceptualization: YANG Yan, SHEN Liuji; Methodology: YANG Yan, SHEN Liuji; Formal analysis: YANG Yan, SHEN Liuji, ZHOU Wenjie, JIANG Chenfeng, QIN Linfeng, WU Yangyang; Writing - original draft preparation: YANG Yan; Writing - review and editing: ZHOU Zhengli, YANG Yan; Funding acquisition: ZHOU Zhengli; Resources: ZHOU Zhengli; Supervision: ZHOU Zhengli. All authors approved the manuscript.
|
|
|
| [1] |
Alignier A, Carof M, Aviron S. 2024. Assessing cropping system multifunctionality: an analysis of trade-offs and synergies in French cereal fields. Agricultural Systems, 221: 104100, doi: 10.1016/j.agsy.2024.104100.
|
|
|
| [2] |
An Z S, Zhang K C, Tan L H, et al. 2023. Quantifying research on the protection effect of a desert-oasis ecotone in Dunhuang, Northwest China. Journal of Wind Engineering and Industrial Aerodynamics, 236: 105400, doi: 10.1016/j.jweia.2023.105400.
|
|
|
| [3] |
Bao S D. 2000. Soil Agricultural Chemical Analysis (3rd ed.). Beijing: China Agriculture Press, 265-267. (in Chinese)
|
|
|
| [4] |
Barral M P, Rey Benayas J M, Meli P, et al. 2015. Quantifying the impacts of ecological restoration on biodiversity and ecosystem services in agroecosystems: a global meta-analysis. Agriculture, Ecosystems & Environment, 202: 223-231.
|
|
|
| [5] |
Berdugo M, Delgado-Baquerizo M, Soliveres S, et al. 2020. Global ecosystem thresholds driven by aridity. Science, 367(6479): 787-790.
|
|
|
| [6] |
Blanco‐Canqui H, Ruis S J. 2020. Cover crop impacts on soil physical properties: a review. Soil Science Society of America Journal, 84(5): 1527-1576.
|
|
|
| [7] |
Bradford J B, D'Amato A W. 2012. Recognizing trade‐offs in multi‐objective land management. Frontiers in Ecology and the Environment, 10(4): 210-216.
|
|
|
| [8] |
Brandle J R, Hodges L, Zhou X H. 2004. Windbreaks in North American agricultural systems. Agroforestry Systems, 61(1): 65-78.
|
|
|
| [9] |
Byrnes J E K, Gamfeldt L, Isbell F, et al. 2014a. Investigating the relationship between biodiversity and ecosystem multifunctionality: challenges and solutions. Methods in Ecology and Evolution, 5(2): 111-124.
|
|
|
| [10] |
Byrnes J E K, Lefcheck J S, Gamfeldt L, et al. 2014b. Multifunctionality does not imply that all functions are positively correlated. Proceedings of the National Academy of Sciences of the United States of America, 111(51): E5490, doi: 10.1073/pnas.1419515112.
|
|
|
| [11] |
Caron P, Reig E, Roep D, et al. 2008. Multifunctionality: refocusing a spreading, loose and fashionable concept for looking at sustainability? International Journal of Agricultural Resources, Governance and Ecology, 7(4-5): 301-318.
|
|
|
| [12] |
Case B S, Pannell J L, Stanley M C, et al. 2020. The roles of non‐production vegetation in agroecosystems: a research framework for filling process knowledge gaps in a social-ecological context. People and Nature, 2(2): 292-304.
|
|
|
| [13] |
Chang X M, Sun L B, Yu X X, et al. 2021. Windbreak efficiency in controlling wind erosion and particulate matter concentrations from farmlands. Agriculture, Ecosystems & Environment, 308: 107269, doi: 10.1016/j.agee.2020.107269.
|
|
|
| [14] |
Chen B, Lu Y F, Zhan Y F, et al. 2023. Spatial distribution characteristics of soil moisture and its influence on vegetation in desert-oasis ecotone. Journal of Northwest Forestry University, 38(2): 25-32. (in Chinese)
|
|
|
| [15] |
Chen L X, Liu C M, Zhang L, et al. 2017. Variation in tree species ability to capture and retain airborne fine particulate matter (PM2.5). Scientific Reports, 7(1): 3206, doi: 10.1038/s41598-017-03360-1.
|
|
|
| [16] |
Chen Y N, Fang G H, Li Z, et al. 2024. The crisis in oases: research on ecological security and sustainable development in arid regions. Annual Review of Environment and Resources, 49(1): 1-20.
|
|
|
| [17] |
Couthouis E, Aviron S, Pétillon J, et al. 2023. Ecological performance underlying ecosystem multifunctionality is promoted by organic farming and hedgerows at the local scale but not at the landscape scale. Journal of Applied Ecology, 60(1): 17-28.
|
|
|
| [18] |
Dong Z H, Ma R, Wang A L, et al. 2024. Dust retention effects of typical shrub plants in desert oasis transition zone in Minqin County of Gansu Province. Bulletin of Soil and Water Conservation, 44(3): 36-45. (in Chinese)
|
|
|
| [19] |
Evans J D. 1996. Straightforward Statistics for the Behavioral Sciences. Pacific Grove: Brooks/Cole Publishing Company, 256-260.
|
|
|
| [20] |
Finney D M, Kaye J P. 2017. Functional diversity in cover crop polycultures increases multifunctionality of an agricultural system. Journal of Applied Ecology, 54(2): 509-517.
|
|
|
| [21] |
Gamfeldt L, Roger F. 2017. Revisiting the biodiversity-ecosystem multifunctionality relationship. Nature Ecology & Evolution, 1(7): 0168, doi: 10.1038/s41559-017-0168.
|
|
|
| [22] |
Gong L, He G X, Liu W G. 2016. Long-term cropping effects on agricultural sustainability in Alar Oasis of Xinjiang, China. Sustainability, 8(1): 61, doi: 10.3390/su8010061.
|
|
|
| [23] |
Grossman R B, Reinsch T G. 2002. Bulk density and linear extensibility. In: Dane JH, Topp GC. Methods of SoilAnalysis.Part 4: Physical Methods. Madison: Soil Science Society of America, 201-228.
|
|
|
| [24] |
Guo L B, Gifford R M. 2002. Soil carbon stocks and land use change: a meta analysis. Global Change Biology, 8(4): 345-360.
|
|
|
| [25] |
Hall J M, Van Holt T, Daniels A E, et al. 2012. Trade-offs between tree cover, carbon storage and floristic biodiversity in reforesting landscapes. Landscape Ecology, 27(8): 1135-1147.
|
|
|
| [26] |
Holland J E, Fornara D, Gordon A, et al. 2024. Effects of nutrient fertilization and soil tillage on soil CO2 emissions in a long-term grassland experiment. Soil and Tillage Research, 244: 106232, doi: 10.1016/j.still.2024.106232.
|
|
|
| [27] |
Hu W G, Ran J Z, Dong L W, et al. 2021. Aridity-driven shift in biodiversity-soil multifunctionality relationships. Nature Communications, 12(1): 5350, doi: 10.1038/s41467-021-25641-0.
|
|
|
| [28] |
Jiang L L, Jiapaer G, Bao A M, et al. 2019. Monitoring the long-term desertification process and assessing the relative roles of its drivers in Central Asia. Ecological Indicators, 104: 195-208.
|
|
|
| [29] |
Kang N N, Alita L, Yu X H, et al. 2023. Valuing the plant species diversity of permanent grasslands: from the perspective of herders. Journal of Environmental Management, 345: 118797, doi: 10.1016/j.jenvman.2023.118797.
|
|
|
| [30] |
Lefcheck J S, Byrnes J E K, Isbell F, et al. 2015. Biodiversity enhances ecosystem multifunctionality across trophic levels and habitats. Nature Communications, 6(1): 6936, doi: 10.1038/ncomms7936.
|
|
|
| [31] |
Li D F, Shao M A. 2013. Simulating the vertical transition of soil textural layers in north-western China with a Markov chain model. Soil Research, 51(3): 182-192.
|
|
|
| [32] |
Li H M, Zhu X, Kong W H, et al. 2023. Physiological response of urban greening shrubs to atmospheric particulate matter pollution: an integral view of ecosystem service and plant function. Environmental and Experimental Botany, 213: 105439, doi: 10.1016/j.envexpbot.2023.105439.
|
|
|
| [33] |
Li X P, Li Y P, Zhang Z, et al. 2015. Influences of environmental factors on leaf morphology of Chinese jujubes. PLoS ONE, 10(5): e0127825, doi: 10.1371/journal.pone.0127825.
|
|
|
| [34] |
Li X T, Liu J X, Yang G, et al. 2025. Biodiversity and ecosystem multifunctionality in arid deserts: water effects and the contributions of biotic and abiotic factors. Ecological Indicators, 178: 113988, doi: 10.1016/j.ecolind.2025.113988.
|
|
|
| [35] |
Li Y K, Chao J P. 2015. The dynamical evolution theory of the isolated oasis system. Science China Earth Sciences, 58(3): 436-447.
|
|
|
| [36] |
Liu H Y, Liang Y Q, Liu J J, et al. 2025. Long-term no-tillage enhanced soil multifunctionality and reduced microbial metabolic entropy. Applied Soil Ecology, 206: 105876, doi: 10.1016/j.apsoil.2025.105876.
|
|
|
| [37] |
Lopez M V, Arrue J L, Sánchez-Girón V. 1996. A comparison between seasonal changes in soil water storage and penetration resistance under conventional and conservation tillage systems in Aragon. Soil and Tillage Research, 37(4): 251-271.
|
|
|
| [38] |
Lü Y H, Ma Z M, Zhao Z J, et al. 2014. Effects of land use change on soil carbon storage and water consumption in an oasis-desert ecotone. Environmental Management, 53(6): 1066-1076.
|
|
|
| [39] |
Maestre F T, Quero J L, Gotelli N J, et al. 2012. Plant species richness and ecosystem multifunctionality in global drylands. Science, 335(6065): 214-218.
|
|
|
| [40] |
Manning P, van der Plas F, Soliveres S, et al. 2018. Redefining ecosystem multifunctionality. Nature Ecology & Evolution, 2(3): 427-436.
|
|
|
| [41] |
Meravi N, Singh P K, Prajapati S K. 2021. Seasonal variation of dust deposition on plant leaves and its impact on various photochemical yields of plants. Environmental Challenges, 4: 100166, doi: 10.1016/j.envc.2021.100166.
|
|
|
| [42] |
Mu G J, He J X, Lei J Q, et al. 2013. A discussion on the transitional zone from oasis to sandy desert: a case study at Cele Oasis. Arid Land Geography, 36(2): 195-202. (in Chinese)
|
|
|
| [43] |
Osman N, Abdullah M N, Abdullah C H. 2011. Pull-out and tensile strength properties of two selected tropical trees. Sains Malaysiana, 40(6): 577-585.
|
|
|
| [44] |
Ould-Dada Z, Baghini N M. 2001. Resuspension of small particles from tree surfaces. Atmospheric Environment, 35(22): 3799-3809.
|
|
|
| [45] |
Palojärvi A, Kellock M, Parikka P, et al. 2020. Tillage system and crop sequence affect soil disease suppressiveness and carbon status in boreal climate. Frontiers in Microbiology, 11: 534786, doi: 10.3389/fmicb.2020.534786.
|
|
|
| [46] |
Pan Y, Xu Z R, Wu J X. 2013. Spatial differences of the supply of multiple ecosystem services and the environmental and land use factors affecting them. Ecosystem Services, 5: 4-10.
|
|
|
| [47] |
Pasari J R, Levi T, Zavaleta E S, et al. 2013. Several scales of biodiversity affect ecosystem multifunctionality. Proceedings of the National Academy of Sciences of the United States of America, 110(25): 10219-10222.
|
|
|
| [48] |
Power A G. 2010. Ecosystem services and agriculture: tradeoffs and synergies. Philosophical Transactions of the Royal Society B: Biological Sciences, 365(1554): 2959-2971.
|
|
|
| [49] |
Qiao L, Schaefer D A, Zou X M. 2014. Variations in net litter nutrient input associated with tree species influence on soil nutrient contents in a subtropical evergreen broad-leaved forest. Chinese Science Bulletin, 59(1): 46-53.
|
|
|
| [50] |
Raudsepp-Hearne C, Peterson G D, Bennett E M. 2010. Ecosystem service bundles for analyzing tradeoffs in diverse landscapes. Proceedings of the National Academy of Sciences of the United States of America, 107(11): 5242-5247.
|
|
|
| [51] |
Ren X, Mu G J, Xu L H, et al. 2015. Characteristics of artificial oasis expansion in south Tarim Basin from 2000 to 2013. Arid Land Geography, 38(5): 1022-1030. (in Chinese)
|
|
|
| [52] |
Riaz M U, Raza M A, Saeed A, et al. 2021. Variations in morphological characters and antioxidant potential of different plant parts of four Ziziphus Mill. species from the Cholistan. Plants, 10(12): 2734, doi: 10.3390/plants10122734.
|
|
|
| [53] |
Soheili F, Woodward S, Abdul-Hamid H, et al. 2023. The effect of dust deposition on the morphology and physiology of tree foliage. Water, Air, & Soil Pollution, 234(6): 339, doi: 10.1007/s11270-023-06349-x.
|
|
|
| [54] |
Song W, Cheng C, Wang J W, et al. 2025. Soil microbes regulate the relationships between plant diversity and ecosystem functions. Biodiversity Science, 33(4): 24579, doi: 10.17520/biods.2024579. (in Chinese)
|
|
|
| [55] |
Song X J, Liu X T, Liang G P, et al. 2022. Positive priming effect explained by microbial nitrogen mining and stoichiometric decomposition at different stages. Soil Biology and Biochemistry, 175: 108852, doi: 10.1016/j.soilbio.2022.108852.
|
|
|
| [56] |
Steinparzer M, Schaubmayr J, Godbold D L, et al. 2023. Particulate matter accumulation by tree foliage is driven by leaf habit types, urbanization- and pollution levels. Environmental Pollution, 335: 122289, doi: 10.1016/j.envpol.2023.122289.
|
|
|
| [57] |
Su Y Z, Zhao W Z, Su P X, et al. 2007. Ecological effects of desertification control and desertified land reclamation in an oasis-desert ecotone in an arid region: a case study in Hexi Corridor, northwest China. Ecological Engineering, 29(2): 117-124.
|
|
|
| [58] |
Tilman D, Cassman K G, Matson P A, et al. 2002. Agricultural sustainability and intensive production practices. Nature, 418(6898): 671-677.
|
|
|
| [59] |
van der Plas F, Manning P, Soliveres S, et al. 2016. Biotic homogenization can decrease landscape-scale forest multifunctionality. Proceedings of the National Academy of Sciences of the United States of America, 113(13): 3557-3562.
|
|
|
| [60] |
van Ginkel M, Sayer J, Sinclair F, et al. 2013. An integrated agro-ecosystem and livelihood systems approach for the poor and vulnerable in dry areas. Food Security, 5(6): 751-767.
|
|
|
| [61] |
Wagg C, Bender S F, Widmer F, et al. 2014. Soil biodiversity and soil community composition determine ecosystem multifunctionality. Proceedings of the National Academy of Sciences of the United States of America, 111(14): 5266-5270.
|
|
|
| [62] |
Wang D, Liu Y, Wu G L, et al. 2015. Effect of rest-grazing management on soil water and carbon storage in an arid grassland (China). Journal of Hydrology, 527: 754-760.
|
|
|
| [63] |
Wang X M, Chai Z P, Yang X F. 2017. Analysis on soil nutrients difference under different land use patterns in desert oasis region. Agricultural Research in the Arid Areas, 35(1): 91-96. (in Chinese)
|
|
|
| [64] |
Wang Y, Li R N, Liang M, et al. 2023. Impact of crop types and irrigation on soil moisture downscaling in water-stressed cropland regions. Environmental Impact Assessment Review, 100: 107073, doi: 10.1016/j.eiar.2023.107073.
|
|
|
| [65] |
Wang Y, Li X, Zhao Y, et al. 2025. Quantifying threshold water tables for the stability of the oasis-desert ecotone in arid areas. Journal of Environmental Management, 394: 127328, doi: 10.1016/j.jenvman.2025.127328.
|
|
|
| [66] |
Wang Y T, Yang J J, Ma C H, et al. 2026. Rotational grazing enhances ecosystem multifunctionality in alpine pastoral grasslands. Agriculture, Ecosystems & Environment, 397: 110055, doi: 10.1016/j.agee.2025.110055.
|
|
|
| [67] |
Wittwer R A, Bender S F, Hartman K, et al. 2021. Organic and conservation agriculture promote ecosystem multifunctionality. Science Advances, 7(34): eabg6995, doi: 10.1126/sciadv.abg6995.
|
|
|
| [68] |
Wu J L, Rong Y R, Wu L, et al. 2025. Stage-specific responses and shifting regulatory mechanisms of ecosystem multifunctionality along a grassland degradation gradient. Geoderma, 464: 117629, doi: 10.1016/j.geoderma.2025.117629.
|
|
|
| [69] |
Xia H, Yuan S F, Prishchepov A V. 2023. Spatial-temporal heterogeneity of ecosystem service interactions and their social-ecological drivers: implications for spatial planning and management. Resources, Conservation and Recycling, 189: 106767, doi: 10.1016/j.resconrec.2022.106767.
|
|
|
| [70] |
Xu L X, He Y J, Zhang L, et al. 2024. Spatial variation in ecosystem service relationships in alpine ecosystems: a case study of the Daxing'anling forest area, Inner Mongolia. Ecological Indicators, 166: 112351, doi: 10.1016/j.ecolind.2024.112351.
|
|
|
| [71] |
Yu H J, Zhang F M, Ma H, et al. 2024. Effect of climate change on ecosystem service trade-offs and synergies: a case study in Huai River Basin. Climate Research, 93: 89-101.
|
|
|
| [72] |
Yu X, Lei J Q, Gao X. 2022. An over review of desertification in Xinjiang, Northwest China. Journal of Arid Land, 14(11): 1181-1195.
|
|
|
| [73] |
Zhang Y, Ni J P, Yang J, et al. 2017. Citrus stand ages regulate the fraction alteration of soil organic carbon under a citrus/Stropharua rugodo-annulata intercropping system in the Three Gorges Reservoir area, China. Environmental Science and Pollution Research, 24(22): 18363-18371.
|
|
|
| [74] |
Zhang Z Y, Liu Y F, Wang Y H, et al. 2020. What factors affect the synergy and tradeoff between ecosystem services, and how, from a geospatial perspective? Journal of Cleaner Production, 257: 120454, doi: 10.1016/j.jclepro.2020.120454.
|
|
|
| [75] |
Zhou X B, Tao Y, Wu L, et al. 2020. Divergent responses of plant communities under increased land-use intensity in oasis-desert ecotones of Tarim Basin. Rangeland Ecology & Management, 73(6): 811-819.
|
|
|
| [76] |
Zhu C W, Wang S J, Jiang G Y, et al. 2025. Intermittent deep tillage increases soil quality and ecosystem multifunctionality in a Fluvo-aquic soil on the North China Plain. Journal of Environmental Management, 374: 124085, doi: 10.1016/j.jenvman.2025.124085.
|
|
|
|
Viewed |
|
|
|
Full text
|
|
|
|
|
Abstract
|
|
|
|
|
Cited |
|
|
|
|
| |
Shared |
|
|
|
|
| |
Discussed |
|
|
|
|