Spatiotemporal dynamics and dominant influencing factors of climatic water availability across the Pamir Plateau: an integrated OPGD and XGBoost-SHAP modeling approach
ZHANG Jingjing1,2,3, KONG Lingxin1,2,3, LIU Wen1,2,3,*(), Majid GULAYOZOV1,2, Anvar KODIROV4, MA Long1,2,3,5
1State Key Laboratory of Ecological Safety and Sustainable Development in Arid Lands, Xinjiang Institute of Ecology and Geography, Chinese Academy of Sciences, Urumqi 830011, China 2Research Center for Ecology and Environment of Central Asia, Chinese Academy of Sciences, Urumqi 830011, China 3University of Chinese Academy of Sciences, Beijing 100049, China 4Centre for Innovative Development of Science and New Technologies, Academy of Science of the Republic of Tajikistan, Dushanbe 734025, Tajikistan 5Xinjiang Key Laboratory of Water Cycle and Utilization in Arid Zone, Urumqi 830011, China
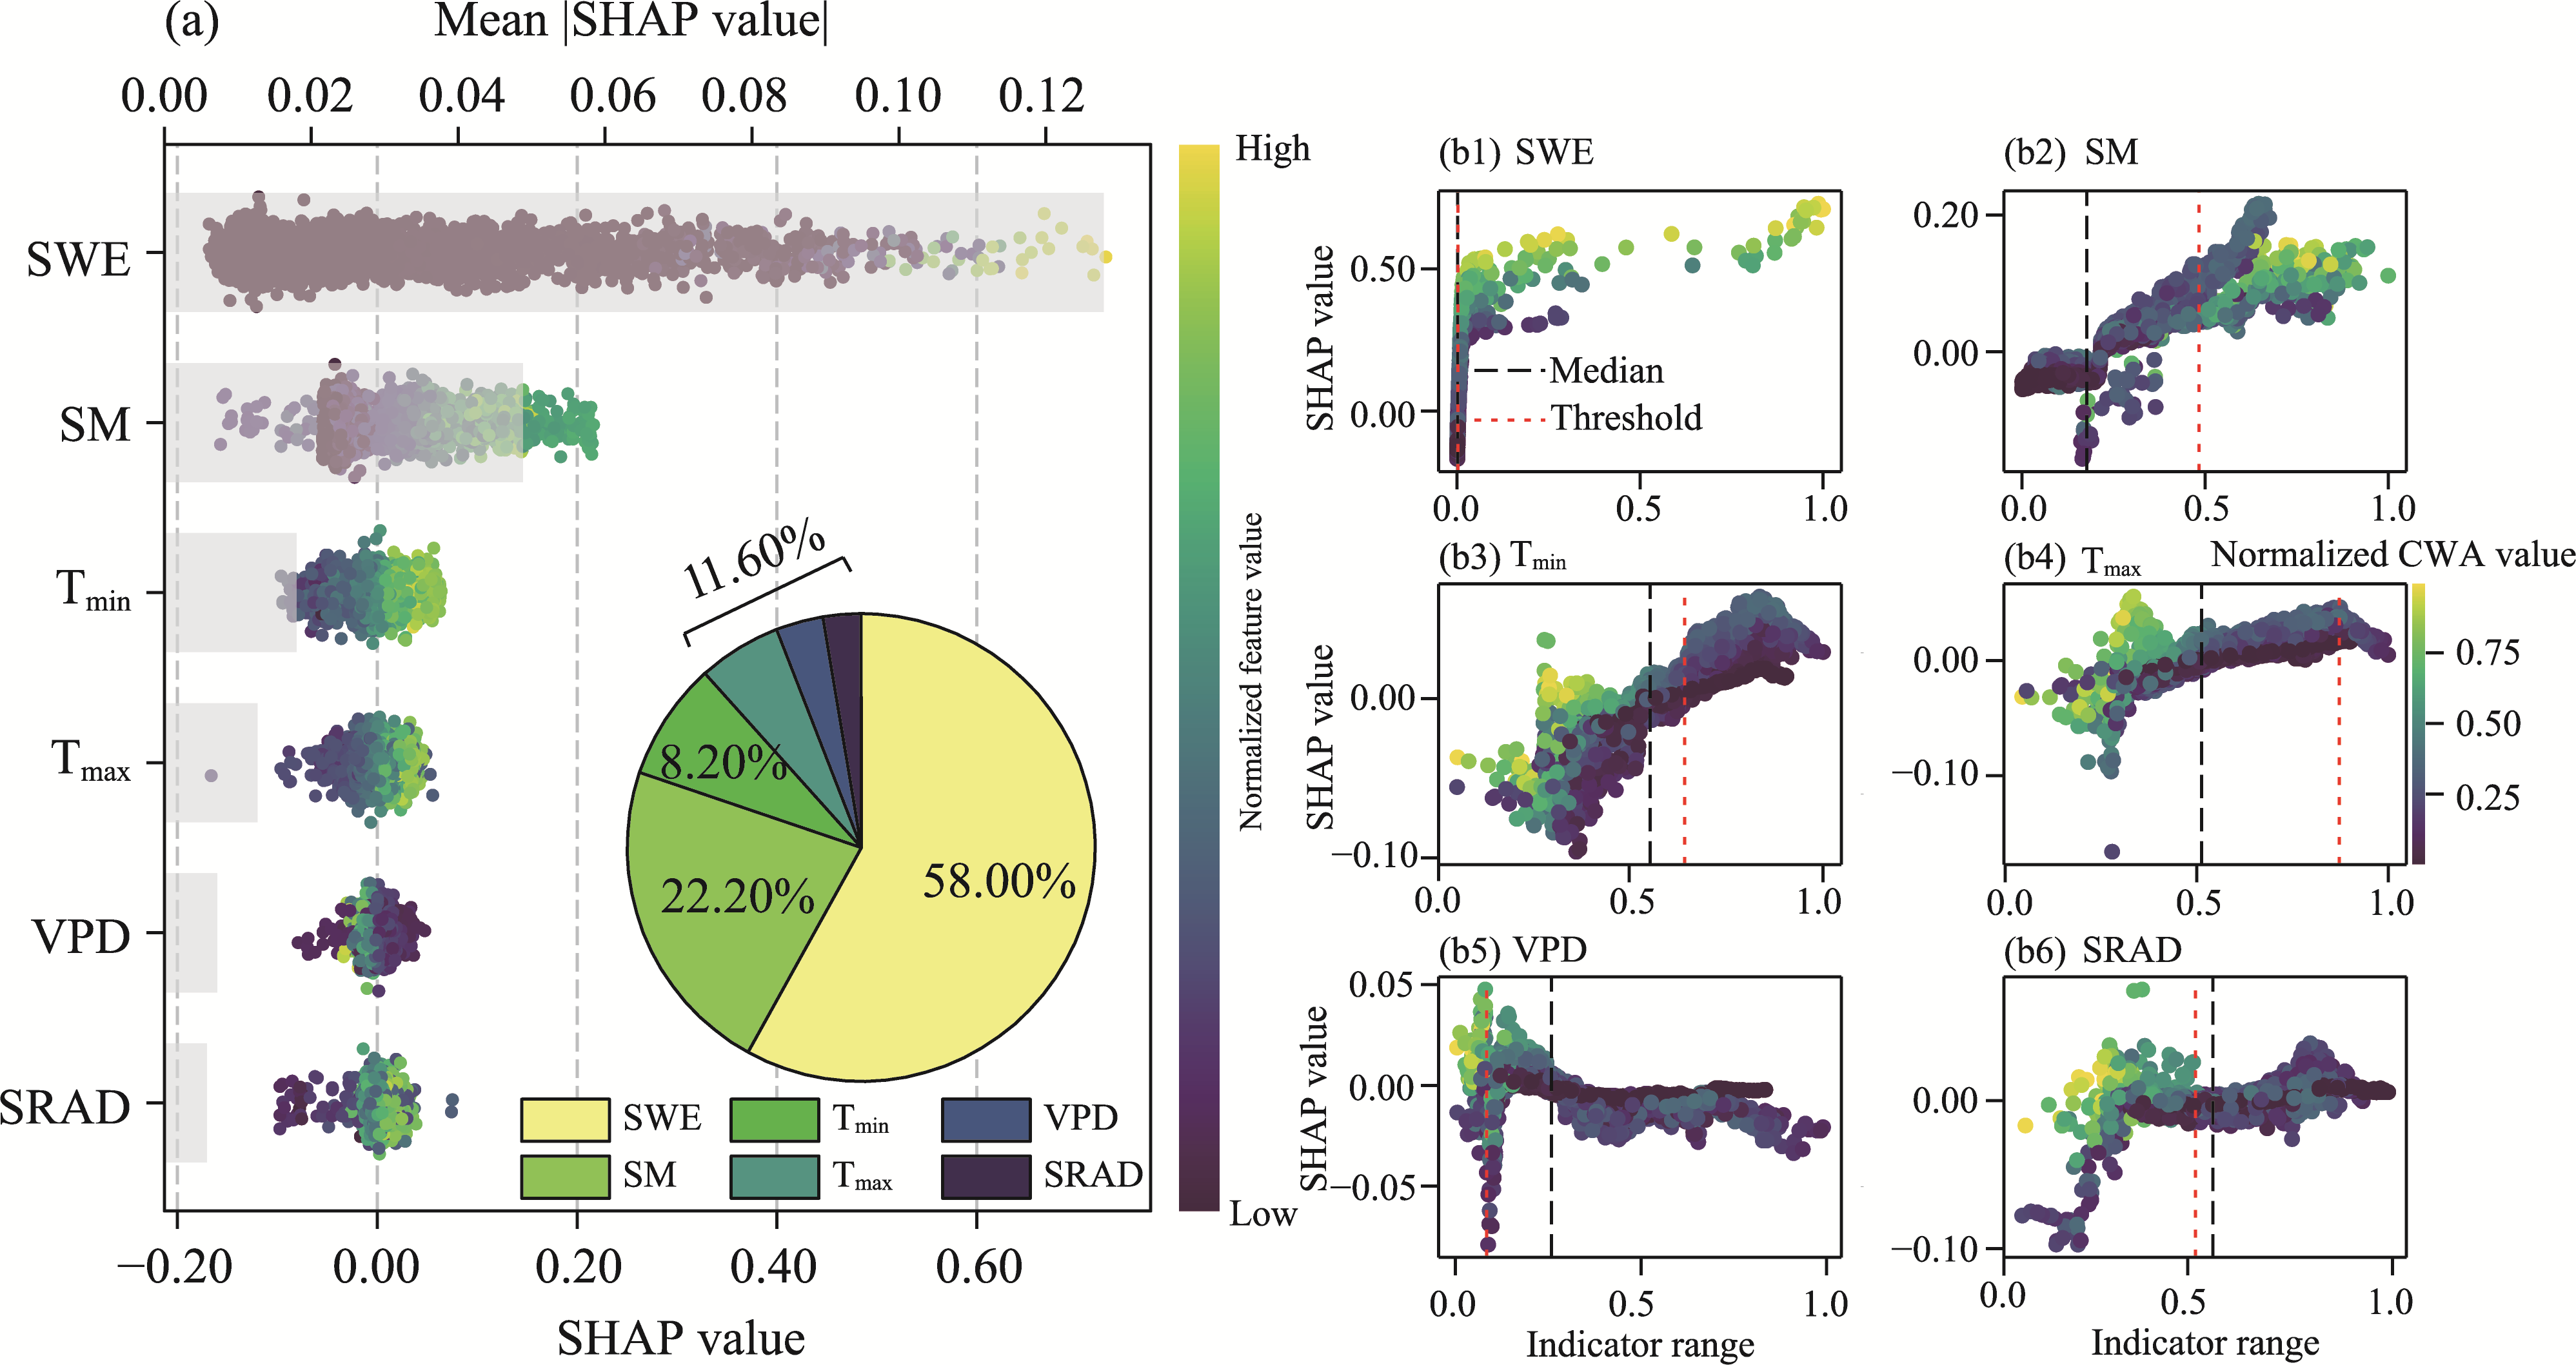
Under global climate change, limited research on the spatial and temporal variability and influencing factors of climatic water availability (CWA) constrains assessment of surface water surplus or deficit driven by climate. This study used an explanatory framework that integrated the Optimal Parameter Geographic Detector (OPGD) with the eXtreme Gradient Boosting-SHapley Additive exPlanations (XGBoost-SHAP) model to explore the spatiotemporal variability of CWA and the model-based explanatory variables across the Pamir Plateau from 1960 to 2020. Results showed that CWA exhibited significant spatial heterogeneity, with higher availability in the western part of the plateau and lower values in the eastern part. OPGD results highlighted soil moisture (SM) and snow water equivalent (SWE) as dominant explanatory variables of spatial heterogeneity, with terrain and human factors exerting weaker effects. XGBoost-SHAP results further identified SWE (58.00%) and SM (22.20%) as the two most important explanatory variables, while the maximum temperature (Tmax), vapor pressure deficit (VPD), and solar radiation (SRAD) combined accounted for only 11.60%. These findings advance the understanding of complex mountain hydrology by quantifying the relative importance of coupled meteorological and topographic drivers. The identification of SWE and SM as dominant explanatory variables highlights the crucial role of cryospheric and soil hydrological processes in regulating water availability across the Pamir Plateau, offering new insights into regional water resource management under climate change.
Received: 06 March 2026
Published: 30 September 2026
Conceptualization: ZHANG Jingjing, LIU Wen; Methodology: ZHANG Jingjing; Software: ZHANG Jingjing, KONG Lingxin; Data curation: ZHANG Jingjing; Visualization: ZHANG Jingjing, Majid GULAYOZOV, Anvar KODIROV; Writing - original draft preparation: ZHANG Jingjing; Writing - review and editing: KONG Lingxin, LIU Wen, MA Long; Funding acquisition: LIU Wen; Project administration: LIU Wen; Resources: LIU Wen, Majid GULAYOZOV, Anvar KODIROV; Supervision: LIU Wen. All authors approved the manuscript.
ZHANG Jingjing, KONG Lingxin, LIU Wen, Majid GULAYOZOV, Anvar KODIROV, MA Long. Spatiotemporal dynamics and dominant influencing factors of climatic water availability across the Pamir Plateau: an integrated OPGD and XGBoost-SHAP modeling approach. Journal of Arid Land, 2026, 18(9): 1506-1523.
Table 1 Overview of the data utilized in this study
Fig. 2Flowchart of the study. CWA, climatic water availability; PRE, precipitation; ETa, actual evapotranspiration; SM, soil moisture; VPD, vapor pressure deficit; SWE, snow water equivalent; SRAD, downward shortwave radiation; HAI, human activity intensity; Tmin, minimum temperature; DEM, digital elevation model; EOF, empirical orthogonal function; PC, principle component; XGBoost-SHAP, eXtreme Gradient Boosting-SHapley Additive exPlanations; Tmax, maximum temperature.
Fig. 3Multi-year average precipitation (PRE; a), ETa (b), and climatic water availability (CWA; c), and their spatial patterns (d-f) in the Pamir Plateau from 1960 to 2020. In Figure 3a-c, the boxes indicate the IQR (interquartile range; 75th to 25th of the data). The median value is shown as a line within the box. Whiskers extend to the most extreme value within 1.5×IQR. The circle means the actual observed values.
Fig. 4Spatial trends in PRE (a), ETa (b), and CWA (c) and their annual anomaly time series (d-f) in the Pamir Plateau from 1960 to 2020. In Figure 4c, black dots indicate areas with statistically significant trends at P<0.05 level.
Fig. 5Spatial and temporal patterns of the first two modes of CWA in the Pamir Plateau (a and c) and their associated principal component (PC) time series (b and d). EOF, empirical orthogonal function.
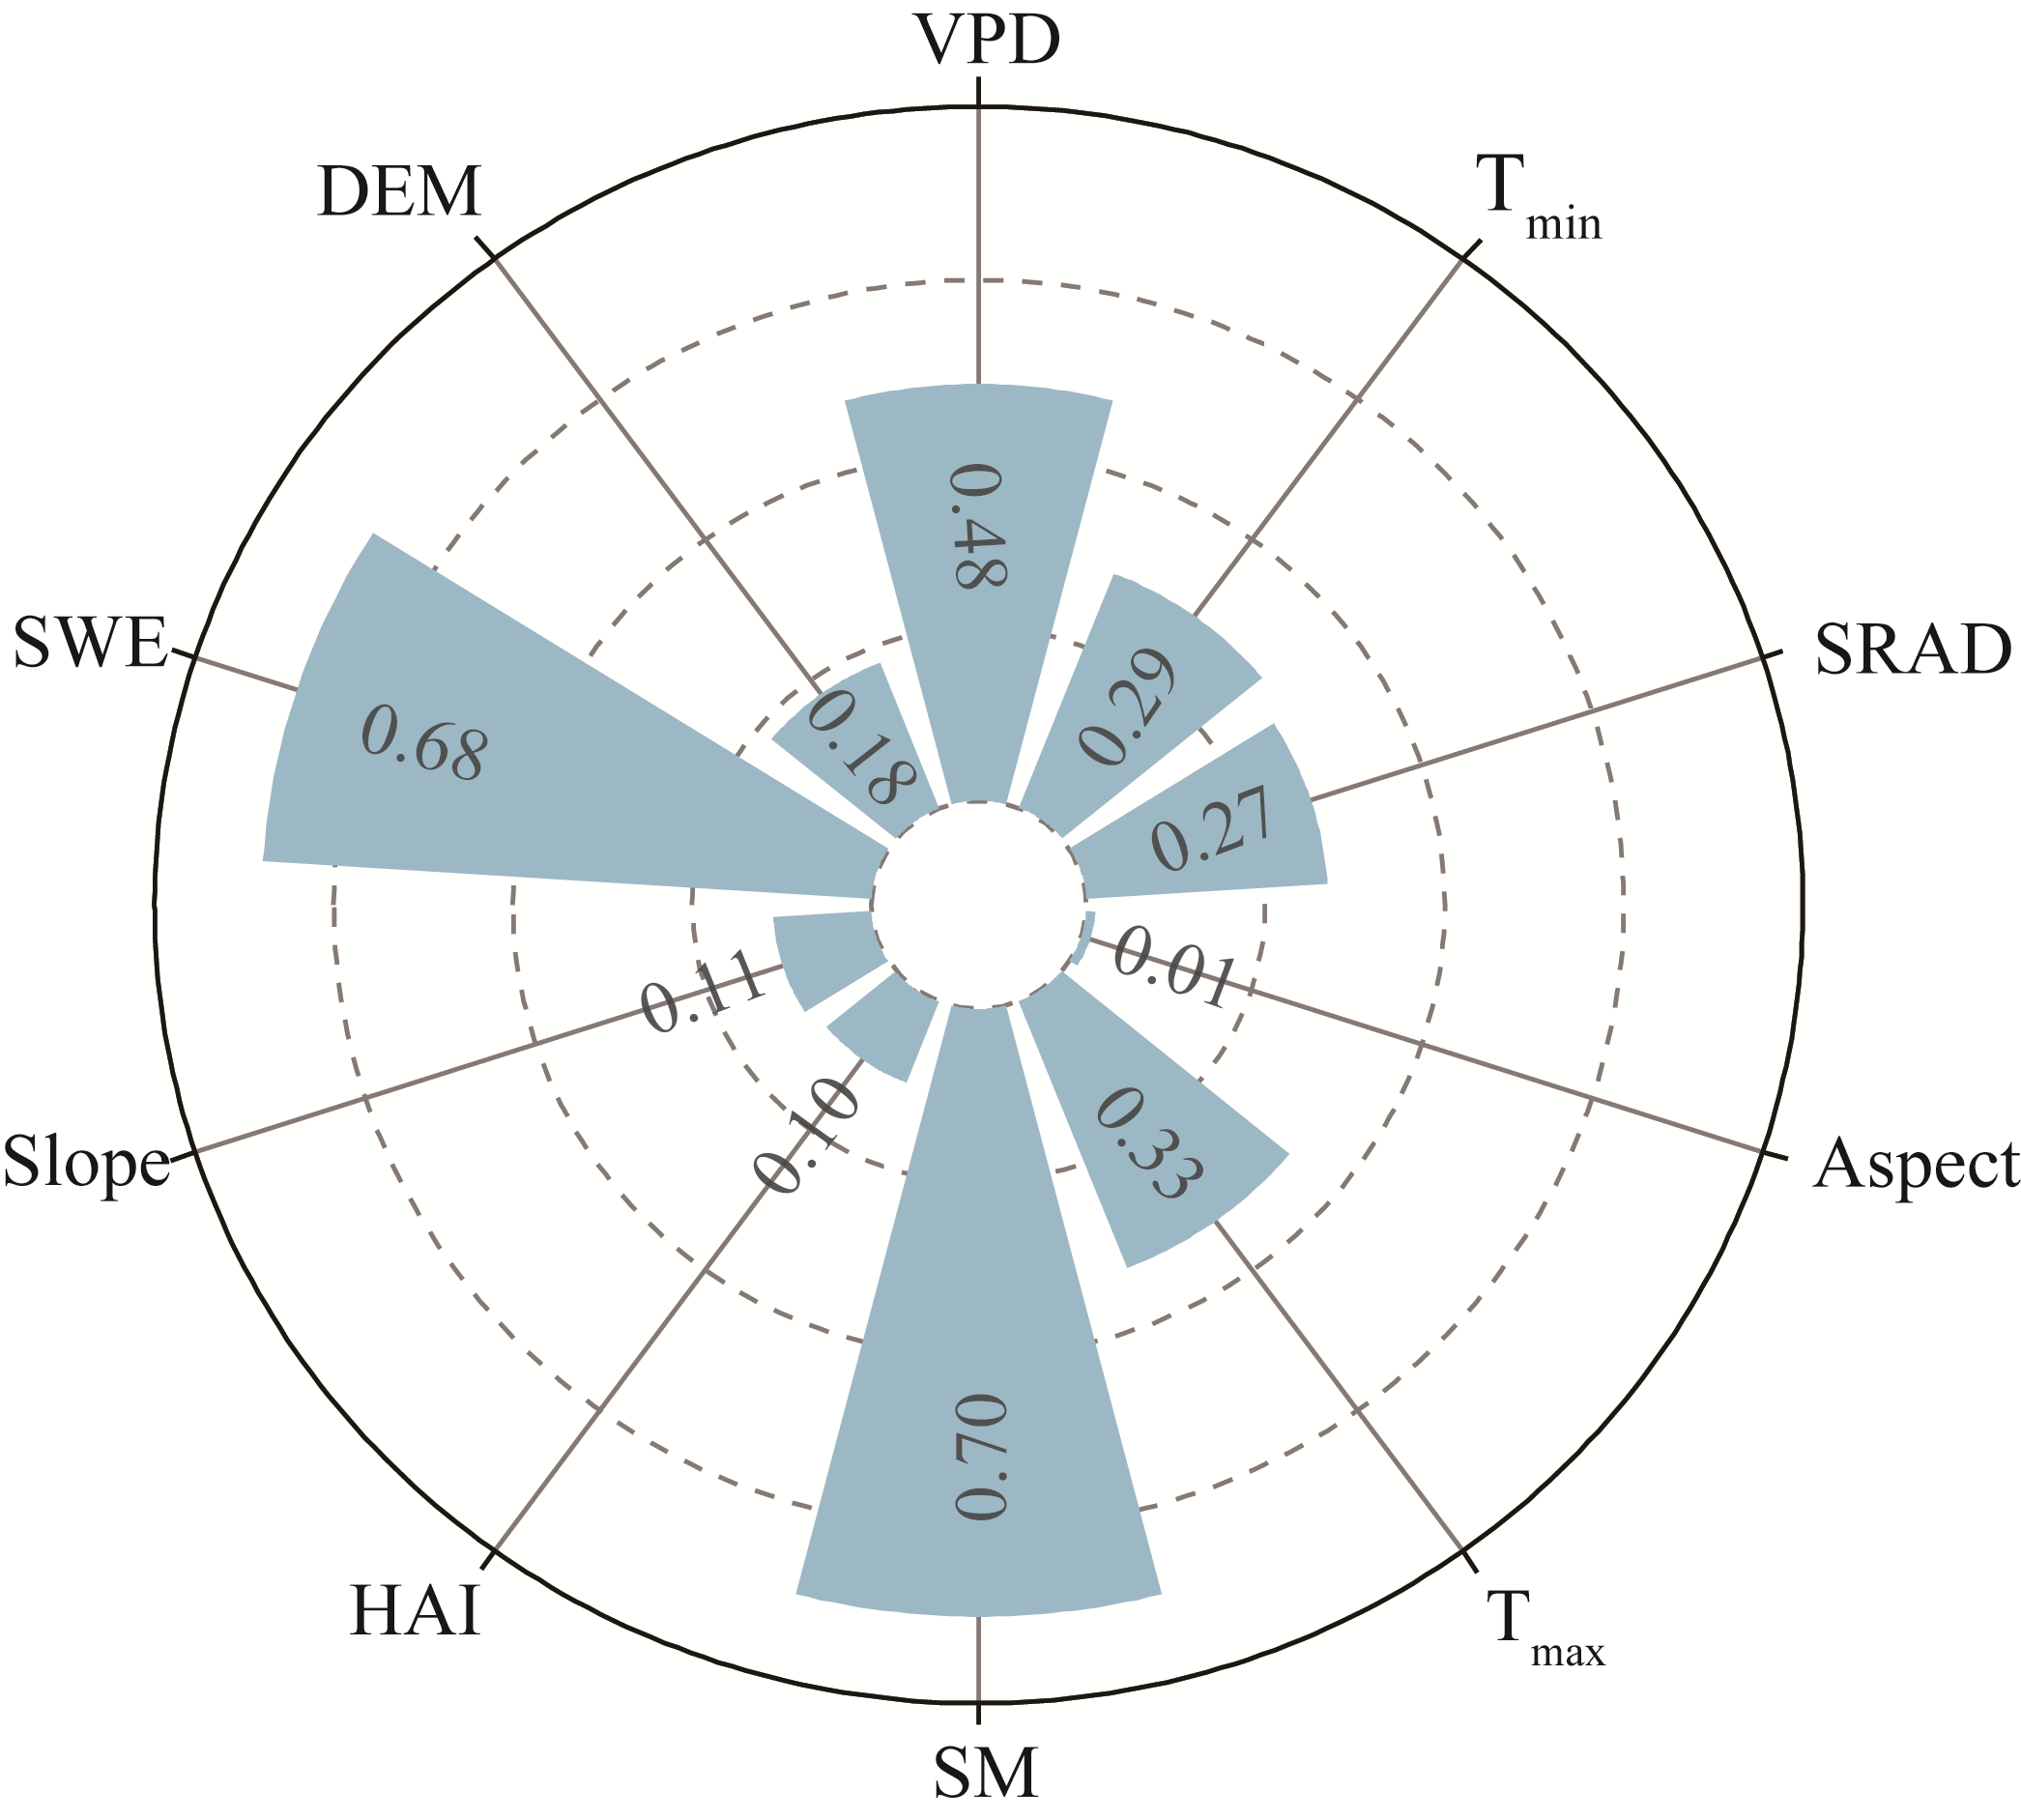
Fig. 6Overall explanatory power of CWA influencing factors in the Pamir Plateau region based on the Optimal Parameter Geographic Detector (OPGD)
Fig. 7XGBoost-SHAP analysis results of CWA driving factors in the Pamir Plateau (a) and their corresponding dependence plots (b1-b6). In Figure 7b, black and red dashed lines represent the median and threshold, respectively. Each dot represents a CWA sample, with its color indicating the magnitude of the factor value. The horizontal position of each point reflects whether the factor exerts a positive or negative influence on CWA.
Pamir Plateau and sub-region
R2
RMSE
MAE
Pamir Plateau
0.988
8.719
4.433
Sub-region I
0.993
3.433
0.886
Sub-region II
0.971
9.079
3.882
Sub-region II
0.984
12.484
7.609
Sub-region IV
0.972
11.939
8.420
Table S1 Model evaluation results
[1]
Abatzoglou J T, Dobrowski S Z, Parks S A, et al. 2018. TerraClimate, a high-resolution global dataset of monthly climate and climatic water balance from 1958-2015. Scientific Data, 5: 170191, doi: 10.1038/sdata.2017.191.
[2]
Allan R P, Barlow M, Byrne M P, et al. 2020. Advances in understanding large-scale responses of the water cycle to climate change. Annals of the New York Academy of Sciences, 1472(1): 49-75.
[3]
Arthur K N, Ribeiro R B, Pruski F F. 2026. Using spatial water balance to regionalize long-term mean streamflow in a data-scarce Brazilian semi-arid basin. Journal of Arid Environments, 233: 105528, doi: 10.1016/j.jaridenv.2025.105528.
[4]
Bai B, Yue P, Ren X Y, et al. 2026. Variation characteristics of water reserves in high mountains and surrounding areas in arid Central Asia. Journal of Hydrology: Regional Studies, 64: 103138, doi: 10.1016/j.ejrh.2026.103138.
[5]
Barandun M, Fiddes J, Scherler M, et al. 2020. The state and future of the cryosphere in Central Asia. Water Security, 11: 100072, doi: 10.1016/j.wasec.2020.100072.
[6]
Chen P, Sun B, Wang H J, et al. 2025. Opposite long-term trends in precipitation during spring and summer over the Pamir Plateau and influential factors. Atmospheric Research, 323: 108169, doi: 10.1016/j.atmosres.2025.108169.
[7]
Chen S Q, Chevalier M-L, Li H B. 2024. Tectonic and climatic controls on topographic spatial variability across the Pamir Plateau and implications for drainage evolution. Journal of Asian Earth Sciences, 276: 106333, doi: 10.1016/j.jseaes.2024.106333.
[8]
Chen T Q, Guestrin C. 2016. Xgboost:a scalable tree boosting system. In: Proceedings of the 22nd ACM SIGKDD International Conference on Knowledge Discovery and Data Mining. San Francisco: SIGMOD, 785-794.
[9]
Chen Y N, Li Y P, He B, et al. 2026. Enhanced spring warming in Central Asia and its ecohydrological impacts. Chinese Science Bulletin, 71(17): 3849-3855. (in Chinese)
[10]
Choi E, Rigden A J, Tangdamrongsub N, et al. 2023. US crop yield losses from hydroclimatic hazards. Environmental Research Letters, 19(1): 014005, doi: 10.1088/1748-9326/ad0c87.
[11]
Cui J P, Lian X, Huntingford C, et al. 2022. Global water availability boosted by vegetation-driven changes in atmospheric moisture transport. Nature Geoscience, 15(12): 982-988.
[12]
Fan M T, Xu J H, Chen Y N, et al. 2021. Reconstructing high-resolution temperature for the past 40 years in the Tianshan Mountains, China based on the Earth system data products. Atmospheric Research, 253: 105493, doi: 10.1016/j.atmosres.2021.105493.
[13]
Fang Y, Jawitz J W. 2019. The evolution of human population distance to water in the USA from 1790 to 2010. Nature Communications, 10(1): 430, doi: 10.1038/s41467-019-08366-z.
[14]
Gafurov A, Selyuzhenok V, Latinovic M, et al. 2024. GRACE observes the natural and irrigation-induced regional redistribution of water storage in Central Asia. Journal of Hydrology: Regional Studies, 56: 101994, doi: 10.1016/j.ejrh.2024.101994.
[15]
Gao H F, Zou X J, Wu J F, et al. 2020. Post-20th century near-steady state of Batura Glacier: Observational evidence of Karakoram Anomaly. Scientific Reports, 10(1): 987, doi: 10.1038/s41598-020-57660-0.
[16]
Getirana A. 2016. Extreme water deficit in Brazil detected from space. Journal of Hydrometeorology, 17(2): 591-599.
[17]
Giardina F, Gentine P, Konings A G, et al. 2023. Diagnosing evapotranspiration responses to water deficit across biomes using deep learning. New Phytologist, 240(3): 968-983.
[18]
Hajek O L, Knapp A K. 2022. Shifting seasonal patterns of water availability: ecosystem responses to an unappreciated dimension of climate change. New Phytologist, 233(1): 119-125.
[19]
Hammoud Y, Allali Y, Saadane A. 2025. Improving TerraClimate hydroclimatic data accuracy with XGBoost for regions with sparse gauge networks: a case study of the Meknes Plateau and the Middle Atlas Causse, Morocco. Reports on Geodesy and Geoinformatics, 119(1): 85-98.
[20]
Han W Q, Zheng J H, Guan J Y, et al. 2024a. A greater negative impact of future climate change on vegetation in Central Asia: evidence from trajectory/pattern analysis. Environmental Research, 262(Part 2): 119898, doi: 10.1016/j.envres.2024.119898.
[21]
Han X Y, Chen Y N, Fang G H, et al. 2024b. Spatiotemporal variations and driving factors of water availability in the arid and semiarid regions of Northern China. Remote Sensing, 16(22): 4318, doi: 10.3390/rs16224318.
[22]
Hannachi A. 2004. A Primer for EOF Analysis of Climate Data. Berkshire: University of Reading.
[23]
Hoelzle M, Barandun M, Bolch T, et al. 2019. The status and role of the alpine cryosphere in Central Asia. In: XenariosS, Schmidt-VogtD, QadirM, et al. The Aral Sea Basin:Water for Sutainable Develooment in Central Aisa. New York: Talyor & Francis Group, 100-121.
[24]
Holub P, Klem K, Veselá B, et al. 2022. Interactive effects of UV radiation and water deficit on production characteristics in upland grassland and their estimation by proximity sensing. Ecology and Evolution, 12(9): e9330, doi: 10.1002/ece3.9330.
[25]
Jouberton A, Shaw T E, Miles E, et al. 2025. Snowfall decrease in recent years undermines glacier health and meltwater resources in the Northwestern Pamirs. Communications Earth & Environment, 6(1): 691, doi: 10.1038/s43247-025-02611-8.
[26]
Jung M, Reichstein M, Ciais P, et al. 2010. Recent decline in the global land evapotranspiration trend due to limited moisture supply. Nature, 467(7318): 951-954.
[27]
Kang Y D, Liu X C. 2025. Characteristics and potential source areas of ozone pollution in Pamir Plateau. Science of The Total Environment, 967: 178783, doi: 10.1016/j.scitotenv.2025.178783.
[28]
Kong L X, Li Y Z, Ma L, et al. 2025. Climate change impacts and atmospheric teleconnections on runoff dynamics in the upper-middle Amu Darya River of Central Asia. Water, 17(5): 721, doi: 10.3390/w17050721.
[29]
Kong L X, Gulayozov M, Zhang J J, et al. 2026. Non-linear and scale-dependent hydrological transmission of basin climate forcing to lake level dynamics in Sarez Lake. Hydrological Processes, 40(6): e70591, doi: 10.1002/hyp.70591.
[30]
Li X Z, Huang W R. 2021. How long should the pre-existing climatic water balance be considered when capturing short-term wetness and dryness over China by using SPEI? Science of The Total Environment, 786: 147575, doi: 10.1016/j.scitotenv.2021.147575.
[31]
Liu H H, Zhang Z, Liu S Y, et al. 2025. Quantifying spatiotemporal changes in supraglacial debris cover in eastern Pamir from 1994 to 2024 based on the Google Earth Engine. Remote Sensing, 17(1): 144, doi: 10.3390/rs17010144.
[32]
Liu L, Zheng J H, Guan J Y, et al. 2024. Strong positive direct impact of soil moisture on the growth of Central Asian grasslands. Science of The Total Environment, 954: 176663, doi: 10.1016/j.scitotenv.2024.176663.
[33]
Lundberg S M, Lee S-I. 2017. A unified approach to interpreting model predictions. In: Proceedings of the 31st International Conference on Neural Information Processing Systems. Long Beach: Neural Information Processing Systems, 4768-4777.
[34]
Mao X L, Xing L, Shang W, et al. 2024. Moisture sources for precipitation over the Pamirs Plateau in winter and spring. Quarterly Journal of the Royal Meteorological Society, 150(759): 820-833.
[35]
Milly P. 1994. Climate, interseasonal storage of soil water, and the annual water balance. Advances in Water Resources, 17(1-2): 19-24.
[36]
Myers D T, Ficklin D L, Robeson S M. 2023. Hydrologic implications of projected changes in rain-on-snow melt for Great Lakes Basin watersheds. Hydrology and Earth System Sciences, 27(9): 1755-1770.
[37]
Ogunleye A, Wang Q G. 2019. XGBoost model for chronic kidney disease diagnosis. IEEE/ACM Transactions on Computational Biology and Bioinformatics, 17(6): 2131-2140.
[38]
Oki T, Kanae S. 2006. Global hydrological cycles and world water resources. Science, 313(5790): 1068-1072.
[39]
Pohl E, Gloaguen R, Andermann C, et al. 2017. Glacier melt buffers river runoff in the Pamir Mountains. Water Resources Research, 53(3): 2467-2489.
[40]
Qiu H, Zhou T J, Zou L W, et al. 2024. Future changes in precipitation and water availability over the Tibetan Plateau projected by CMIP6 models constrained by climate sensitivity. Atmospheric and Oceanic Science Letters, 17(5): 100537, doi: 10.1016/j.aosl.2024.100537.
[41]
Rodell M, Famiglietti J S, Wiese D N, et al. 2018. Emerging trends in global freshwater availability. Nature, 557(7707): 651-659.
[42]
Shen Z X, Zhang Q, Singh V P, et al. 2022. Drying in the low-latitude Atlantic Ocean contributed to terrestrial water storage depletion across Eurasia. Nature Communications, 13(1): 1849, doi: 10.1038/s41467-022-29544-6.
[43]
Song X P, Hansen M C, Stehman S V, et al. 2018. Global land change from 1982 to 2016. Nature, 560(7720): 639-643.
[44]
Song Y Z, Wang J F, Ge Y, et al. 2020. An optimal parameters-based geographical detector model enhances geographic characteristics of explanatory variables for spatial heterogeneity analysis: cases with different types of spatial data. GIScience & Remote Sensing, 57(5): 593-610.
[45]
Stirnberg R, Cermak J, Kotthaus S, et al. 2021. Meteorology-driven variability of air pollution (PM1) revealed with explainable machine learning. Atmospheric Chemistry and Physics, 21(5): 3919-3948.
[46]
Su Y A, Chen S Q, Sui Y J, et al. 2025. Gaining water bodies by climate change benefits water crisis mitigation in Central Asia. Science Bulletin, 70(14): 2322-2329.
[47]
Sun X Y, Liu J F, Fan J H, et al. 2024. Advances in research and application of remote sensing-based snow monitoring products. Remote Sensing for Natural Resources, 36(3): 13-27. (in Chinese)
[48]
Suthar G, Kaul N, Khandelwal S, et al. 2024. Predicting land surface temperature and examining its relationship with air pollution and urban parameters in Bengaluru: a machine learning approach. Urban Climate, 53: 101830, doi: 10.1016/j.uclim.2024.101830.
[49]
Tanuja , Kumar R. 2025. Climatic shifts in the Beas Basin: a spatio-temporal analysis of time series of temperature and precipitation of TerraClimate dataset. Science of The Total Environment, 984: 179712, doi: 10.1016/j.scitotenv.2025.179712.
[50]
Wang G, Zhang Q, Woolway R I, et al. 2025a. Warm-wetting and/or warm-drying tendency over Xinjiang, China? Journal of Hydrology, 660(Part A): 133417, doi: 10.1016/j.jhydrol.2025.133417.
[51]
Wang J F, Xu C D. 2017. Geodetector: principle and prospective. Acta Geographica Sinica, 72(1): 116-134.
[52]
Wang M Y, Chen Y B, Li J Y, et al. 2025b. Spatiotemporal evolution and driving force analysis of drought characteristics in the Yellow River Basin. Ecological Indicators, 170: 113007, doi: 10.1016/j.ecolind.2024.113007.
[53]
Wang S, Peng H, Liang S K. 2022. Prediction of estuarine water quality using interpretable machine learning approach. Journal of Hydrology, 605: 127320, doi: 10.1016/j.jhydrol.2021.127320.
[54]
Xu P F, Zhou G Y, Zhao Q H, et al. 2024. Spatial-temporal dynamics and influencing factors of city level carbon emission of China. Ecological Indicators, 167: 112672, doi: 10.1016/j.ecolind.2024.112672.
[55]
Xu Y, Xu X R, Tang Q. 2016. Human activity intensity of land surface: concept, methods and application in China. Journal of Geographical Sciences, 26: 1349-1361.
[56]
Xue X Y, Xu X D, Ren G Y, et al. 2024. The Influence of local climatic factors and water vapor transport from North Atlantic Ocean on winter snow-cover variation on western Kunlun Mountains and eastern Pamir Plateau. Remote Sensing, 16(23): 4368, doi: 10.3390/rs16234368.
[57]
Yahefujiang H, Zou J, Tangjialeke W, et al. 2026. The dominant effect of atmospheric drought on carbon and water fluxes in Central Asia and the response of critical thresholds. Agricultural Water Management, 325: 110180, doi: 10.1016/j.agwat.2026.110180.
[58]
Yang T, Chen X, Hamdi R, et al. 2025. Rainfall-driven extreme snowmelt will increase in the Tianshan and Pamir regions under future climate projection. Journal of Geophysical Research: Atmospheres, 130(1): e2024JD042323, doi: 10.1029/2024JD042323.
[59]
Yao J Q, Chen Y N, Chen J, et al. 2021. Intensification of extreme precipitation in arid Central Asia. Journal of Hydrology, 598: 125760, doi: 10.1016/j.jhydrol.2020.125760.
[60]
Yoon J H, Wang S S, Gillies R R, et al. 2015. Increasing water cycle extremes in California and in relation to ENSO cycle under global warming. Nature Communications, 6(1): 8657, doi: 10.1038/ncomms9657.
[61]
Zhang K W, Zhang Q, Wang G, et al. 2024. Spatiotemporal interactions between soil moisture and water availability across the Yellow River Basin, China. Journal of Hydrology: Regional Studies, 54: 101874, doi: 10.1016/j.ejrh.2024.101874.
[62]
Zhang P, Wang Y, Ma W J, et al. 2025. Identifying the determinants of natural, anthropogenic factors and precursors on PM1 pollution in urban agglomerations in China: insights from optimal parameter-based geographic detector and robust geographic weighted regression models. Environmental Research, 279(Part 1): 121817, doi: 10.1016/j.envres.2025.121817.
[63]
Zhang Y Q, Li C C, Chiew F H S, et al. 2023. Southern Hemisphere dominates recent decline in global water availability. Science, 382(6670): 579-584.
[64]
Zhou S, Williams A P, Lintner B R, et al. 2021. Soil moisture-atmosphere feedbacks mitigate declining water availability in drylands. Nature Climate Change, 11(1): 38-44.
[65]
Zhu R, Hu T S, Wu F Y, et al. 2023. Photosynthetic and hydraulic changes caused by water deficit and flooding stress increase rice's intrinsic water-use efficiency. Agricultural Water Management, 289: 108527, doi: 10.1016/j.agwat.2023.108527.