| Research article |
|


|
|
|
| Evaluating agricultural water-use efficiency based on water footprint of crop values: a case study in Xinjiang of China |
Yang HAI1, Aihua LONG1,2,*( ), Pei ZHANG1, Xiaoya DENG1, Junfeng LI2, Mingjiang DENG3 ), Pei ZHANG1, Xiaoya DENG1, Junfeng LI2, Mingjiang DENG3 |
1 State Key Laboratory of Simulation and Regulation of Water Cycle in River Basin, China Institute of Water Resources and Hydropower Research, Beijing 100038, China
2 College of Water Conservancy and Architectural Engineering, Shihezi University, Shihezi 832003, China
3 Xinjiang Water Conservancy and Hydropower Planning and Design Management Bureau, Urumqi 830000, China |
|
|
|
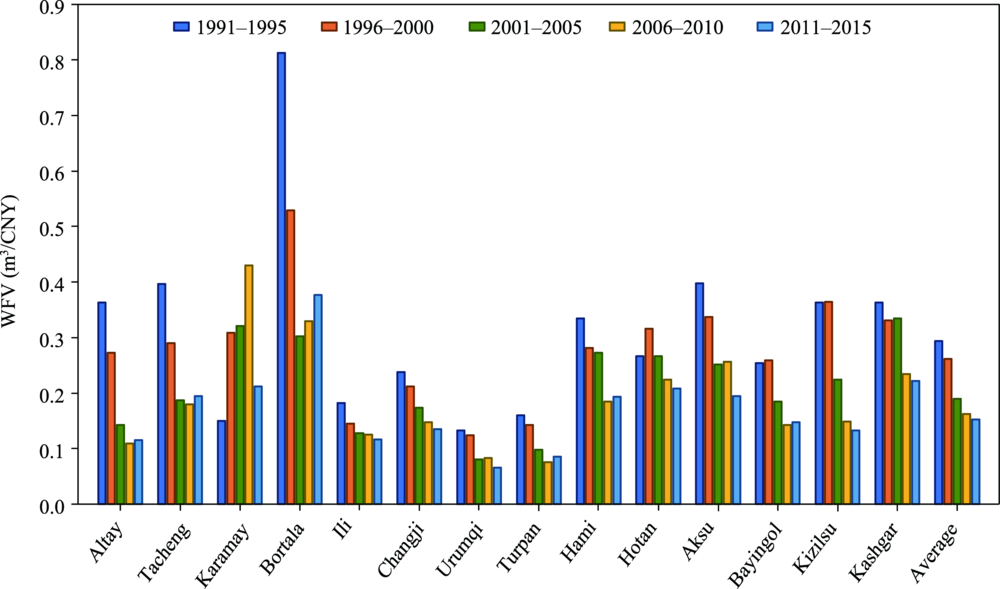
Abstract Efficient agricultural water use is crucial for food safety and water conservation on a global scale. To quantitatively investigate the agricultural water-use efficiency in regions exhibiting the complex agricultural structure, this study developed an indicator named water footprint of crop values (WFV) that is based on the water footprint of crop production. Defined as the water volume used to produce a unit price of crop (m3/CNY), the new indicator makes it feasible to directly compare the water footprint of different crops from an economic perspective, so as to comprehensively evaluate the water-use efficiency under the complex planting structure. On the basis of WFV, the study further proposed an indicator of structural water-use coefficient (SWUC), which is represented by the ratio of water-use efficiency for a given planting structure to the water efficiency for a reference crop and can quantitatively describe the impact of planting structure on agricultural water efficiency. Then, a case study was implemented in Xinjiang Uygur Autonomous Region of China. The temporal and spatial variations of WFV were assessed for the planting industries in 14 prefectures and cities of Xinjiang between 1991 and 2015. In addition, contribution rate analysis of WFV for different prefectures and cities was conducted to evaluate the variations of WFV caused by different influencing factors: agricultural input, climatic factors, and planting structure. Results from these analyses indicated first that the average WFV of planting industries in Xinjiang significantly decreased from 0.293 m3/CNY in 1991 to 0.153 m3/CNY in 2015, corresponding to an average annual change rate of -3.532%. WFV in 13 prefectures and cities (with the exception of Karamay) has declined significantly during the period of 1991-2015, indicating that agricultural water-use efficient has effectively improved. Second, the average SWUC in Xinjiang decreased from 1.17 to 1.08 m3/CNY in the 1990s, and then declined to 1.00 m3/CNY in 2011-2015. The value of SWUC was highly consistent with the relative value of WFV in most prefectures and cities, showing that planting structure is one of the primary factors affecting regional agricultural water-use efficiency. Third, the contribution rate of WFV variations from human factors including agricultural input and planting structure was much more significant than that from climatic factors. However, the distribution of agricultural input and the adjustment of planting structure significantly differed among prefectures and cities, suggesting regional imbalances of agricultural development. This study indicated the feasibility and effectiveness of controlling agricultural water use through increasing technical input and rational selection of crops in the face of impending climate change. Specifically, we concluded that, the rational application of chemical fertilizers, the development of the fruit industry, and the strict restriction of the cotton industry should be implemented to improve the agricultural water-use efficiency in Xinjiang.
|
|
Received: 13 October 2019
Published: 10 July 2020
|
|
Corresponding Authors:
|
About author: *Corresponding author: LONG Aihua (E-mail: ahlong@iwhr.com)
The first and second authors contributed equally to this work. |
|
|
| [1] |
Aldaya M M, Munoz G, Hoekstra A Y. 2010. Water footprint of cotton, wheat and rice production in Central Asia. In: Value of Water Research Report Series Vol. 41. UNESCO-IHE Institute for Water Education. Delft, the Netherlands.
|
|
|
| [2] |
Apurupa G, Jeffrey J V, Lisa R W. 2019. Stomatal response in soybean during drought improves leaf-scale and field-scale water use efficiencies. Agricultural and Forest Meteorology, 2276-77: 107629, doi: 10.1016/j.agrformet.2019.107629.
|
|
|
| [3] |
Bocchiola D, Nana E, Soncini A. 2013. Impact of climate change scenarios on crop yield and water footprint of maize in the Po valley of Italy. Agricultural Water Management, 116: 50-61.
doi: 10.1016/j.agwat.2012.10.009
|
|
|
| [4] |
Bulsink F, Hoekstra A Y, Booij M J. 2010. The water footprint of Indonesian provinces related to the consumption of crop products. Hydrology and Earth System Sciences, 14(1): 119-128.
doi: 10.5194/hess-14-119-2010
|
|
|
| [5] |
Bureau of Statistics of Xinjiang Production and Construction Corps. 1991-2015. Xinjiang Production and Construction Corps Statistical Yearbook. Beijing: China Statistics Press. (in Chinese)
|
|
|
| [6] |
Bureau of Statistics of Xinjiang Uygur Autonomous Region. 1991-2015. Xinjiang Statistical Yearbook. Beijing: China Statistics Press. (in Chinese)
|
|
|
| [7] |
Calzadilla A, Rehdanz K, Tol R S J, et al. 2010. The economic impact of more sustainable water use in agriculture: A computable general equilibrium analysis. Journal of Hydrology, 384(3): 292-305.
doi: 10.1016/j.jhydrol.2009.12.012
|
|
|
| [8] |
Chapagain A K, Hoekstra A Y, Savenije H H G, et al. 2006. The water footprint of cotton consumption: An assessment of the impact of worldwide consumption of cotton products on the water resources in the cotton producing countries. Ecological Economics, 60(1): 186-203.
doi: 10.1016/j.ecolecon.2005.11.027
|
|
|
| [9] |
Chapagain A K, Orr S. 2009. An improved water footprint methodology linking global consumption to local water resources: A case of Spanish tomatoes. Journal of Environmental Management, 90(2): 1219-1228.
doi: 10.1016/j.jenvman.2008.06.006
|
|
|
| [10] |
Chapagain A K, Hoekstra A Y. 2011. The blue, green and grey water footprint of rice from production and consumption perspectives. Ecological Economics, 70(4): 749-758.
doi: 10.1016/j.ecolecon.2010.11.012
|
|
|
| [11] |
Chen S Y, Shi Y Y, Guo Y Z, et al. 2010. Temporal and spatial variation of annual mean air temperature in arid and semiarid region in northwest China over a recent 46 year period. Journal of Arid Land, 2(2): 87-97.
doi: 10.3724/SP.J.1227.2010.00087
|
|
|
| [12] |
Chu Y M, Shen Y J, Yuan Z J, et al. 2017. Water footprint of crop production for different crop structures in the Hebei southern plain, North China. Hydrology and Earth System Sciences, 21(6): 3061-3069.
doi: 10.5194/hess-21-3061-2017
|
|
|
| [13] |
Du T S, Kang S Z, Zhang J H, et al. 2015. Deficit irrigation and sustainable water-resource strategies in agriculture for China's food security. Journal of Experimental Botany, 66(8): 2253-2269.
doi: 10.1093/jxb/erv034
pmid: 25873664
|
|
|
| [14] |
Fan Y B, Wang C G, Nan Z B. 2014. Comparative evaluation of crop water use efficiency, economic analysis and net household profit simulation in arid Northwest China. Agricultural Water Management, 146: 335-345.
doi: 10.1016/j.agwat.2014.09.001
|
|
|
| [15] |
Gilbert M, Hernandez M. 2019. How should crop water-use efficiency be analyzed? A warning about spurious correlations. Field Crops Research, 235: 59-67.
doi: 10.1016/j.fcr.2019.02.017
|
|
|
| [16] |
Hassan R M, Olbrich B. 1999. Comparative analysis of the economic efficiency of water use by plantation forestry and irrigation agriculture in the Crocodile River catchment. Agrekon, 38(4): 566-575.
doi: 10.1080/03031853.1999.9524870
|
|
|
| [17] |
He C Y, Huang G H, Liu L R, et al. 2020. Multi-dimensional diagnosis model for the sustainable development of regions facing water scarcity problem: A case study for Guangdong, China. Science of The Total Environment, 734: 139394, doi: 10.1016/j.scitotenv.2020.139394.
doi: 10.1016/j.scitotenv.2020.139394
pmid: 32485462
|
|
|
| [18] |
Hoekstra A Y, Hung P Q. 2002. Virtual water trade: a quantification of virtual water flows between nations in relation to international crop trade. In: Value of Water Research Report Series Vol. 11. UNESCO-IHE Institute for Water Education. Delft, the Netherlands.
|
|
|
| [19] |
Hoekstra A Y, Chapagain A K. 2008. Globalization of Water: Sharing the Planet's Freshwater Resources. Oxford: Blackwell Publishing, 1-208.
|
|
|
| [20] |
Hoekstra A Y, Chapagain A K, Aldaya M M, et al. 2009. Water Footprint Manual: State of the Art 2009, Enschede: Water Footprint Network Press, 1-127.
|
|
|
| [21] |
Howell T A. 2001. Enhancing water use efficiency in irrigated agriculture. Agronomy Journal, 93(2): 281-289.
doi: 10.2134/agronj2001.932281x
|
|
|
| [22] |
Kahramanoglu I, Usanmaz S, Alas T. 2019. Water footprint and irrigation use efficiency of important crops in Northern Cyprus from an environmental, economic and dietary perspective. Saudi Journal of Biological Sciences, 27(1), doi: 10.1016/j.sjbs.2019.06.005.
doi: 10.1016/j.sjbs.2019.11.002
pmid: 31889865
|
|
|
| [23] |
Li Q H, Chen Y N, Shen Y J, et al. 2011. Spatial and temporal trends of climate change in Xinjiang, China. Journal of Geographical Sciences, 21(6): 1007-1018.
doi: 10.1007/s11442-011-0896-8
|
|
|
| [24] |
Li X S, Chen Z Z. 2010. Correctly using SPSS software for principal components analysis. Statistical Research, 27(8): 105-108. (in Chinese)
|
|
|
| [25] |
Lovarelli D, Bacenetti J, Fiala M. 2016. Water Footprint of crop productions: a review. Science of The Total Environment, 548-549: 236-251.
doi: 10.1016/j.scitotenv.2016.01.022
pmid: 26802352
|
|
|
| [26] |
Lu Y, Zhang X Y, Chen S Y, et al. 2016. Changes in water use efficiency and water footprint in grain production over the past 35 years: a case study in the North China Plain. Journal of Cleaner Production, 116(1): 71-79.
doi: 10.1016/j.jclepro.2016.01.008
|
|
|
| [27] |
Ma W J, Christian O, Yang D W. 2020. Spatiotemporal supply-demand characteristics and economic benefits of crop water footprint in the semi-arid region. Science of The Total Environment, 738: 139502, doi: 10.1016/j.scitotenv.2020.139502.
doi: 10.1016/j.scitotenv.2020.139502
pmid: 32544702
|
|
|
| [28] |
Ma X C, Karen A S, Pete W J. 2019. Performance of direct root-zone deficit irrigation on Vitis vinifera L. cv. Cabernet Sauvignon production and water use efficiency in semi-arid southcentral Washington. Agricultural Water Management, 221: 47-57.
doi: 10.1016/j.agwat.2019.04.023
|
|
|
| [29] |
Marano R P, Filippi R A. 2015. Water Footprint in paddy rice systems. Its determination in the provinces of Santa Fe and Entre Ríos. Argentina. Ecological Indicators, 56: 229-236.
doi: 10.1016/j.ecolind.2015.03.027
|
|
|
| [30] |
Mekonnen M M, Hoekstra A Y. 2010. A global and high-resolution assessment of the green, blue and grey water footprint of wheat. Hydrology and Earth System Sciences, 14(7): 17-23.
|
|
|
| [31] |
Mekonnen M M, Hoekstra A Y. 2014. Water footprint benchmarks for crop production: A first global assessment. Ecological Indicators, 46(11): 214-223.
doi: 10.1016/j.ecolind.2014.06.013
|
|
|
| [32] |
Nana E, Corbari C, Bocchiola D. 2014. A model for crop yield and water footprint assessment: Study of maize in the Po valley. Agricultural Systems, 127: 139-149.
doi: 10.1016/j.agsy.2014.03.006
|
|
|
| [33] |
National Bureau of Statistics of China. 2015. Statistical Yearbook of China, Beijing: China Statistics Press. (in Chinese)
|
|
|
| [34] |
Pellegrini G, Ingrao C, Camposeo S, et al. 2016. Application of water footprint to olive growing systems in the Apulia region: a comparative assessment. Journal of Cleaner Production, 112(5): 2407-2418.
doi: 10.1016/j.jclepro.2015.10.088
|
|
|
| [35] |
Piao S, Ciais P, Huang Y, et al. 2010. The impacts of climate change on water resources and agriculture in China. Nature, 467(7311): 43-51.
doi: 10.1038/nature09364
pmid: 20811450
|
|
|
| [36] |
Ridoutt B G, Pfister S. 2010. A revised approach to water footprint to make transparent the impacts of consumption and production on global freshwater scarcity. Global Environmental Change, 20(1): 113-120.
doi: 10.1016/j.gloenvcha.2009.08.003
|
|
|
| [37] |
Rodriguez C I, Galarreta V A R D, Kruse E E. 2015. Analysis of water footprint of potato production in the pampean region of Argentina. Journal of Cleaner Production, 90: 91-96.
doi: 10.1016/j.jclepro.2014.11.075
|
|
|
| [38] |
Sinclair T R, Tanner C B, Bennett J M. 1984. Water-use efficiency in crop production. Bioscience, 34(1): 36-40.
doi: 10.2307/1309424
|
|
|
| [39] |
Sun S K, Wu P T, Wang Y B, et al. 2013a. The impacts of interannual climate variability and agricultural inputs on water footprint of crop production in an irrigation district of China. Science of The Total Environment, 444(2): 498-507.
doi: 10.1016/j.scitotenv.2012.12.016
|
|
|
| [40] |
Sun S K, Wu P T, Wang Y B, et al. 2013b. Temporal variability of water footprint for maize production: the case of Beijing from 1978 to 2008. Water Resources Management, 27(7): 2447-2463.
doi: 10.1007/s11269-013-0296-1
|
|
|
| [41] |
Sun S K, Wang Y B, Liu J, et al. 2016. Quantification and evaluation of water footprint of major grain crops in China. Journal of Hydraulic Engineering, 47(9): 1115-1124. (in Chinese)
|
|
|
| [42] |
Tao J, Yang D G. 2004. Analysis on factors of Xinjiang grain increase production in recent 50 years with principal components method. Arid Land Geography, 27(1): 95-99. (in Chinese)
|
|
|
| [43] |
Tan M H, Zheng L Q. 2019. Increase in economic efficiency of water use caused by crop structure adjustment in arid areas. Journal of Environmental Management, 230: 386-391.
doi: 10.1016/j.jenvman.2018.09.060
pmid: 30296676
|
|
|
| [44] |
Tang H J, Li Z M. 2012. Study on per capita grain demand based on Chinese reasonable dietary pattern. Scientia Agricultura Sinica, 45(11): 2315-2327. (in Chinese)
doi: 10.3864/j.issn.0578-1752.2012.11.022
|
|
|
| [45] |
Wang F T, Yu C, Xiong L C, et al. 2019. How can agricultural water use efficiency be promoted in China? A spatial-temporal analysis. Resources, Conservation and Recycling, 145: 411-418.
doi: 10.1016/j.resconrec.2019.03.017
|
|
|
| [46] |
Wang X, Sheng T Y. 2011. Study on the wind energy resources in Boertala prefecture. Journal of Anhui Agricultural Sciences, 39(22): 13653-313655. (in Chinese)
|
|
|
| [47] |
Wu Y F, Bake B, Zhang J S, et al. 2015. Spatio-temporal patterns of drought in North Xinjiang, China, 1961-2012 based on meteorological drought index. Journal of Arid Land, 7(4): 527-543.
doi: 10.1007/s40333-015-0125-x
|
|
|
| [48] |
Xu C C, Chen Y N, Yang Y H, et al. 2010. Hydrology and water resources variation and its response to regional climate change in Xinjiang. Journal of Geographical Sciences, 20(4): 599-612.
doi: 10.1007/s11442-010-0599-6
|
|
|
| [49] |
Yang Q, Zhu R X, Zhang J, et al. 2000. Mechanization profit portion estimation in plant products industry in Shaanxi Province. Transactions of the Chinese Society of Agricultural Engineering, 16(6): 64-67. (in Chinese)
|
|
|
| [50] |
Yoo S H, Choi J Y, Lee S H, et al. 2014. Estimating water footprint of paddy rice in Korea. Paddy & Water Environment, 12(1): 43-54.
|
|
|
| [51] |
Zahra Z, Karami E, Keshavarz M. 2020. Co-production of knowledge and adaptation to water scarcity in developing countries. Journal of Environmental Management, 262: 110283, doi: 10.1016/j.jenvman.2020.110283.
doi: 10.1016/j.jenvman.2020.110283
pmid: 32090886
|
|
|
| [52] |
Zhao C F, Chen B, Hayat T, et al. 2014. Driving force analysis of water footprint change based on extended STIRPAT model: Evidence from the Chinese agricultural sector. Ecological Indicators, 47: 43-49.
doi: 10.1016/j.ecolind.2014.04.048
|
|
|
| [53] |
Zwart S J, Bastiaanssen W G M. 2004. Review of measured crop water productivity values for irrigated wheat, rice, cotton and maize. Agricultural Water Management, 69(2): 115-133.
doi: 10.1016/j.agwat.2004.04.007
|
|
|
|
Viewed |
|
|
|
Full text
|
|
|
|
|
Abstract
|
|
|
|
|
Cited |
|
|
|
|
| |
Shared |
|
|
|
|
| |
Discussed |
|
|
|
|