| Research article |
|

|
|
|
| Ice thickness distribution and volume estimation of Burqin Glacier No. 18 in the Chinese Altay Mountains |
JIN Shuang1,2, LI Zhongqin2,*( ), WANG Zemin1,*(), WANG Feiteng2, XU Chunhai2, AI Songtao1 ), WANG Zemin1,*(), WANG Feiteng2, XU Chunhai2, AI Songtao1 |
1Chinese Antarctic Center of Surveying and Mapping, Wuhan University, Wuhan 430079, China
2State Key Laboratory of Cryosphere Science/Tianshan Glaciological Station, Northwest Institute of Eco-Environment and Resources, Chinese Academy of Sciences, Lanzhou 730000, China |
|
|
|
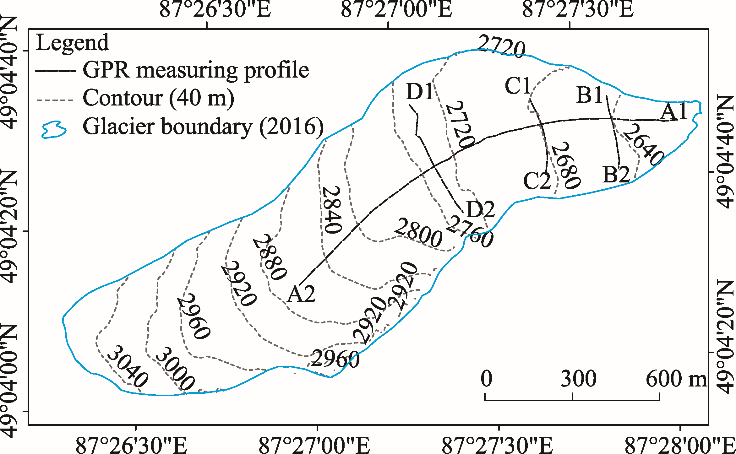
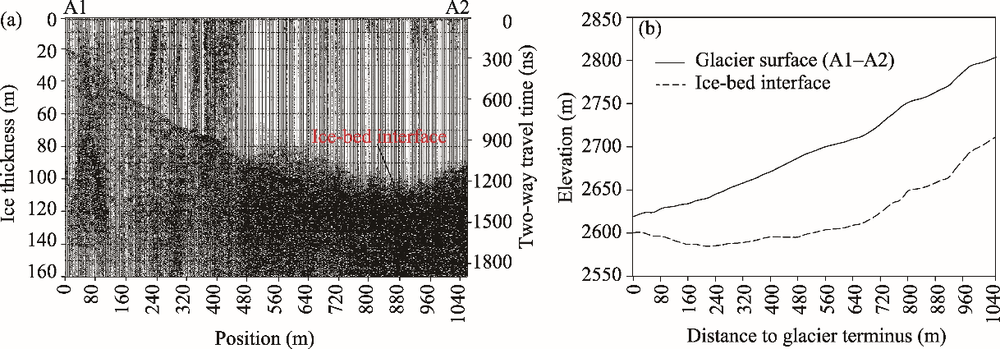
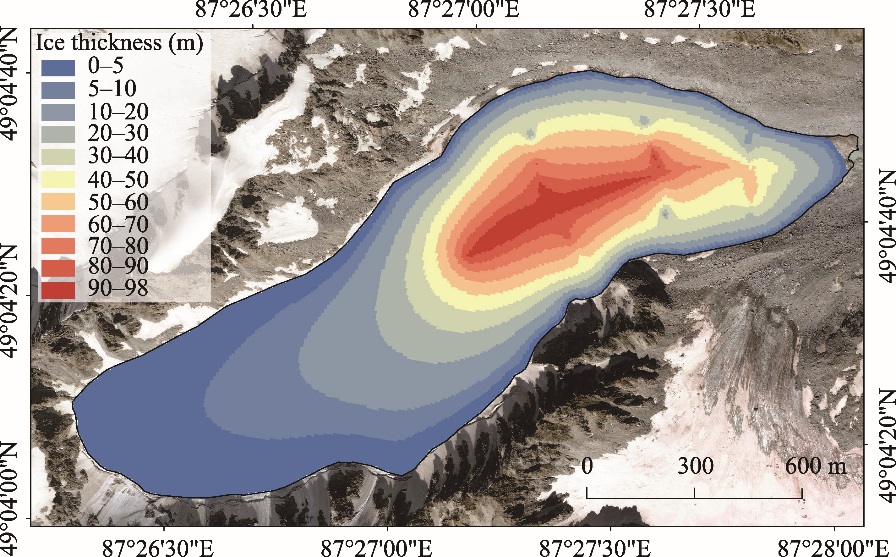
Abstract Information on the thickness distribution and volume of glacier ice is highly important for glaciological applications; however, detailed measurements of the ice thickness of many glaciers in the Chinese Altay Mountains remain lacking. Burqin Glacier No. 18 is a northeast-orientated cirque glacier located on the southern side of the Altay Mountains. This study used PulseEKKO® PRO 100A enhancement ground-penetrating radar (GPR) to survey the ice thickness and volume of Burqin Glacier No. 18 in summer 2018. Together with GPR surveying, spatial distributed profiles of the GPR measurements were concurrently surveyed using the real-time kinematic (RTK) global navigation satellite system (GNSS, Unistrong E650). Besides, we used QuickBird, WorldView-2, and Landsat TM to delineate accurate boundary of the glacier for undertaking estimation of glacier ice volume. GPR measurements revealed that the basal topography of profile B1-B2 was flat, the basal topography of profile C1-C2 presented a V-type form, and the basal topography of profile D1-D2 had a typical U-type topographic feature because the bedrock near the central elevation of the glacier was relatively flat. The longitudinal profile A1-A2 showed a ladder-like distribution. Glacier ice was thin at the terminus and its thickness increased gradually from the elevation of approximately 2620 m a.s.l. along the main axis of the glacier tongue with an average value of 80 (±1) m. The average ice thickness of the glacier was determined as 27 (±2) m and its total ice volume was estimated at 0.031 (±0.002) km3. Interpretation of remote sensing images indicated that during 1989-2016, the glacier area reduced from 1.30 to 1.17 km2 (reduction of 0.37%/a) and the glacier terminus retreated at the rate of 8.48 m/a. The mean ice thickness of Burqin Glacier No. 18 was less than that of the majority of other observed glaciers in China, especially those in the Qilian Mountains and Central Chinese Tianshan Mountains; this is probably attributable to differences in glacier type and climatic setting.
|
|
Received: 03 June 2020
Published: 10 November 2020
|
|
Corresponding Authors:
|
About author: *LI Zhongqin (E-mail: lizq@lzb.ac.cn);
|
|
|
| [1] |
Andreassen L M, Huss M, Melvold K, et al. 2015. Ice thickness measurements and volume estimates for glaciers in Norway. Journal of Glaciology, 61(228):763-775.
|
|
|
| [2] |
Annan A P, Waller W M, Strangway D W, et al. 1975. The electromagnetic response of a low-loss, 2-layer, dielectric earth for horizontal electric dipole excitation. Geophysics, 40(2):285-298.
|
|
|
| [3] |
Binder D, Brückl E, Roch K H, et al. 2009. Determination of total ice volume and ice-thickness distribution of two glaciers in the Hohe Tauern region, Eastern Alps, from GPR data. Annals of Glaciology, 50(51):71-79.
|
|
|
| [4] |
Cuffey K M, Paterson W S B. 2010. The Physics of Glaciers (Fourth Edition). Amsterdam: Academic Press, 469-475.
|
|
|
| [5] |
Farinotti D, Usselmann S, Huss M, et al. 2012. Runoff evolution in the Swiss Alps: projections for selected high-alpine catchments based on ENSEMBLES scenarios. Hydrological Processes, 26(13):1909-1924.
doi: 10.1002/hyp.v26.13
|
|
|
| [6] |
Farinotti D, Huss M, Fürst J J, et al. 2019. A consensus estimate for the ice thickness distribution of all glaciers on Earth. Nature Geoscience, 12(3):168-173.
|
|
|
| [7] |
Fischer A. 2009. Calculation of glacier volume from sparse ice-thickness data, applied to Schaufelferner, Austria. Journal of Glaciology, 55(191):453-460.
|
|
|
| [8] |
Fischer A, Kuhn M. 2013. Ground-penetrating radar measurements of 64 Austrian glaciers between 1995 and 2010. Annals of Glaciology, 54(64):179-188.
|
|
|
| [9] |
Gabbi J, Farinotti D, Bauder A, et al. 2012. Ice volume distribution and implications on runoff projections in a glacierized catchment. Hydrology and Earth System Sciences, 16(12):4543-4556.
|
|
|
| [10] |
GlaThiDa Consortium. 2019. Glacier Thickness Database 3.0.1. World Glacier Monitoring Service, Zurich, Switzerland. [2019-03-12]. https://doi.org/10.5904/wgms-glathida-2019-03.
|
|
|
| [11] |
Glen J W, Paren J G. 1975. The electrical properties of snow and ice. Journal of Glaciology, 15(73):15-38.
|
|
|
| [12] |
Guo W Q, Liu S Y, Xu J L, et al. 2015. The second Chinese glacier inventory: data, methods and results. Journal of Glaciology, 61(226):357-372.
|
|
|
| [13] |
He M B, Sun B, Yang Y, et al. 2004. Ice thickness determination and analysis of no. 1 glacier at the source of Urumqi River, Tianshan by ground penetrating radar. Journal of East China Institute of Technology, 27(3):235-339. (in Chinese)
|
|
|
| [14] |
Huai B J, Li Z Q, Wang F T, et al. 2015. Glacier volume estimation from ice-thickness data, applied to the Muz Taw glacier, Sawir Mountains, China. Environmental Earth Sciences, 74(3):1861-1870.
|
|
|
| [15] |
Huss M, Farinotti D. 2012. Distributed ice thickness and volume of all glaciers around the globe. Journal of Geophysical Research: Earth Surface, 117(F04010), https://doi.org/10.1029/2012JF002523.
|
|
|
| [16] |
Jin S Q, Tian L D. 2019. Depth sounded by GPR and volume estimated of the Gani Glacier in Ngari Prefecture, Tibet. Journal of Glaciology and Geocryology, 41(3):516-524. (in Chinese)
|
|
|
| [17] |
Kutuzov S, Thompson L G, Lavrentiev I, et al. 2018. Ice thickness measurements of Guliya ice cap, western Kunlun Mountains (Tibetan Plateau), China. Journal of Glaciology, 64(248):977-989.
|
|
|
| [18] |
Langhammer L, Rabenstein L, Schmid L, et al. 2019. Glacier bed surveying with helicopter-borne dual-polarization ground-penetrating radar. Journal of Glaciology, 65(249):123-135.
|
|
|
| [19] |
Li H L, Felix N, Li Z Q, et al. 2012. An extended "perfect-plasticity" method for estimating ice thickness along the flow line of mountain glaciers. Journal of Geophysical Research: Earth Surface, 117(F01020), https://doi.org/10.1029/2011JF002104.
|
|
|
| [20] |
Li Y N, Li Z, Wang N L. 2018. Ice thickness sounded by ground penetrating radar on the Meikuang Glacier in the Eastern Kunlun Mountains. Journal of Glaciology and Geocryology, 40(1):38-46. (in Chinese)
|
|
|
| [21] |
Ma L L, Tian L D, Yang W, et al. 2008. Measuring the depth of Gurenhekou glacier in the south of the Tibetan plateau using GPR and estimating its volume based on the outcomes. Journal of Glaciology and Geocryology, 30(5):783-788. (in Chinese)
|
|
|
| [22] |
Ma L L, Tian L D, Pu J C, et al. 2010. Recent area and ice volume change of Kangwure Glacier in the middle of Himalayas. Chinese Science Bulletin, 55(20):2088-2096.
|
|
|
| [23] |
Meier M F, Dyurgerov M B, Rick U K, et al. 2007. Glaciers dominate eustatic sea-level rise in the 21st century. Science, 317(5841):1064-1067.
doi: 10.1126/science.1143906
pmid: 17641167
|
|
|
| [24] |
Narod B B, Clarke G K C. 1994. Miniature high-power impulse transmitter for radio-echo sounding. Journal of Glaciology, 40(134):190-194.
|
|
|
| [25] |
Nye J F. 1951. The flow of glaciers and ice-sheets as a problem in plasticity. Proceedings of the Royal Society of London Series A, 207(1091):554-572.
|
|
|
| [26] |
Paul F, Kääb A, Maisch M, et al. 2004. Rapid disintegration of Alpine glaciers observed with satellite data. Geophysical Research Letters, 31(21):510-518.
|
|
|
| [27] |
Pfeffer W T, Arendt A A, Bliss A, et al. 2014. The Randolph Glacier Inventory: a globally complete inventory of glaciers. Journal of Glaciology, 60(221):537-552.
|
|
|
| [28] |
Pieczonka T, Bolch T, Kröhnert M, et al. 2018. Glacier branch lines and glacier ice thickness estimation for debris-covered glaciers in the Central Tien Shan. Journal of Glaciology, 64(247):835-849.
|
|
|
| [29] |
Rabus B, Eineder M, Roth A, et al. 2003. The shuttle radar topography mission—a new class of digital elevation models acquired by spaceborne radar. ISPRS Journal of Photogrammetry and Remote Sensing, 57(4):241-262.
|
|
|
| [30] |
RGI Consortium. 2017. Randolph glacier inventory—a dataset of global glacier outlines: Version 6.0: technical report, global land ice measurements from space. Colorado, USA. Digital Media. https://doi.org/10.7265.
|
|
|
| [31] |
Robin G Q. 1975. Velocity of radio waves in ice by means of a bore-hole interferometric technique. Journal of Glaciology, 15(73):151-159.
|
|
|
| [32] |
Sakai A. 2019. Brief communication: Updated GAMDAM glacier inventory over high-mountain Asia. The Cryosphere, 13(7):2043-2049.
|
|
|
| [33] |
Schlosser E. 1997. Numerical simulation of fluctuations of Hintereisferner, Ötztal Alps, since AD 1850. Annals of Glaciology, 24:199-202.
|
|
|
| [34] |
Shi Y F, Liu S Y, Ye B S, et al. 2008. Concise Glacier Inventory of China. Shanghai: Shanghai Popular Science Press, 22-31. (in Chinese)
|
|
|
| [35] |
Sun B, He M B, Zhang P, et al. 2003. Determination of ice thickness, subice topography and ice volume at Glacier No. 1 in the Tianshan, China, by ground penetrating radar. Chinese Journal of Polar Research, 15(1):35-44. (in Chinese)
|
|
|
| [36] |
Sun M P, Liu S Y, Yao X J, et al. 2018. Glacier changes in the Qilian Mountains in the past half-century: Based on the revised First and Second Chinese Glacier Inventory. Journal of Geographical Sciences, 28(2):206-220.
|
|
|
| [37] |
Wang N L, Pu J C. 2009. Ice thickness, sounded by ground penetrating radar, on the Bayi Glacier in the Qilian Mountains, China. Journal of Glaciology and Geocryology, 31(3):431-435. (in Chinese)
|
|
|
| [38] |
Wang P Y, Li Z Q, Wang W B, et al. 2014a. Glacier volume calculation from ice-thickness data for mountain glaciers—A case study of glacier No. 4 of Sigong River over Mt. Bogda, eastern Tianshan, Central Asia. Journal of Earth Science, 25(2):371-378.
|
|
|
| [39] |
Wang P Y, Li Z Q, Jin S, et al. 2014b. Ice thickness, volume and subglacial topography of Urumqi Glacier No. 1, Tianshan Mountains, central Asia, by ground penetrating radar survey. Journal of Earth System Science, 123(3):581-591.
|
|
|
| [40] |
Wang P Y, Li Z Q, Zhou P, et al. 2015. Recent changes of two selected glaciers in Hami Prefecture of eastern Xinjiang and their impact on water resources. Quaternary International, 358:146-152.
|
|
|
| [41] |
Wang P Y, Li Z Q, Li H L, et al. 2016a. Recent Evolution in extent, thickness, and velocity of Haxilegen Glacier No. 51, Kuytun River Basin, Eastern Tianshan Mountains. Arctic, Antarctic, and Alpine Research, 48(2):241-252.
|
|
|
| [42] |
Wang P Y, Li Z Q, Li H L, et al. 2016b. Analyses of recent observations of Urumqi Glacier No. 1, Chinese Tianshan Mountains. Environmental Earth Sciences, 75(8):1-11.
|
|
|
| [43] |
Wang P Y, Li Z Q, Li H L, et al. 2017. Characteristics of a partially debris-covered glacier and its response to atmospheric warming in Mt. Tomor, Tien Shan, China. Global and Planetary Change, 159:11-24.
|
|
|
| [44] |
Xing W C, Li Z Q, Zhang H, et al. 2017. Spatial-temporal variation of glacier resources in Chinese Tianshan Mountains since 1959. Acta Geographica Sinica, 72(9):1594-1605. (in Chinese)
|
|
|
| [45] |
Xu C H, Li Z Q, Wang F T, et al. 2017. Using an ultra-long-range terrestrial laser scanner to monitor the net mass balance of Urumqi Glacier No. 1, eastern Tien Shan, China, at the monthly scale. Journal of Glaciology, 63(241):792-802.
|
|
|
| [46] |
Yao X J, Liu S Y, Guo W Q, et al. 2012. Glacier change of Altay Mountain in China from 1960 to 2009—Based on the Second Glacier Inventory of China. Journal of Nature Resources, 17(10):1734-1745. (in Chinese)
|
|
|
| [47] |
Zhang Y, Enomoto H, Ohata T, et al. 2016. Projections of glacier change in the Altai Mountains under twenty-first century climate scenarios. Climate Dynamics, 47(9-10):2935-2953.
|
|
|
| [48] |
Zhu D Y, Tian L D, Wang J L, et al. 2014a. The Qiangtang Glacier No. 1 in the middle of the Tibetan Plateau: Depth sounded by using GPR and volume estimated. Journal of Glaciology and Geocryology, 36(2):278-285. (in Chinese)
|
|
|
| [49] |
Zhu M L, Yao T D, Yang W, et al. 2014b. Ice volume and characteristics of sub-glacial topography of the Zhadang Glacier, Nyainqêntanglha Range. Journal of Glaciology and Geocryology, 36(2):268-277. (in Chinese)
|
|
|
|
Viewed |
|
|
|
Full text
|
|
|
|
|
Abstract
|
|
|
|
|
Cited |
|
|
|
|
| |
Shared |
|
|
|
|
| |
Discussed |
|
|
|
|