| Research article |
|

|
|
|
| Glacier variations and their response to climate change in an arid inland river basin of Northwest China |
ZHOU Zuhao1, HAN Ning1,2,*( ), LIU Jiajia1, YAN Ziqi1, XU Chongyu3, CAI Jingya1, SHANG Yizi1, ZHU Jiasong4 ), LIU Jiajia1, YAN Ziqi1, XU Chongyu3, CAI Jingya1, SHANG Yizi1, ZHU Jiasong4 |
1 State Key Laboratory of Simulation and Regulation of Water Cycle in River Basin, China Institute of Water Resources and Hydropower Research, Beijing 100038, China
2 Beijing Branch, North China Municipal Engineering Design and Research Institute Co. Ltd., Beijing 100081, China
3 Department of Geosciences, University of Oslo, Oslo 0316, Norway
4 School of Civil Engineering, Shenzhen University, Shenzhen 518000, China |
|
|
|
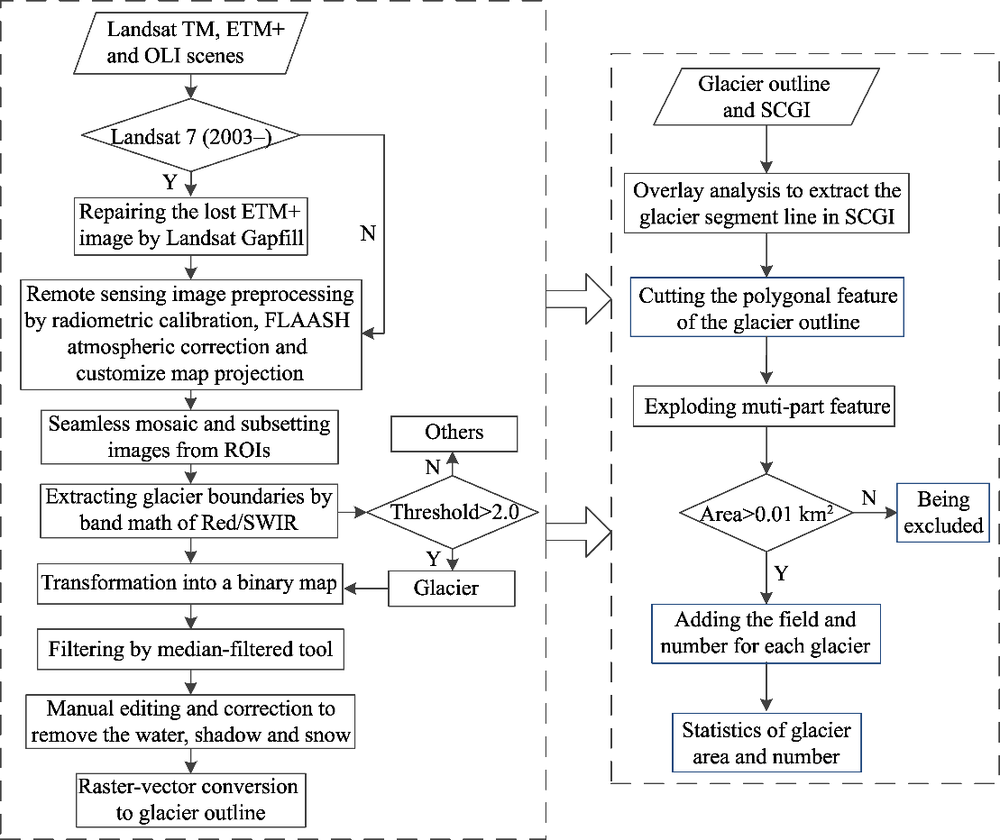
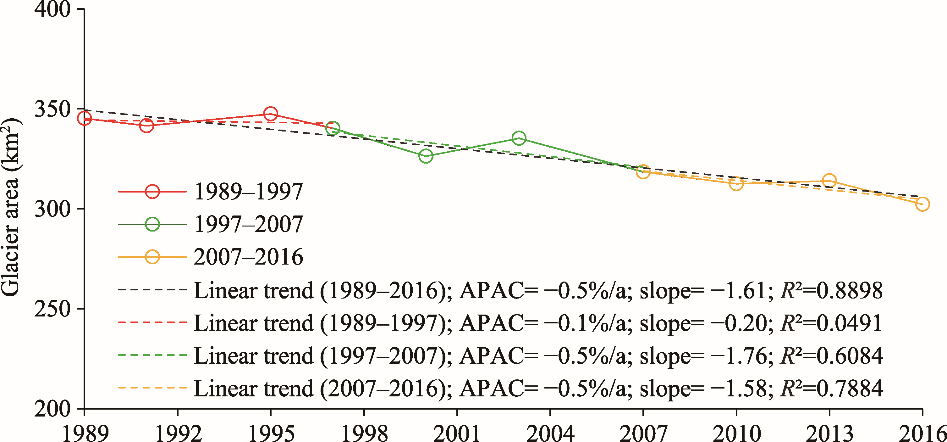
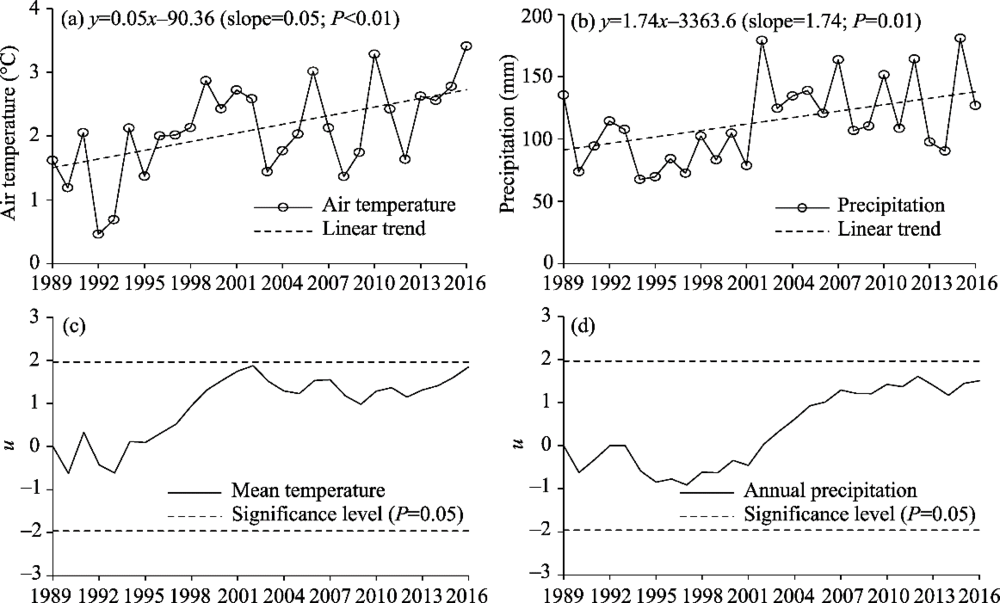
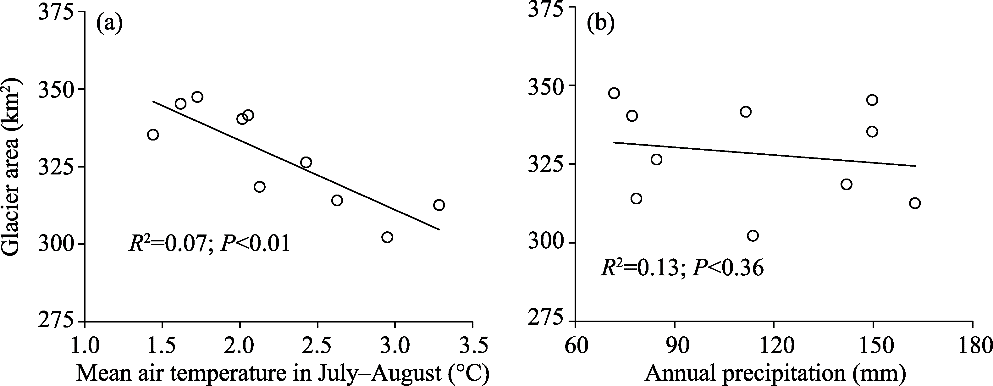
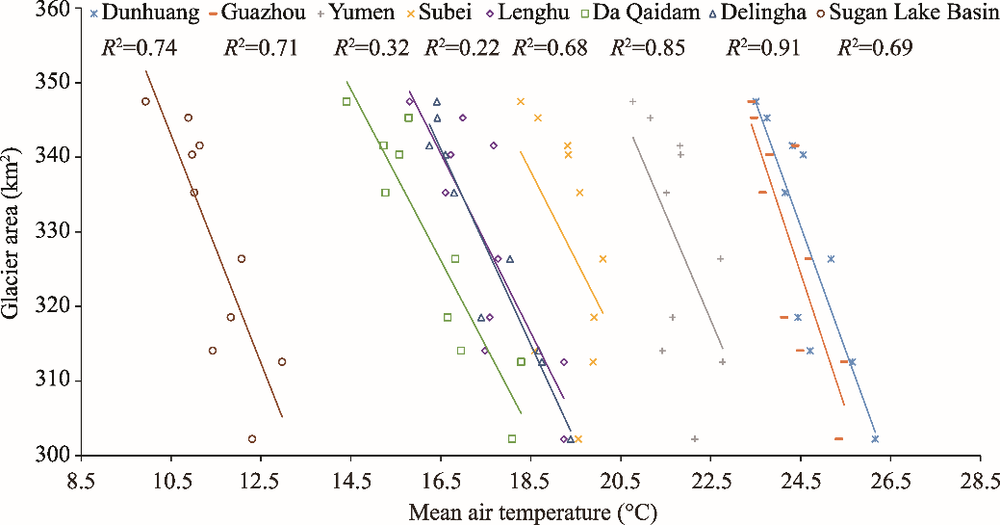
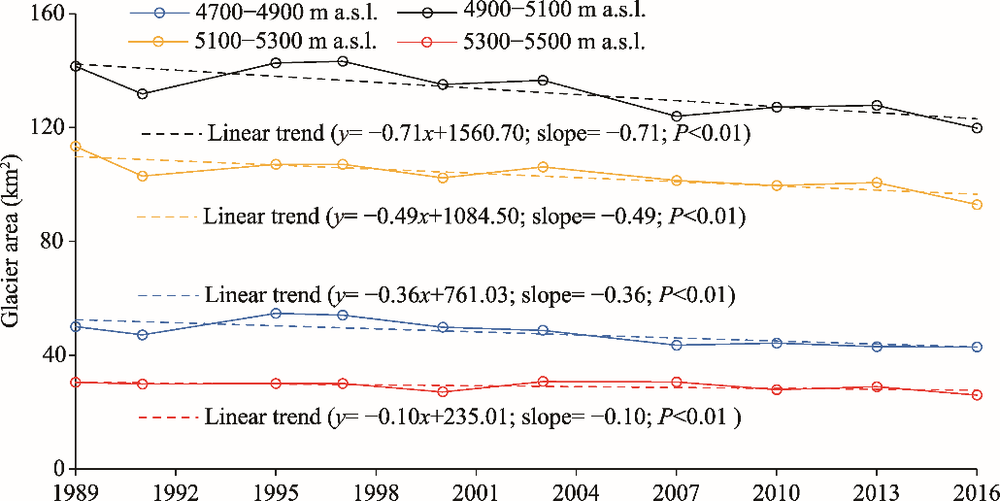
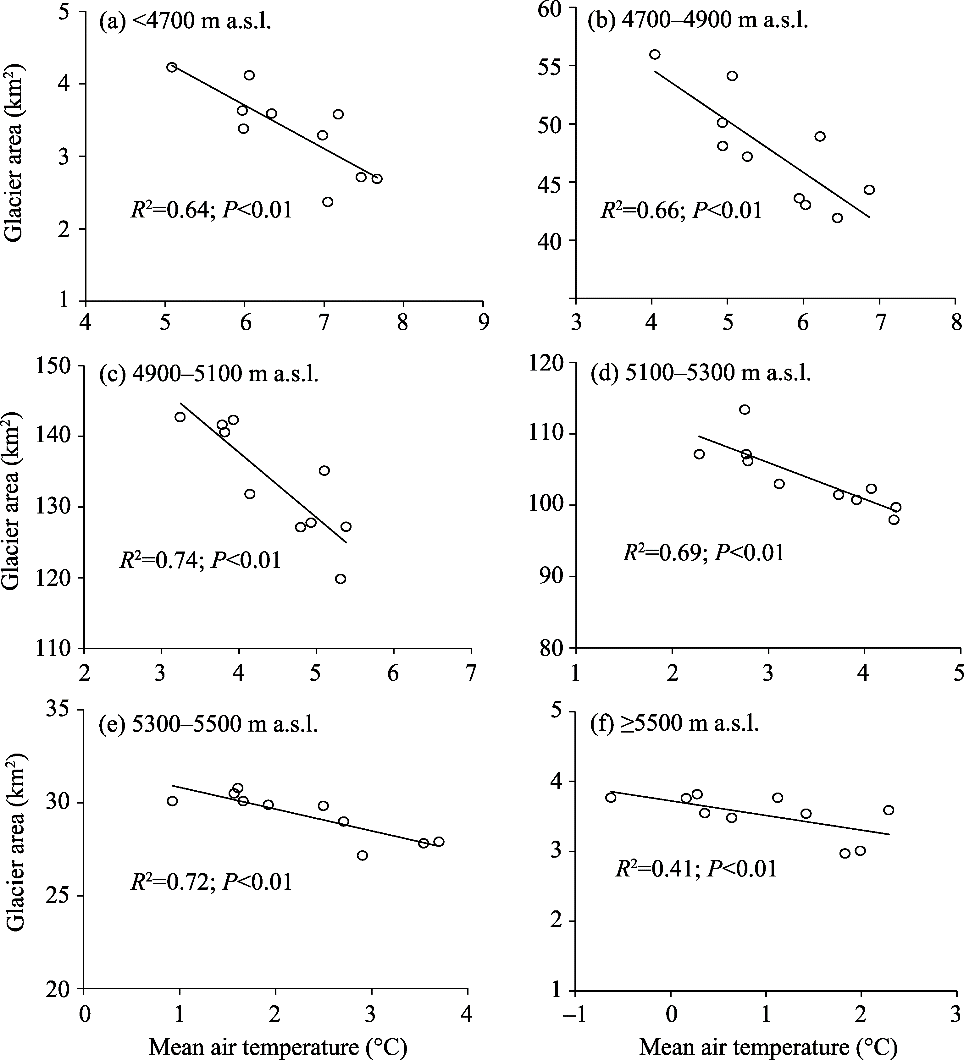
Abstract Glaciers are a critical freshwater resource of river recharge in arid areas around the world. In recent decades, glaciers have shown evidence of retreat due to climate change, and the accelerated ablation of glaciers and associated impacts on water resources have received widespread attention. Glacier variations result from climate change, so they can serve as an indicator of climate change. Considering the climatic differences in different elevation ranges, it is worthwhile to explore whether different responses exist between glacier area and air temperature in each elevation zone. In this study, we selected a typical arid inland river basin (Sugan Lake Basin) in the western Qilian Mountains of Northwest China to analyze the glacier variations and their response to climate change. The glacier area data from 1989 to 2016 were delineated using Landsat Thematic Mapper (TM), Enhanced TM+ (ETM+) and Operational Land Imager (OLI) images. We compared the relationships between glacier area and air temperature at seven meteorological stations in the glacier-covered areas and in the Sugan Lake Basin, and further analyzed the relationship between glacier area and mean air temperature of the glacier surfaces in July-August in the elevation range of 4700-5500 m a.s.l. by the linear regression method and correlation analysis. In addition, based on the linear regression relationship established between glacier area and air temperature in each elevation zone, we predicted glacier areas under future climate scenarios during the periods of 2046-2065 and 2081-2100. The results indicate that the glaciers experienced a remarkable shrinkage from 1989 to 2016 with a shrinkage rate of -1.61 km2/a (-0.5%/a), and the rising temperature is the decisive factor dominating glacial retreat; there is a significant negative linear correlation between glacier area and mean air temperature of the glacier surfaces in July-August in each elevation zone from 1989 to 2016. The variations in glaciers are far less sensitive to changes in precipitation than to changes in air temperature. Due to the influence of climate and topographic conditions, the distribution of glacier area and the rate of glacier ablation first increased and then decreased in different elevation zones. The trend in glacier shrinkage will continue because air temperature will continue to increase in the future, and the result of glacier retreat in each elevation zone will be slightly slower than that in the entire study area. Quantitative glacier research can more accurately reflect the response of glacier variations to climate change, and the regression relationship can be used to predict the areas of glaciers under future climate scenarios. These conclusions can offer effective references for assessing glacier variations and their response to climate change in arid inland river basins in Northwest China as well as other similar regions in the world.
|
|
Received: 26 January 2019
Published: 10 May 2020
|
|
Corresponding Authors:
|
| About author: *Corresponding author: HAN Ning (E-mail: zhzh@iwhr.com) |
|
|
| [1] |
Andreassen L M, Paul F, Kääb A, et al.2008. Landsat-derived glacier inventory for Jotunheimen, Norway, and deduced glacier changes since the 1930s. The Cryosphere, 2(2): 131-145.
doi: 10.5194/tc-2-131-2008
|
|
|
| [2] |
Bayr K J, Hall D K, Kovalick W M, 1994. Observations on glaciers in the eastern Austrian Alps using satellite data. International Journal of Remote Sensing, 15(9): 1733-1742.
doi: 10.1080/01431169408954205
|
|
|
| [3] |
Bolch T, Yao T, Kang S, et al.2010a. A glacier inventory for the western Nyainqentanglha Range and the Nam Co Basin, Tibet, and glacier changes 1976-2009. The Cryosphere, 4(3): 419-433.
doi: 10.5194/tc-4-419-2010
|
|
|
| [4] |
Bolch T, Menouno B, Wheate R.2010b. Landsat-based inventory of glaciers in western Canada, 1985-2005. Remote Sensing of Environment, 114(1): 127-137.
doi: 10.1016/j.rse.2009.08.015
|
|
|
| [5] |
Bradley R S, Miller G H.1972. Recent climatic change and increased glacierization in the Eastern Canadian Arctic. Nature, 237: 385-387.
doi: 10.1038/237385a0
|
|
|
| [6] |
Burn D H, Elnur M A H.2002. Detection of hydrologic trends and variability. Journal of Hydrology, 255(1-4): 107-122.
doi: 10.1016/S0022-1694(01)00514-5
|
|
|
| [7] |
Cao B, Pan B T, Gao H S, et al.2010. Glacier variation in the Lenglongling range of eastern Qilian Mountains from 1972 to 2007. Journal of Glaciology and Geocryology, 32(2): 242-248. (in Chinese)
|
|
|
| [8] |
Casassa G, Smith K, Rivera A, et al.2002. Inventory of glaciers in Isla Riesco, Patagonia, Chile, based on aerial photography and satellite imagery. Annals of Glaciology, 34: 373-378.
doi: 10.3189/172756402781817671
|
|
|
| [9] |
Dowdeswell J A, Hagen J O, Björnsson H, et al.1997. The mass balance of circum-arctic glaciers and recent climate change. Quaternary Research, 48(1): 1-14.
doi: 10.1006/qres.1997.1900
|
|
|
| [10] |
Duan K Q, Yao T D, Wang N L, et al.2012. Numerical simulation of Urumqi Glacier No. 1 in the eastern Tianshan, Central Asia from 2005 to 2070. Chinese Science Bulletin, 57(36): 3511-3515.
|
|
|
| [11] |
Dwyer J L.1995. Mapping tide-water glacier dynamics in East Greenland using Landsat data. Journal of Glaciology, 41(139): 584-595.
|
|
|
| [12] |
Dyurgerov M.2001. Mountain glaciers at the end of the twentieth century: Global analysis in relation to climate and water cycle. Polar Geography, 25(4): 241-336.
|
|
|
| [13] |
Gan R, Luo Y, Zuo Q T, et al.2015. Effects of projected climate change on the glacier and runoff generation in the Naryn River Basin, Central Asia. Journal of Hydrology, 523: 240-251.
|
|
|
| [14] |
Guo W Q, Liu S Y, Yu P C, et al.2011. Automatic extraction of ridgelines using on drainage boundaries and aspect difference. Science of Surveying and Mapping, 36(6): 210-212. (in Chinese)
|
|
|
| [15] |
Hagg W, Braun L N, Kuhn M, et al.2007. Modelling of hydrological response to climate change in glacierized Central Asian catchments. Journal of Hydrology, 332(1-2): 40-53.
|
|
|
| [16] |
Hall D K, Riggs G A, Salomonson V V.1995. Development of methods for mapping global snow cover using moderate resolution imaging spectroradiometer data. Remote Sensing of Environment, 54(2): 127-140.
|
|
|
| [17] |
Hamed K H.2008. Trend detection in hydrologic data: The Mann-Kendall trend test under the scaling hypothesis. Journal of Hydrology, 349(3-4): 350-363.
|
|
|
| [18] |
Han H, Yang X H, Zhou J D.2018. A study of glacier information extraction methods based on multi-sensors remote sensing images in the Chongce Glacier area, West Kunlun Mountains. Journal of Glaciology and Geocryology, 40(5): 951-959. (in Chinese)
|
|
|
| [19] |
Horton P B, Schaefli A, Mezghani B, et al.2006. Assessment of climate-change impacts on alpine discharge regimes with climate model uncertainty. Hydrological Processes, 20(10): 2091-2109.
|
|
|
| [20] |
IPCC (Intergovernmental Panel on Climate Change). 2013. Climate Change 2013: Synthesis Report. In: Contribution of Working Group I to the Fifth Assessment Report of the Intergovernmental Panel on Climate Change. Geneva, Switzerland.
|
|
|
| [21] |
Jacobs J D, Alvin S.1997. Recession of the southern part of Barnes Ice Cap, Baffin Island, Canada, between 1961 and 1993, determined from digital mapping of Landsat TM. Journal of Glaciology, 43(143): 98-102.
|
|
|
| [22] |
Jin Z Z, Qin X, Sun W J, et al.2019. Monthly variations of temperature gradient in glacierized and non-glacierized areas of the western Qilian Mountains. Journal of Glaciology and Geocryology, 41(2): 282-292. (in Chinese)
|
|
|
| [23] |
Kendall M G.1990. Rank correlation methods. British Journal of Psychology, 25(1): 86-91.
|
|
|
| [24] |
Kienholz C, Hock R, Arendt A A.2013. A new semi-automatic approach for dividing glacier complexes into individual glaciers. Journal of Glaciology, 59(217): 925-937.
|
|
|
| [25] |
Kite G W, Reid I A.1977. Volumetric change of the Athabasca Glacier over the last 100 years. Journal of Hydrology, 32(3-4): 279-294.
|
|
|
| [26] |
Liu S Y, Sun W X, Shen Y P, et al.2003. Glacier changes since the little ice age maximum in the western Qilian Shan, Northwest China, and consequences of glacier runoff for water supply. Journal of Glaciology, 49(164): 117-124.
doi: 10.3189/172756503781830926
|
|
|
| [27] |
Liu S Y, Yao X J, Guo W Q, et al.2015. The contemporary glaciers in China based on the second Chinese Glacier Inventory. Acta Geographica Sinica, 70(1): 3-16. (in Chinese)
doi: 10.11821/dlxb201501001
|
|
|
| [28] |
Liu Y, Liu Y C, Jiao K Q, et al.2019. Advances on water resources research in the upper reaches of Urumqi River since 1990. Journal of Glaciology and Geocryology, 41(4): 958-967. (in Chinese)
|
|
|
| [29] |
Liu Y G, Wang N L, Zhang J H, et al.2019. Climate change and its impacts on mountain glaciers during 1960-2017 in western China. Journal of Arid Land, 11(4): 537-550.
|
|
|
| [30] |
Ma Z Z, Wang Z Q, Gu Y L, et al.2015. Ecological vulnerability assessment of nature reserve in arid region of Northwest China: A case study of the Xihu Nature Reserve and the Suganhu Nature Reserve in Gansu. Journal of Desert Research, 35(1): 253-259. (in Chinese)
|
|
|
| [31] |
Mann H B.1945. Nonparametric tests against trend. Econometrica, 13(3): 245-259.
|
|
|
| [32] |
Mu J X, Li Z Q, Zhang H, et al.2018. The global glacierized area: Current situation and recent change, based on the Randolph Glacier Inventory (RGI 6.0) published in 2017. Journal of Glaciology and Geocryology, 40(2): 238-248. (in Chinese)
|
|
|
| [33] |
Naz B S, Frans C D, Clarke G K C, et al.2014. Modeling the effect of glacier recession on streamflow response using a coupled glacio-hydrological model. Hydrology and Earth System Sciences, 18(2): 787-802.
|
|
|
| [34] |
Nye J F.1960. The response of glaciers and ice-sheets to seasonal and climatic changes. Proceedings of the Royal Society A, 256: 559-584.
|
|
|
| [35] |
Pan B T, Zhang G L, Wang J, et al.2012. Glacier changes from 1966-2009 in the Gongga Mountains, on the south-eastern margin of the Qinghai-Tibetan Plateau and their climatic forcing. The Cryosphere, 6: 1087-1101.
|
|
|
| [36] |
Paul F.2002. Changes in glacier area in Tyrol, Austria, between 1969 and 1992 derived from Landsat 5 thematic mapper and Austrian glacier inventory data. International Journal of Remote Sensing, 23(4): 787-799.
|
|
|
| [37] |
Rabatel A, Francou B, Soruco A.et al.2013. Current state of glaciers in the tropical Andes: A multi-century perspective on glacier evolution and climate change. The Cryosphere, 7(1): 81-102.
|
|
|
| [38] |
Racoviteanu A E, Paul F, Raup B, et al.2009. Challenges and recommendations in mapping of glacier parameters from space: Results of the 2008 Global Land Ice Measurements from Space (GLIMS) workshop, Boulder, Colorado, USA. Annals of Glaciology, 50(53): 53-69.
|
|
|
| [39] |
Sakai A, Fujita K, Duan K, et al.2006. Five decades of shrinkage of July 1st glacier, Qilian Shan, China. Journal of Glaciology, 52(176): 11-16.
|
|
|
| [40] |
Shi Y F, Cui Z J, Zheng B X.1982. Discussion on the Ice Age in the Xixiabangma Mountain Peak: Scientific Expeditions Report of the Xixiabangma Mountain Peak. Beijing: Science Press, 155-176. (in Chinese)
|
|
|
| [41] |
Shi Y F.2000. Glaciers and Their Environments in China: The Present, Past and Future. Beijing: Science Press, 12-16. (in Chinese)
|
|
|
| [42] |
Shi Y F, Shen Y P, Li D L, et al.2003. Discussion on the present climate change from warm-day to warm-wet in Northwest China. Quaternary Sciences, 23(2): 152-164.
|
|
|
| [43] |
Shi Y F, Shen Y P, Kang E, et al.2007. Recent and future climate change in Northwest China. Climatic Change, 80: 379-393.
doi: 10.1007/s10584-006-9121-7
|
|
|
| [44] |
Sidjak R W.1999. Glacier mapping of the Illecillewaet icefield, British Columbia, Canada, using Landsat TM and digital elevation data. International Journal of Remote Sensing, 20(2): 273-284.
|
|
|
| [45] |
Singh P, Kumar N.1997. Impact assessment of climate change on the hydrological response of a snow and glacier melt runoff dominated Himalayan River. Journal of Hydrology, 193(1-4): 316-350.
|
|
|
| [46] |
Sorg A, Bolch T, Stoffel M, et al.2012. Climate change impacts on glaciers and runoff in Tien Shan (Central Asia). Nature Climate Change, 2: 725-731.
|
|
|
| [47] |
Stahl K, Moore R D, Shea J M, et al.2008. Coupled modelling of glacier and streamflow response to future climate scenarios. Water Resources Research, 44(2): 1-13.
|
|
|
| [48] |
Sun M P, Li Z Q, Yao X J, et al.2013. Rapid shrinkage and hydrological response of a typical continental glacier in the arid region of Northwest China: Taking Urumqi Glacier No.1 as an example. Ecohydrology, 6(6): 909-916.
|
|
|
| [49] |
Sun M P, Liu S Y, Yao X J, et al.2018. Glacier changes in the Qilian Mountains in the past half-century: Based on the revised First and Second Chinese Glacier Inventory. Journal of Geographical Sciences, 28(2): 206-220.
|
|
|
| [50] |
Tian H Z, Yang T B, Liu Q P.2014. Climate change and glacier area shrinkage in the Qilian Mountains, China, from 1956 to 2010. Annals of Glaciology, 55(66): 187-197.
|
|
|
| [51] |
Wang J, Qin X, Li Z L, et al.2017. Glaciers change detection from 2004 to 2015 in the Daxueshan, Qilian MTS. Remote Sensing Technology and Application, 32(3): 490-498. (in Chinese)
|
|
|
| [52] |
Wang S, Yao T D, Tian L D, et al.2017. Glacier mass variation and its effect on surface runoff in the Beida River catchment during 1957-2013. Journal of Glaciology, 63(239): 523-534.
|
|
|
| [53] |
Yao T D, Li Z G, Yang W, et al.2010. Glacial distribution and mass balance in the Yarlung Zangbo River and its influence on lakes. Chinese Science Bulletin, 55: 2072-2078.
|
|
|
| [54] |
Zhou Z H, Han N, Cai J Y, et al.2017. Variation characteristics of glaciers and their response to climate change in the Qilian Mountains: Take the Suganhu Basin as an example. Journal of Glaciology and Geocryology, 39(6): 1172-1179. (in Chinese)
|
|
|
| [55] |
Zhu G F, Qin D H, Ren J W, et al.2017. Assessment of perception and adaptation to climate-related glacier changes in the arid rivers basin in northwestern China. Theoretical and Applied Climatology, 133: 243-252.
|
|
|
|
Viewed |
|
|
|
Full text
|
|
|
|
|
Abstract
|
|
|
|
|
Cited |
|
|
|
|
| |
Shared |
|
|
|
|
| |
Discussed |
|
|
|
|