| Research article |
|

|
|
|
| Glacier area change and its impact on runoff in the Manas River Basin, Northwest China from 2000 to 2020 |
WANG Tongxia1,2, CHEN Fulong1,2,*( ), LONG Aihua1,3, ZHANG Zhengyong4, HE Chaofei1, LYU Tingbo1, LIU Bo1, HUANG Yanhao1 ), LONG Aihua1,3, ZHANG Zhengyong4, HE Chaofei1, LYU Tingbo1, LIU Bo1, HUANG Yanhao1 |
1College of Water Conservancy & Architectural Engineering, Shihezi University, Shihezi 832000, China
2Key Laboratory of Cold and Arid Regions Eco-Hydraulic Engineering of Xinjiang Production & Construction Corps, Shihezi 832000, China
3State Key Laboratory of Simulation and Regulation of Water Cycle in River Basin, China Institute of Water Resources and Hydropower Research, Beijing 100038, China
4College of Sciences, Shihezi University, Shihezi 832000, China |
|
|
|
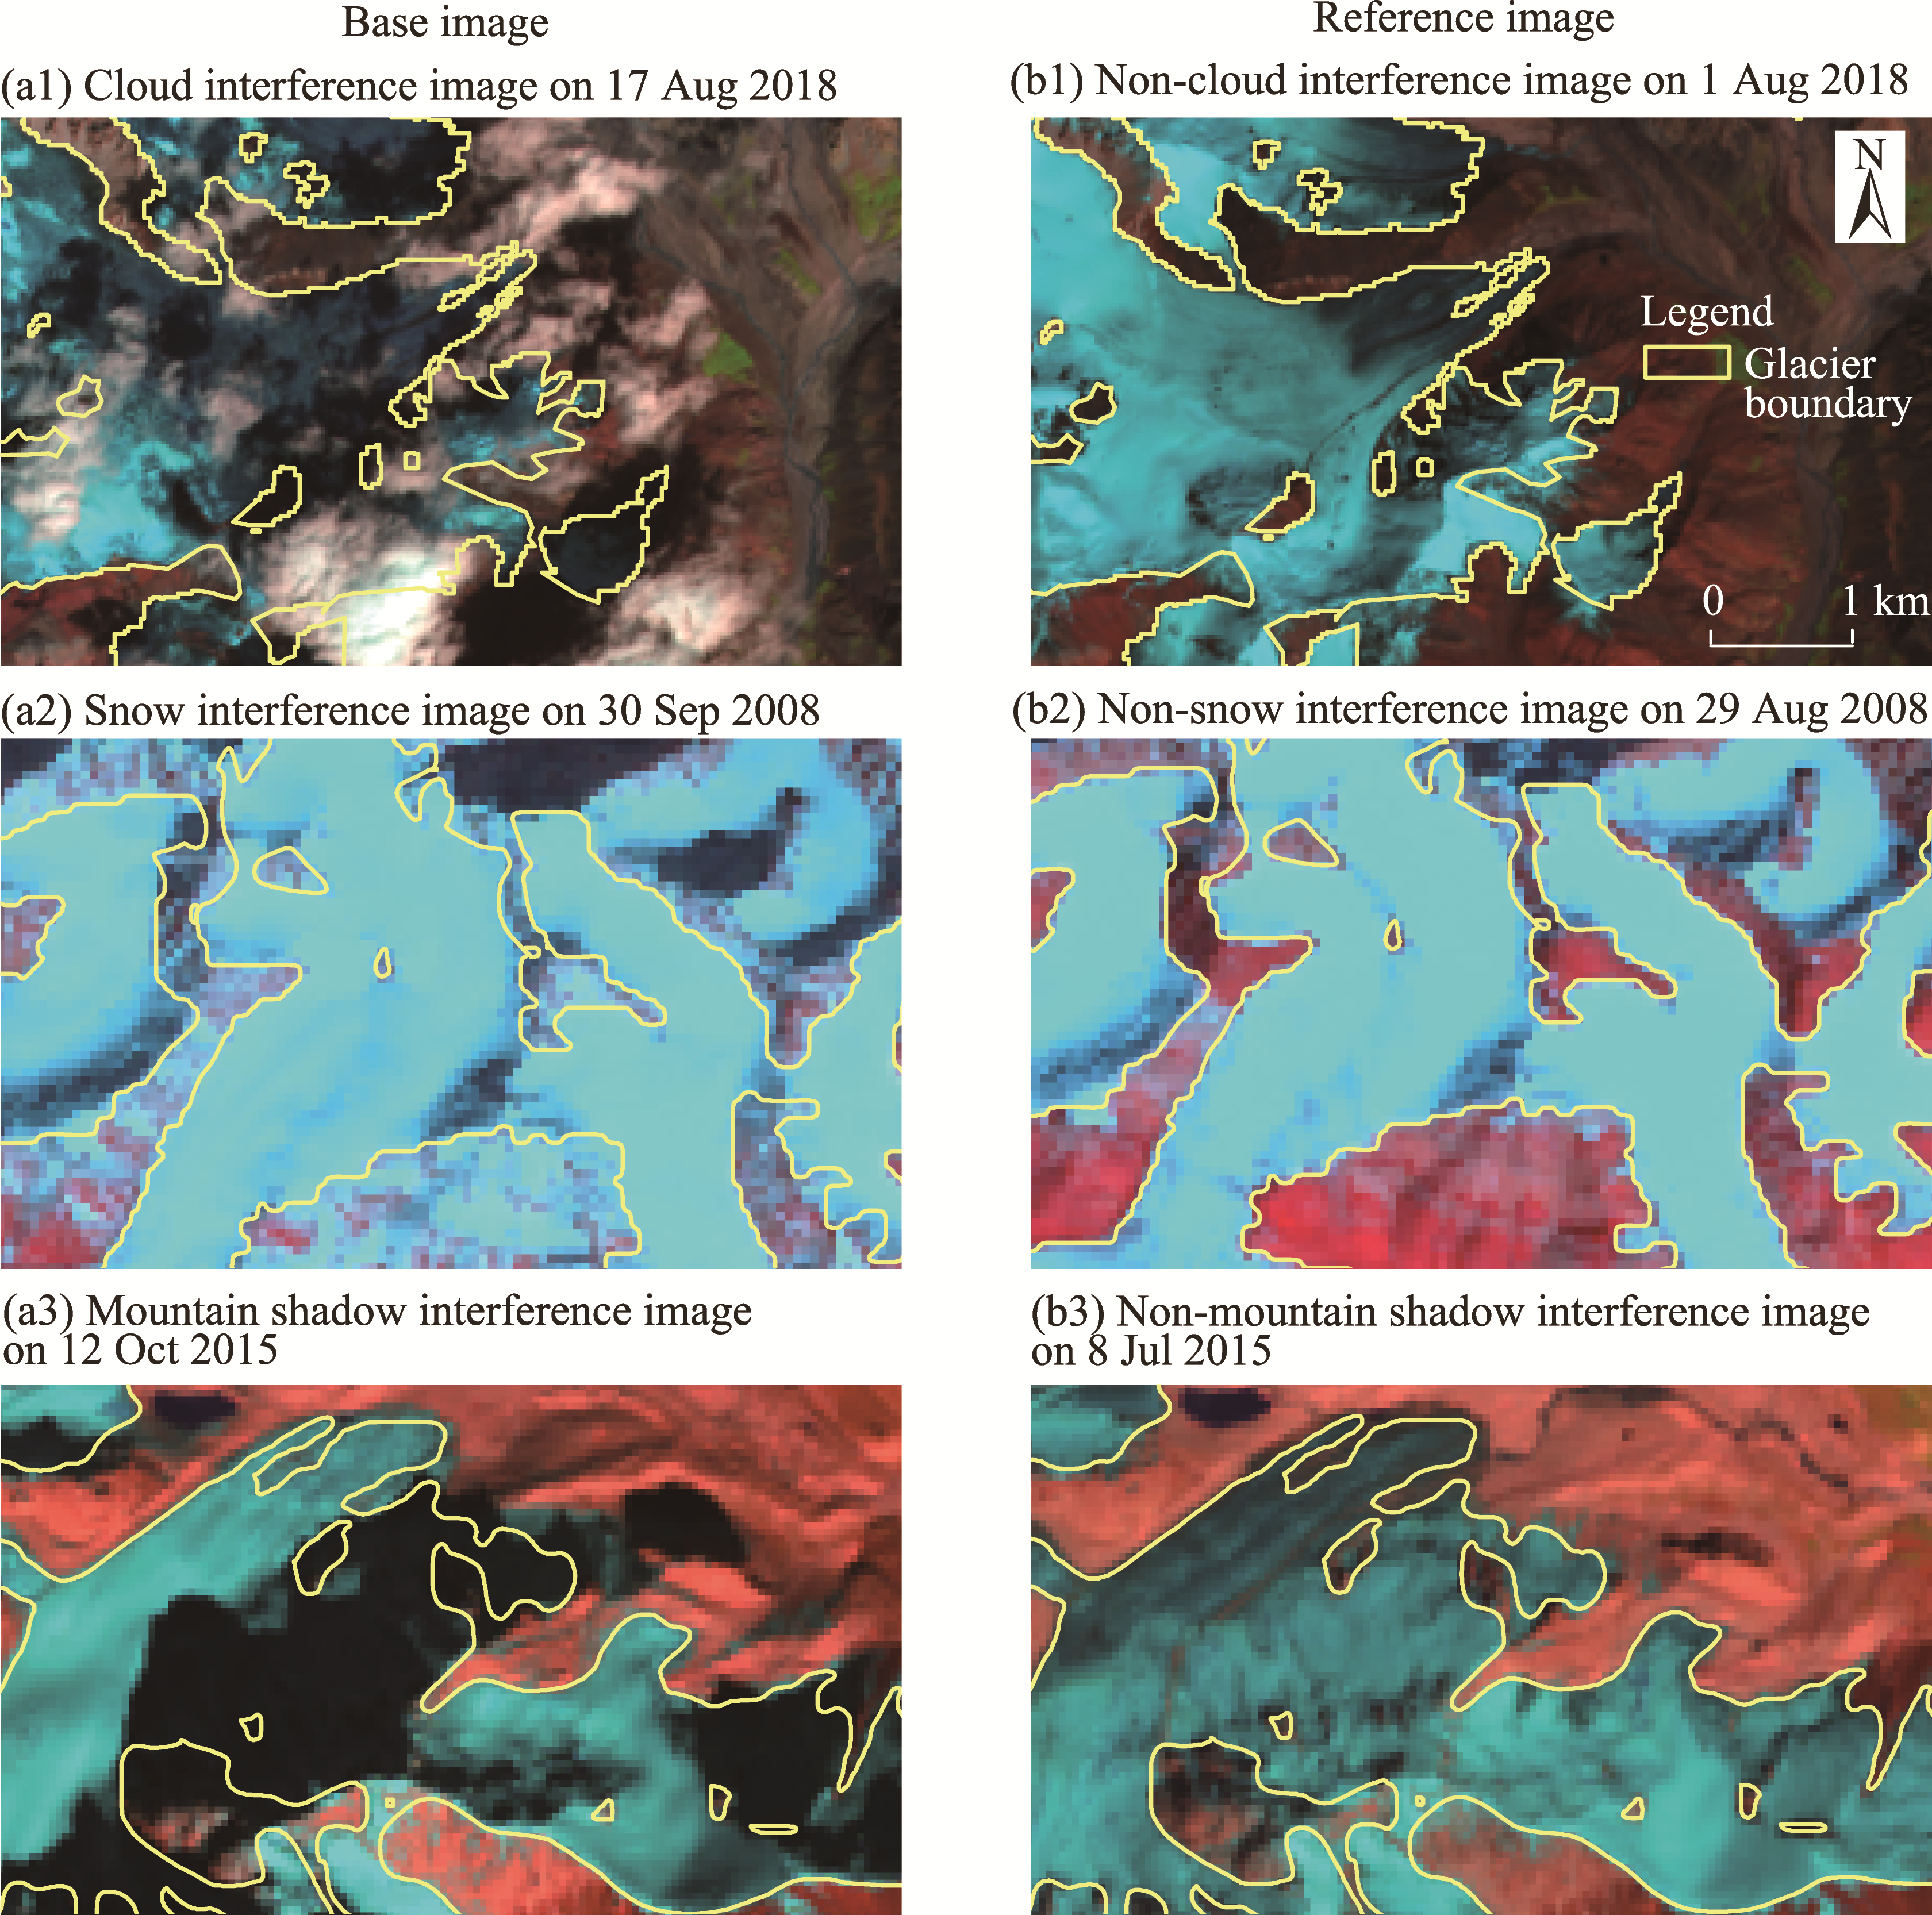
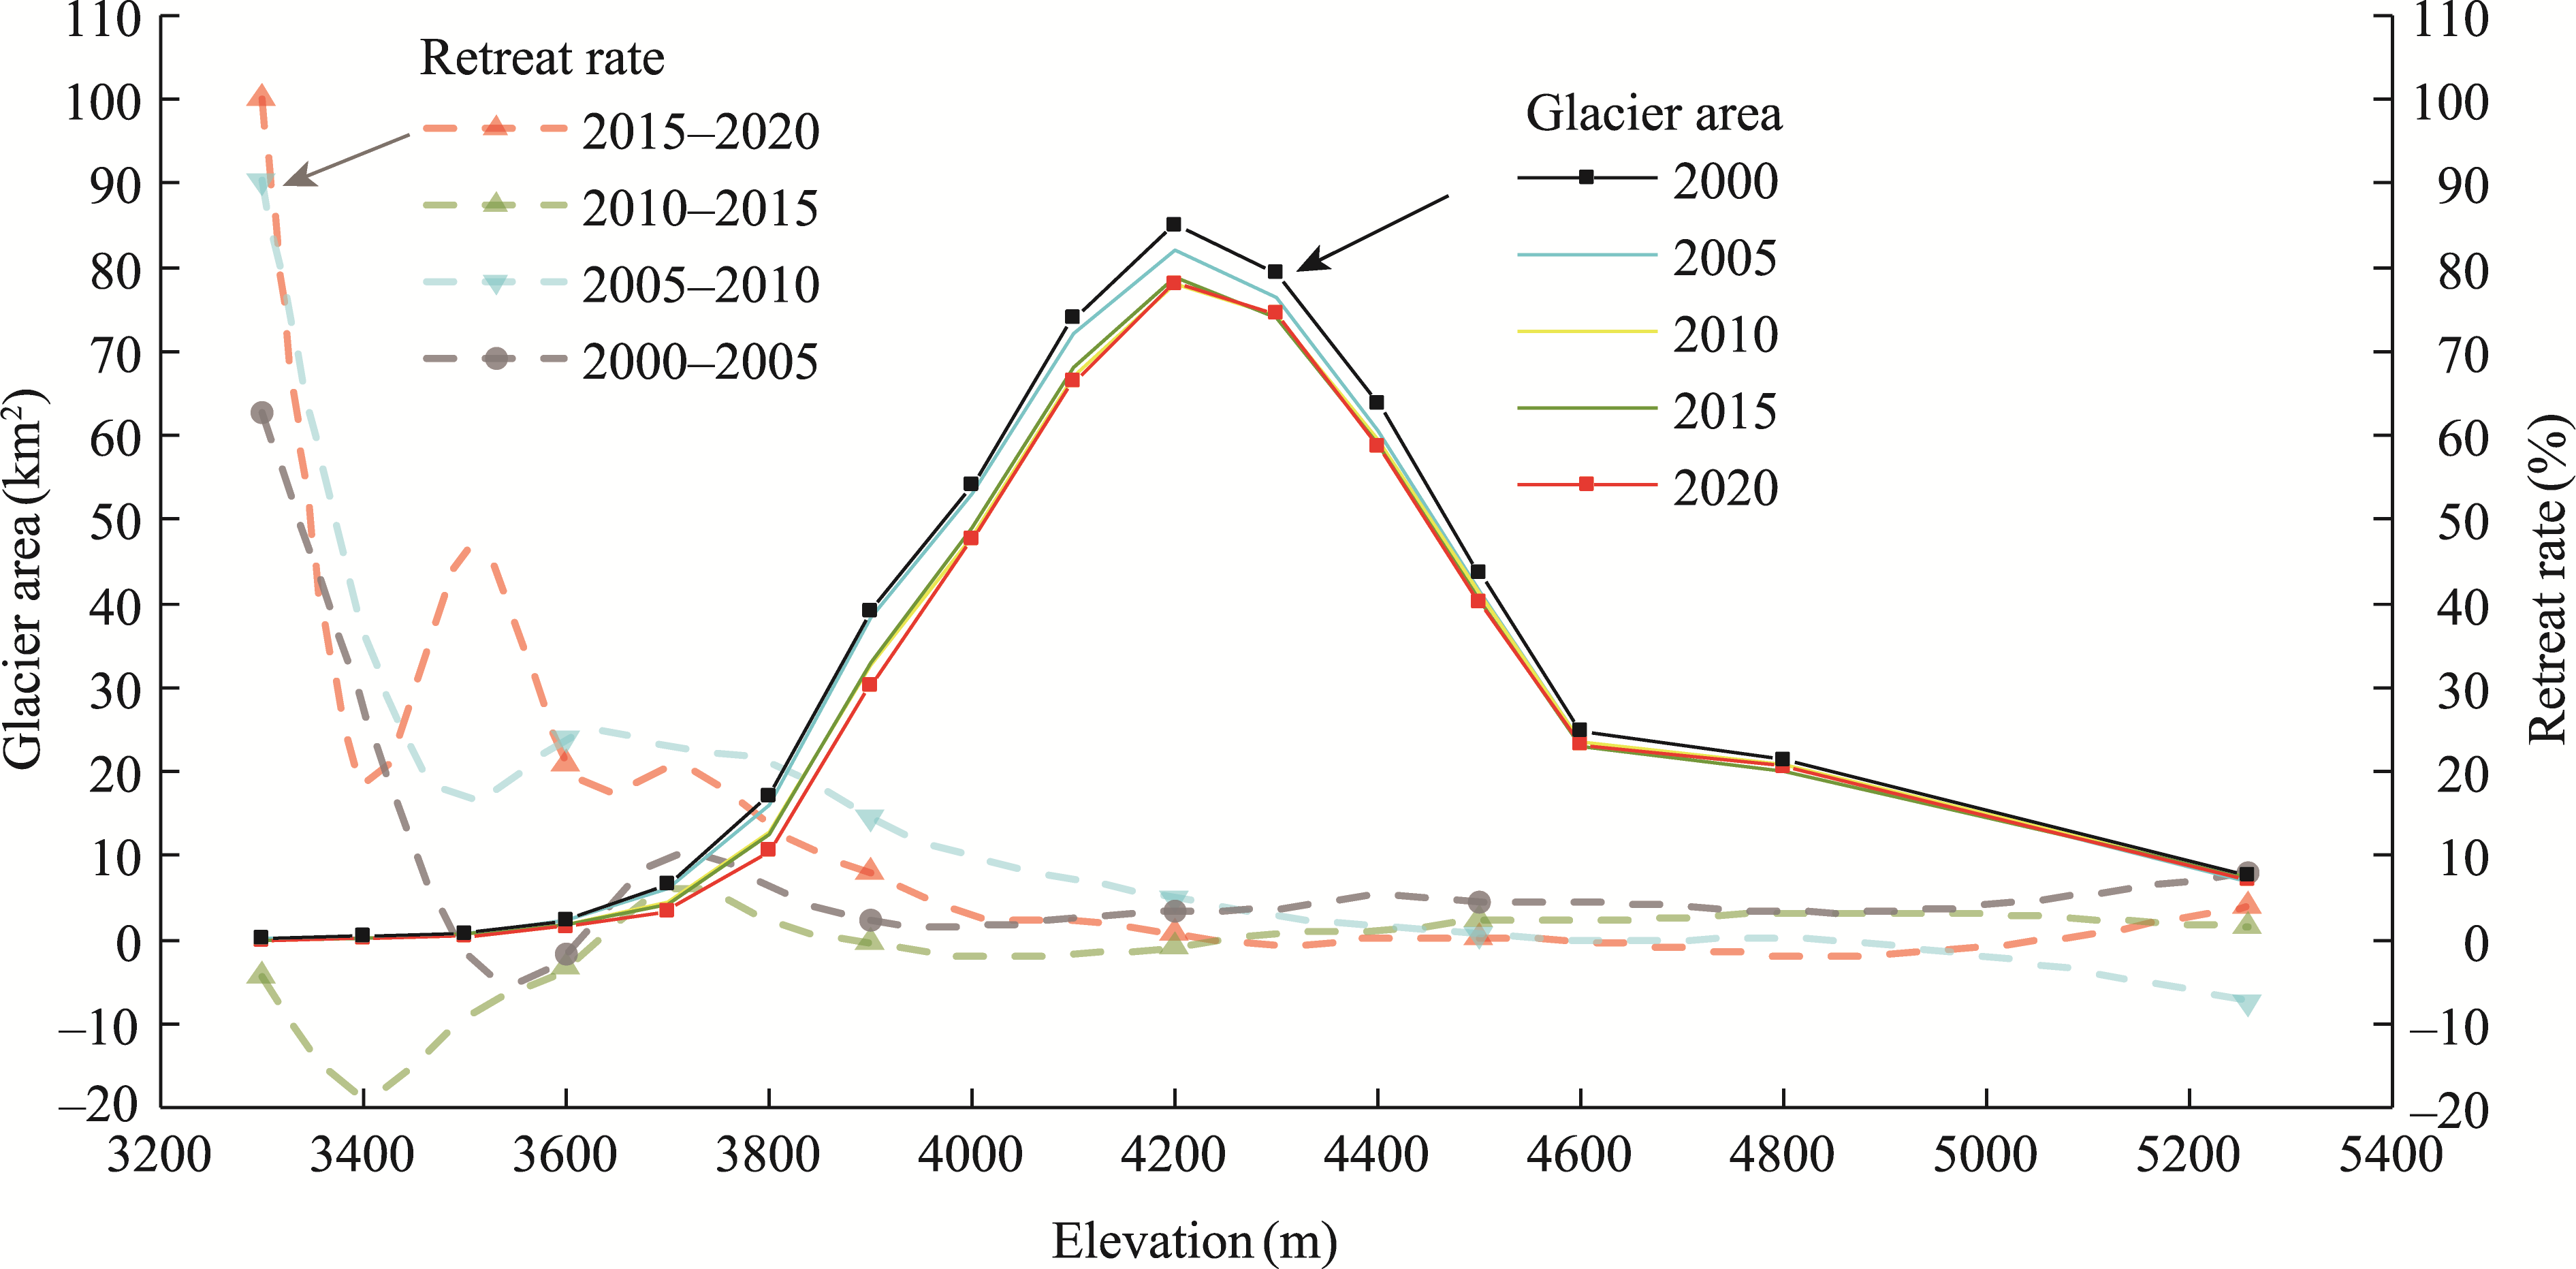
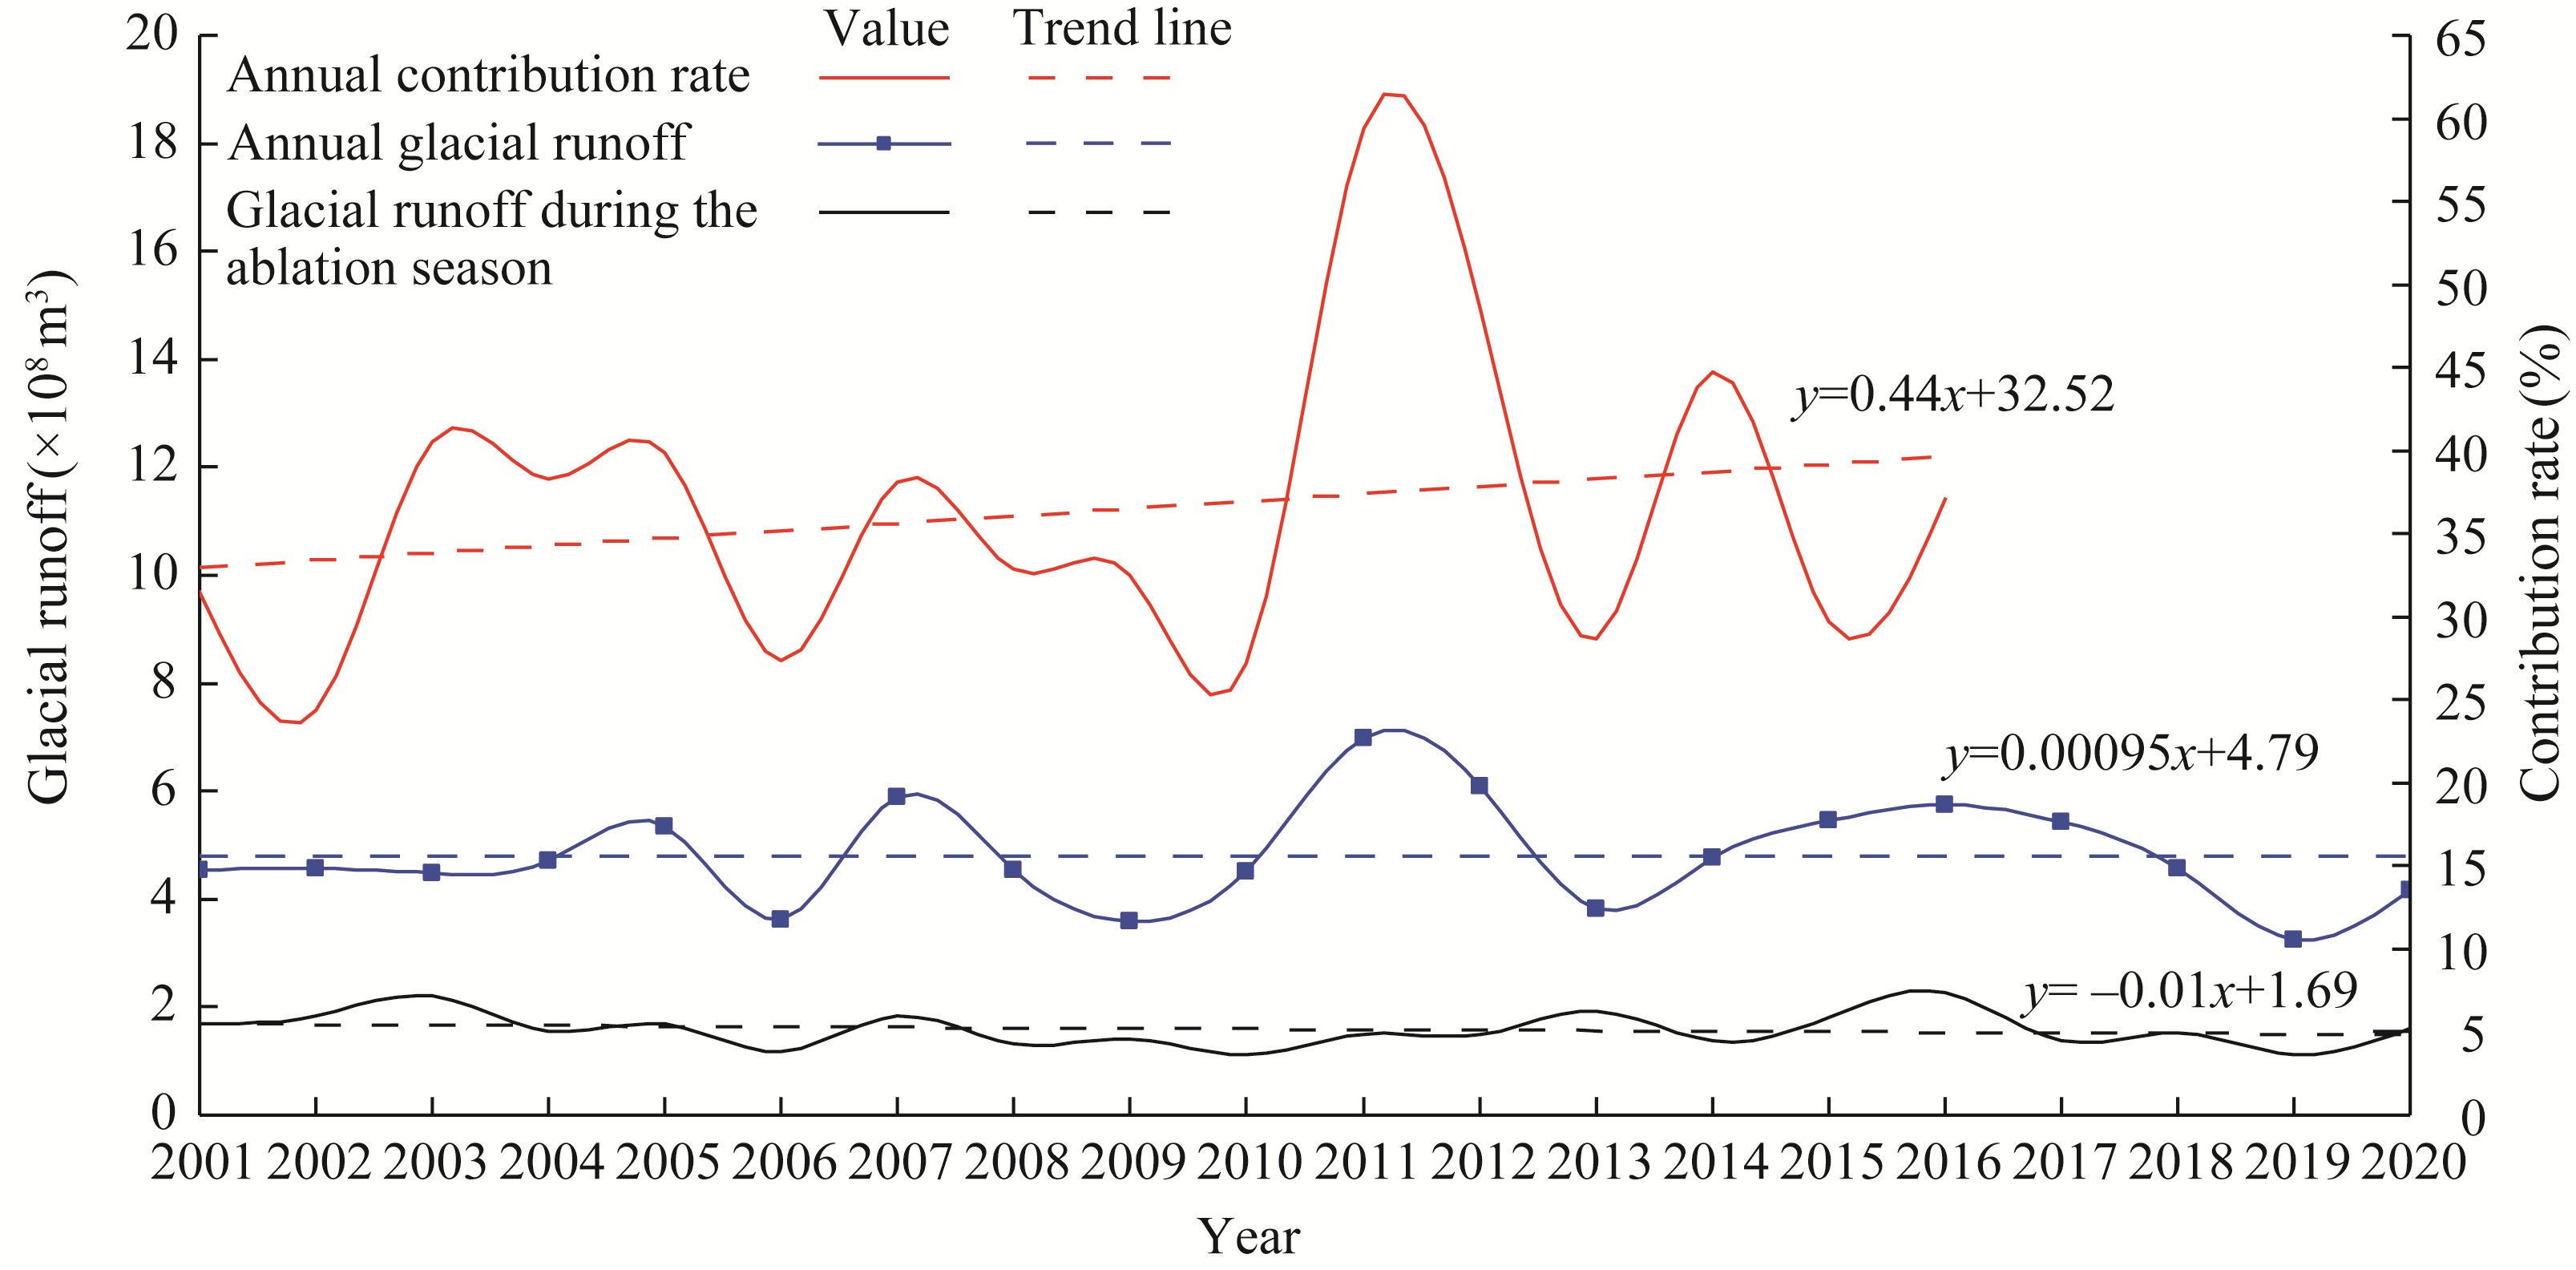
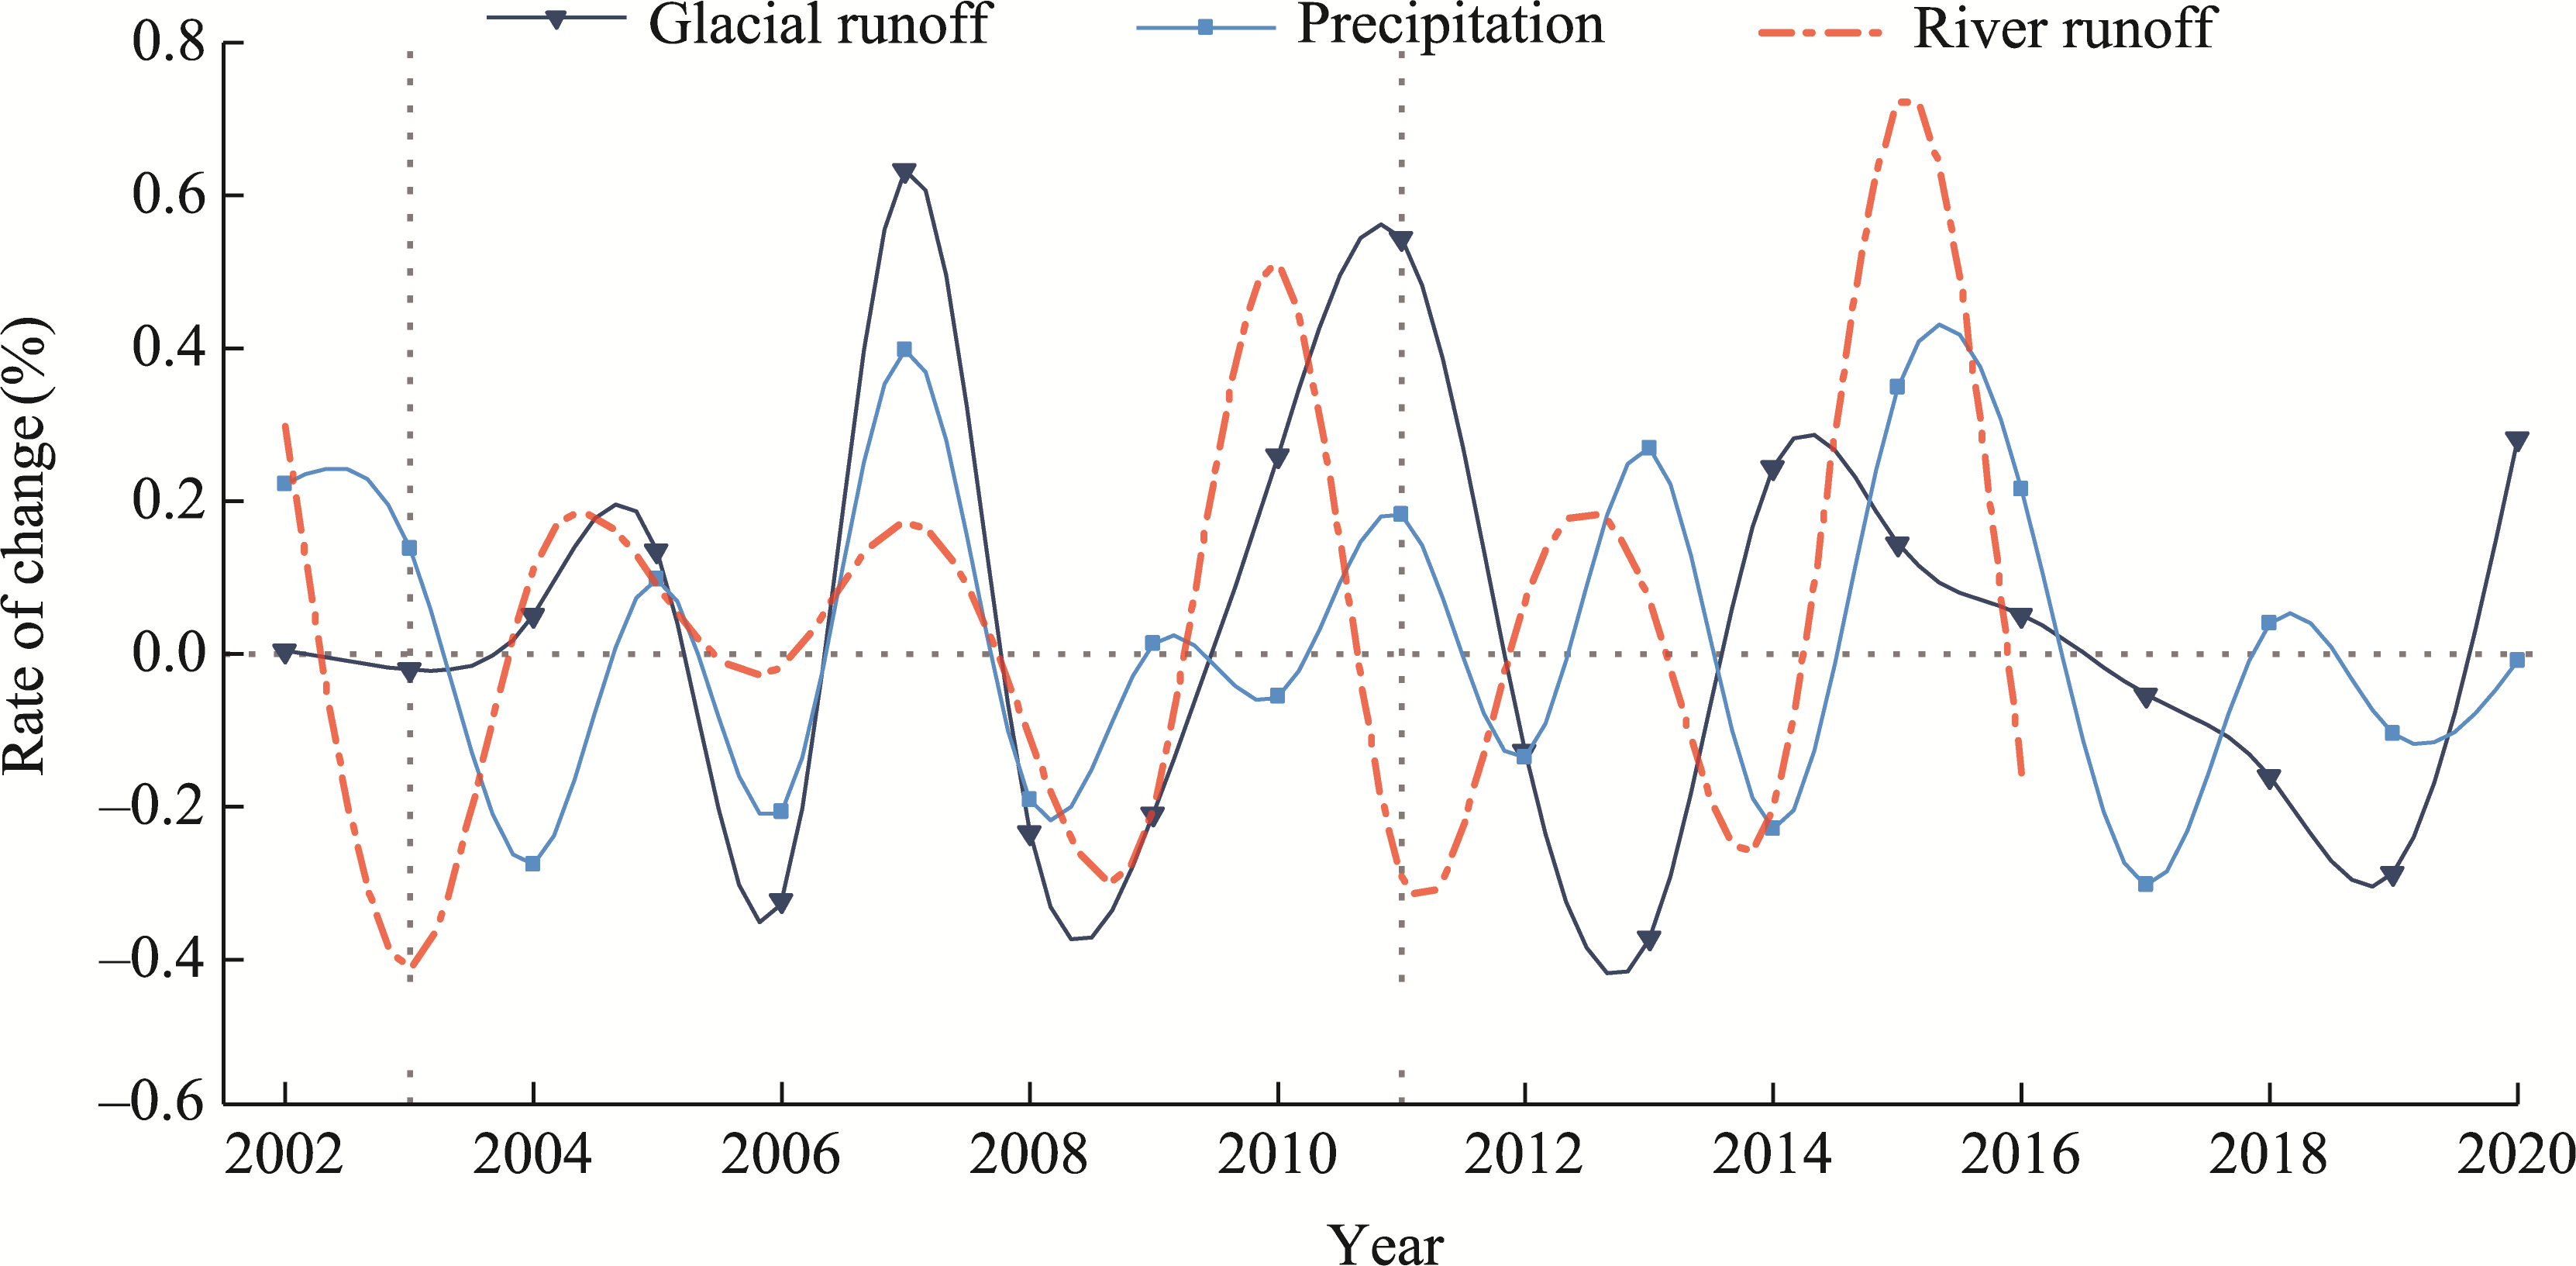
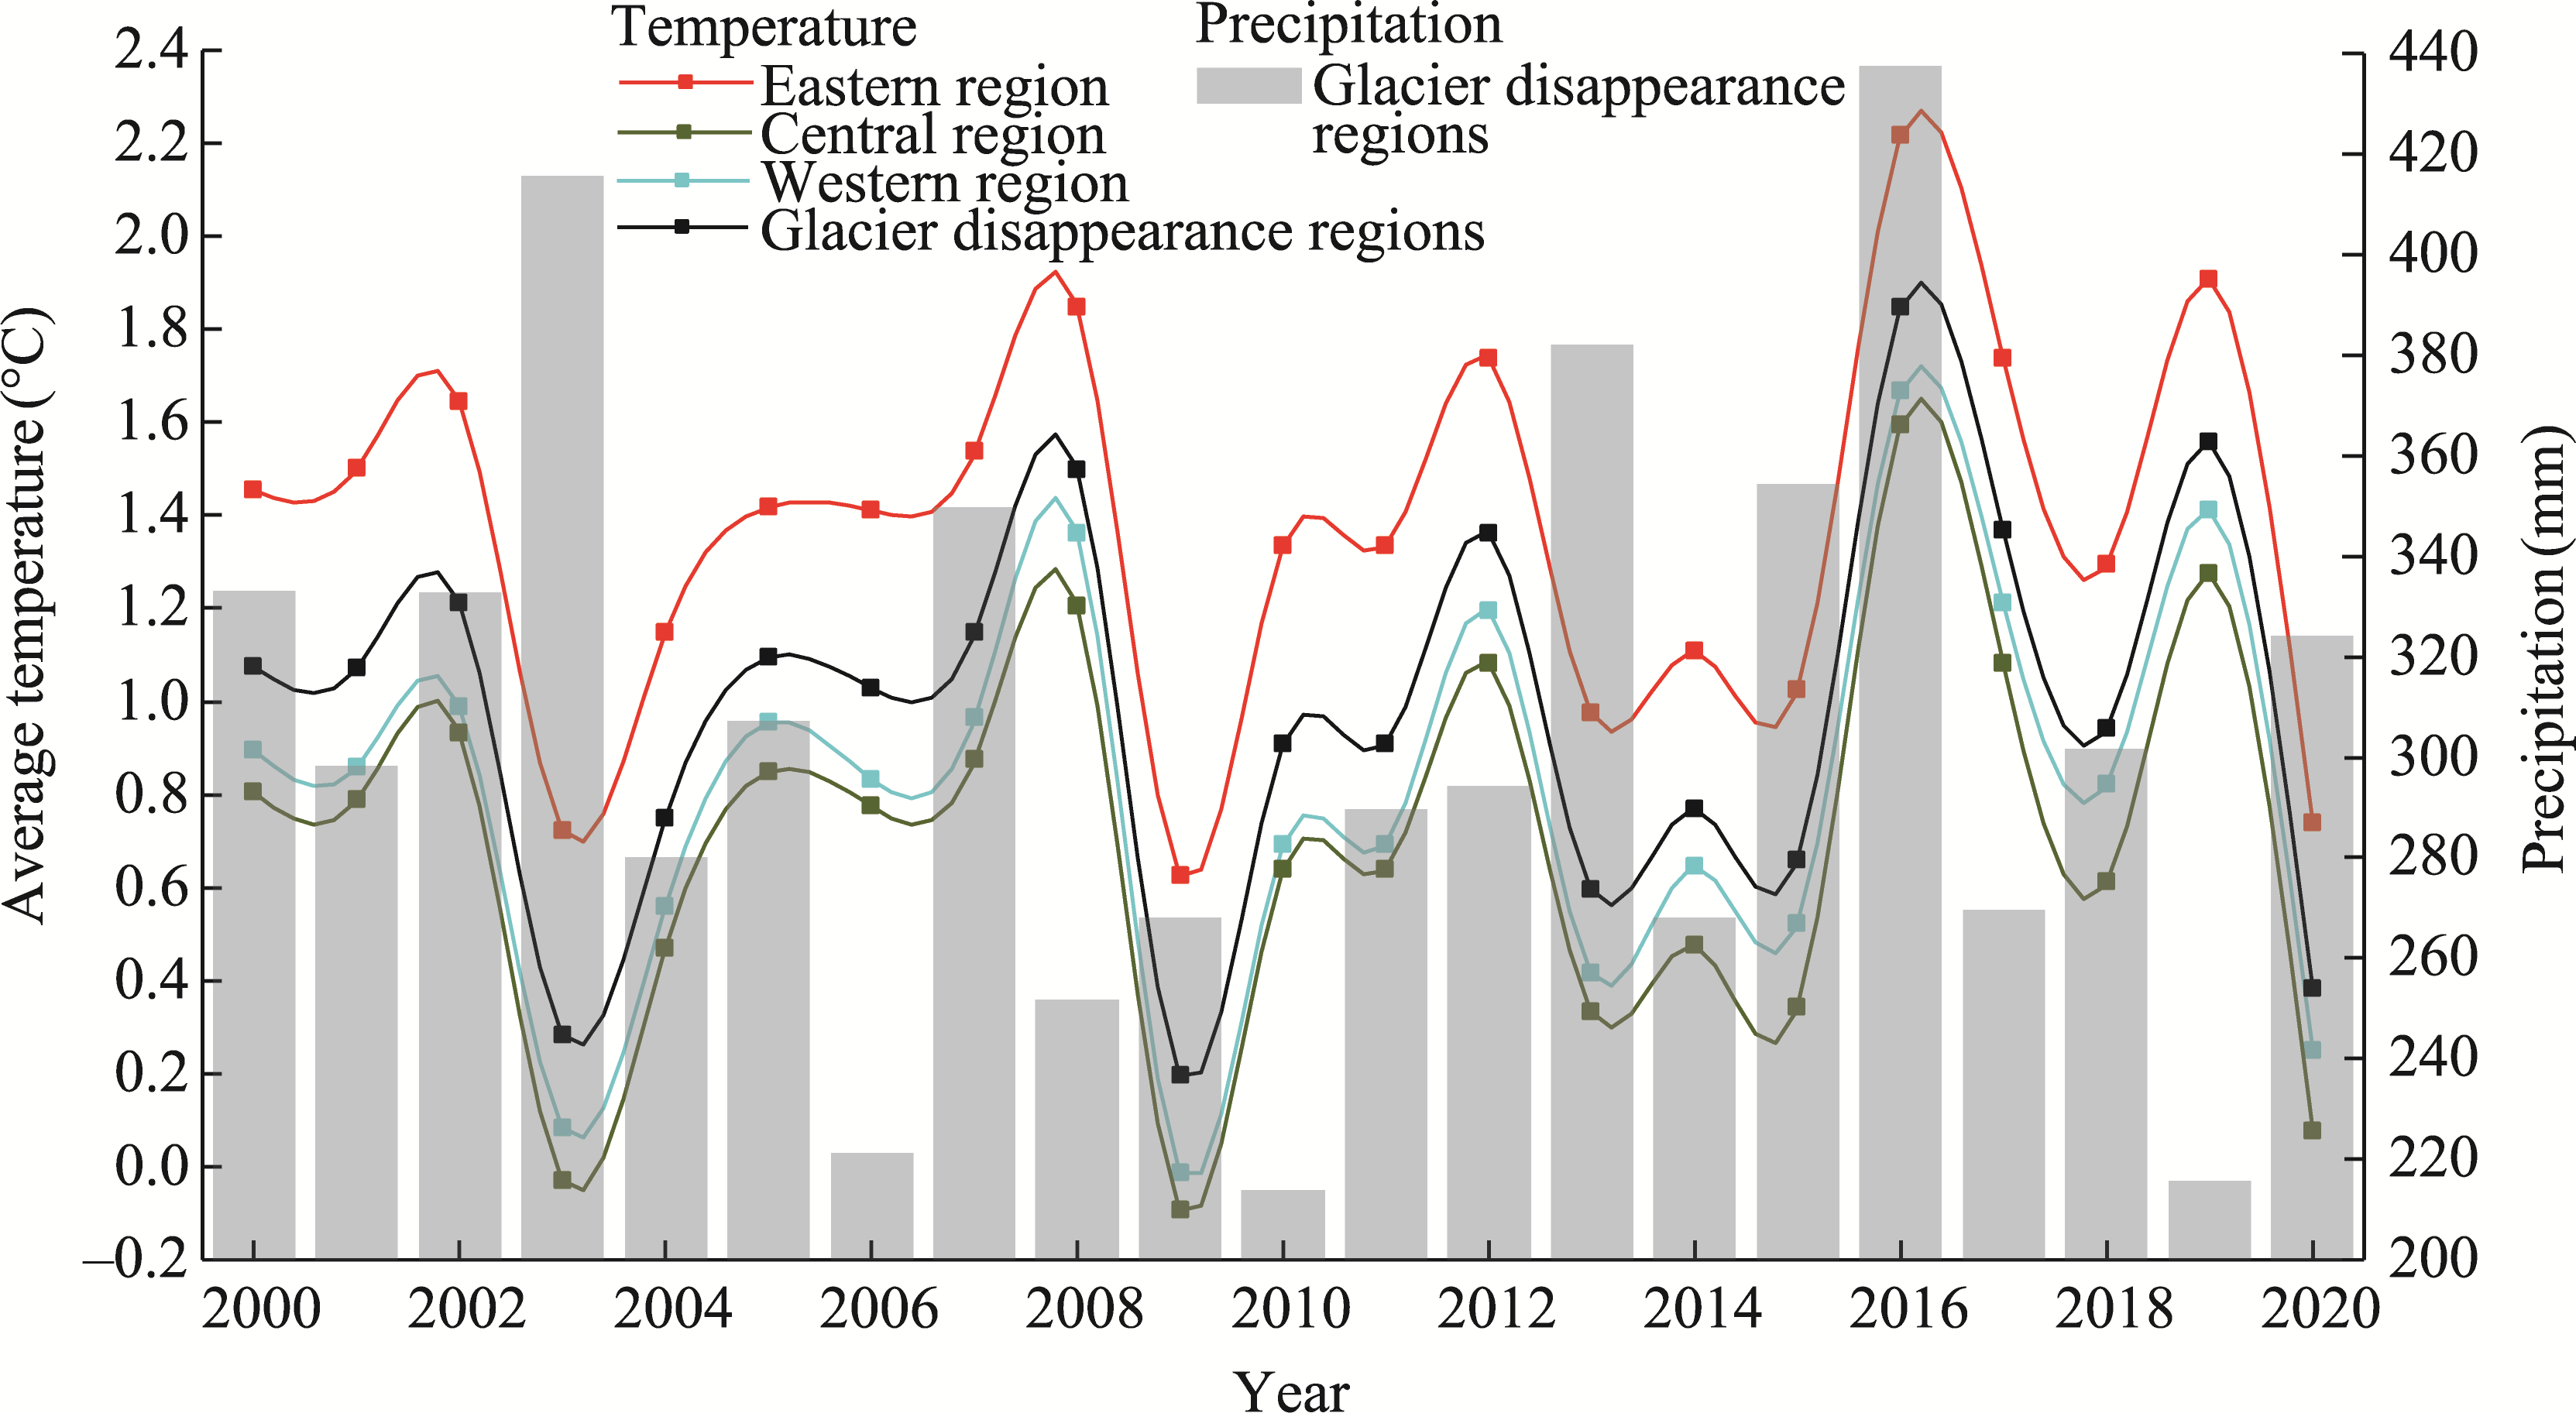
Abstract Understanding the distribution and dynamics of glaciers is of great significance to the management and allocation of regional water resources and socio-economic development in arid regions of Northwest China. In this study, based on 36 Landsat images, we extracted the glacier boundaries in the Manas River Basin, Northwest China from 2000 to 2020 using eCognition combined with band operation, GIS (geographic information system) spatial overlay techniques, and manual visual interpretation. We further analyzed the distribution and variation characteristics of glacier area, and simulated glacial runoff using a distributed degree-day model to explore the regulation of runoff recharge. The results showed that glacier area in the Manas River Basin as a whole showed a downward trend over the past 21 a, with a decrease of 10.86% and an average change rate of -0.54%/a. With the increase in glacier scale, the number of smaller glaciers decreased exponentially, and the number and area of larger glaciers were relatively stable. Glacier area showed a normal distribution trend of increasing first and then decreasing with elevation. About 97.92% of glaciers were distributed at 3700-4800 m, and 48.11% of glaciers were observed on the northern and northeastern slopes. The retreat rate of glaciers was the fastest (68.82%) at elevations below 3800 m. There was a clear rise in elevation at the end of glaciers. Glaciers at different slope directions showed a rapid melting trend from the western slope to the southern slope then to the northern slope. Glacial runoff in the basin showed a fluctuating upward trend in the past 21 a, with an increase rate of 0.03×10⁸ m3/a. The average annual glacial runoff was 4.80×10⁸ m3, of which 33.31% was distributed in the ablation season (June-September). The average annual contribution rate of glacial meltwater to river runoff was 35.40%, and glacial runoff accounted for 45.37% of the total runoff during the ablation season. In addition, precipitation and glacial runoff had complementary regulation patterns for river runoff. The findings can provide a scientific basis for water resource management in the Manas River Basin and other similar arid inland river basins.
|
|
Received: 28 February 2024
Published: 31 July 2024
|
|
Corresponding Authors:
* CHEN Fulong (E-mail: cfl103@shzu.edu.cn)
|
| Cite this article:
WANG Tongxia, CHEN Fulong, LONG Aihua, ZHANG Zhengyong, HE Chaofei, LYU Tingbo, LIU Bo, HUANG Yanhao. Glacier area change and its impact on runoff in the Manas River Basin, Northwest China from 2000 to 2020. Journal of Arid Land, 2024, 16(7): 877-894.
URL:
http://jal.xjegi.com/10.1007/s40333-024-0080-5 OR http://jal.xjegi.com/Y2024/V16/I7/877
|
|
|
| [1] |
Benn D I, Bolch T, Hands K, et al. 2012. Response of debris-covered glaciers in the Mount Everest region to recent warming, and implications for outburst flood hazards. Earth-Science Reviews, 114(1-2): 156-174.
|
|
|
| [2] |
Bliss A, Hock R, Radić V. 2014. Global response of glacier runoff to twenty-first-century climate change. Journal of Geophysical Research: Earth Surface, 119(4): 717-730.
|
|
|
| [3] |
Cao B, Pan B T, Wen Z L, et al. 2019. Changes in glacier mass in the Lenglongling Mountains from 1972 to 2016 based on remote sensing data and modeling. Journal of Hydrology, 578: 124010, doi: 10.1016/j.jhydrol.2019.124010.
|
|
|
| [4] |
Chen H Y, Chen Y N, Li W H, et al. 2019. Quantifying the contributions of snow/glacier meltwater to river runoff in the Tianshan Mountains, Central Asia. Global and Planetary Change, 174: 47-57.
|
|
|
| [5] |
Ding Y J, Liu S Y, Li J, et al. 2006. The retreat of glaciers in response to recent climate warming in western China. Annals of Glaciology, 43: 97-105.
|
|
|
| [6] |
Dolk M, Penton D J, Ahmad M D. 2020. Amplification of hydrological model uncertainties in projected climate simulations of the Upper Indus Basin: Does it matter where the water is coming from? Hydrological Processes, 34(10): 2200-2218.
|
|
|
| [7] |
Donovan M, Belmont P, Notebaert B, et al. 2019. Accounting for uncertainty in remotely sensed measurements of river planform change. Earth-Science Reviews, 193: 220-236.
doi: 10.1016/j.earscirev.2019.04.009
|
|
|
| [8] |
Du W B, Ji W Q, Xu L J, et al. 2020. Deformation time series and driving-force analysis of glaciers in the eastern Tienshan Mountains using the SBAS InSAR Method. International Journal of Environmental Research and Public Health, 17(8): 2836, doi: 10.3390/ijerph17082836.
|
|
|
| [9] |
Gao X, Zhang S Q, Ye B S, et al. 2010. Glacier runoff change in the upper stream of Yarkant River and its impact on river runoff during 1961-2006. Journal of Glaciology and Geocryology, 32(3): 445-453. (in Chinese)
|
|
|
| [10] |
Guo W Q, Liu S Y, Xu J L, et al. 2015. The second Chinese glacier inventory: Data, methods and results. Journal of Glaciology, 61(226): 357-372.
|
|
|
| [11] |
He C F, Chen F L, Long A H, et al. 2023. Improving the precision of monthly runoff prediction using the combined non-stationary methods in an oasis irrigation area. Agricultural Water Management, 279: 108161, doi: 10.1016/j.agwat.2023.108161.
|
|
|
| [12] |
Hirose J M R, Marshall S J. 2013. Glacier meltwater contributions and glaciometeorological regime of the Illecillewaet Rriver Basin, British Columbia, Canada. Atmosphere-Ocean, 51(4): 416-435.
|
|
|
| [13] |
Huang L, Li Z, Zhou J M, et al. 2021. An automatic method for clean glacier and nonseasonal snow area change estimation in High Mountain Asia from 1990 to 2018. Remote Sensing of Environment, 258: 112376, doi: 10.1016/j.rse.2021.112376.
|
|
|
| [14] |
Hugonnet R, McNabb R, Berthier E, et al. 2021. Accelerated global glacier mass loss in the early twenty-first century. Nature, 592(7856): 726-731.
|
|
|
| [15] |
Huss M, Hock R. 2018. Global-scale hydrological response to future glacier mass loss. Nature Climate Change, 8(2): 135-140.
doi: 10.1038/s41558-017-0049-x
|
|
|
| [16] |
Janke J R. 2013. Using airborne LiDAR and USGS DEM data for assessing rock glaciers and glaciers. Geomorphology, 195: 118-130.
|
|
|
| [17] |
Ji Q, Zhang C L, Ding Y K, et al. 2023. Glacier monitoring in Qomolangma Nature Reserve based on multi-source remote sensing data. Arid Land Geography, 46(10): 1591-1601. (in Chinese)
|
|
|
| [18] |
Kumar A, Tiwari S K, Verma A, et al. 2018. Tracing isotopic signatures (δD and δ18O) in precipitation and glacier melt over Chorabari Glacier-Hydroclimatic inferences for the Upper Ganga Basin (UGB), Garhwal Himalaya. Journal of Hydrology: Regional Studies, 15: 68-89.
|
|
|
| [19] |
La Frenierre J L, Mark B G. 2014. A review of methods for estimating the contribution of glacial meltwater to total watershed discharge. Progress in Physical Geography: Earth and Environment, 38(2): 173-200.
|
|
|
| [20] |
Li K M, Li H L, Wang L, et al. 2011. On the relationship between local topography and small glacier change under climatic warming on Mt. Bogda, Eastern Tian Shan, China. Journal of Earth Science, 22(4): 515-527.
|
|
|
| [21] |
Li M, Xiao P F, Zhang X L, et al. 2022. An improved approach of dry snow density estimation using C-band synthetic aperture radar data. ISPRS Journal of Photogrammetry and Remote Sensing, 191: 49-67.
|
|
|
| [22] |
Liu H M, Chen W M, Dong X B, et al. 2009. Sustainable agricultural paradigm of mountain-oasis-ecotone-desert system in inland Manasi River Basin, Xinjiang, northwest China. In: Li D, Zhao C J. Computer and Computing Technologies in Agriculture II, Volume 1. CCTA 2008. IFIP Advances in Information and Communication Technology (Vol. 293). Boston: Springer.
|
|
|
| [23] |
Liu S Y, Ding Y J, Wang N L, et al. 1998. Mass balance sensitivity to climate change of the Glacier No.1 at the Urumqi River Head Tianshan Mts. Journal of Glaciology and Geocryology, 20(1): 9-13. (in Chinese)
|
|
|
| [24] |
Liu S, Sun W X, Shen Y P, et al. 2003. Glacier changes since the Little Ice Age maximum in the western Qilian Shan, northwest China, and consequences of glacier runoff for water supply. Journal of Glaciology, 49(164): 117-124.
|
|
|
| [25] |
Luo Y. 2012. The mass balances modeling and the relationship with meteorological parameters on glaciers in Tianshan, Xinjiang, China. MSc Thesis. Lanzhou: Northwest Normal University. (in Chinese)
|
|
|
| [26] |
Miles K E, Hubbard B, Irvine-Fynn T D L, et al. 2020. Hydrology of debris-covered glaciers in High Mountain Asia. Earth-Science Reviews, 207: 103212, doi: 10.1016/j.earscirev.2020.103212.
|
|
|
| [27] |
Ni M X, Muhtar P, Sun T Y, et al. 2024. Analysis on the supply-demand relationship of water resources based on the dual role of climate change and human activities in southern Xinjiang, China. Journal of Basic Science and Engineering, 32(2): 331-348. (in Chinese)
|
|
|
| [28] |
Paul F, Bolch T, Briggs K, et al. 2017. Error sources and guidelines for quality assessment of glacier area, elevation change, and velocity products derived from satellite data in the Glaciers_cci project. Remote Sensing of Environment, 203: 256-275.
|
|
|
| [29] |
Peng Z T, Zhang Y D, Zhu L J, et al. 2022. Divergent tree growth and the response to climate warming and humidification in the Tianshan Mountains, China. Forests, 13(6): 886, doi: 10.3390/f13060886.
|
|
|
| [30] |
Rafiq M, Romshoo S A, Mishra A K, et al. 2019. Modeling Chorabari Lake outburst flood, Kedarnath, India. Journal of Mountain Science, 16(1): 64-76.
|
|
|
| [31] |
Ren J W, Qin D H, Kang S C, et al. 2004. Glacier variations and climate warming and drying in the central Himalayas. Chinese Science Bulletin, 49(1): 65-69.
|
|
|
| [32] |
Shi S X, Xing L, Ding Y K, et al. 2022. Characteristics and changes of the Himalayas glacial area in China during 1990-2015. Journal of Mountain Science, 19(7): 1961-1973.
|
|
|
| [33] |
Silwal G, Ammar M E, Thapa A, et al. 2023. Response of glacier modeling parameters to time, space, and model complexity: Examples from eastern slopes of Canadian Rocky Mountains. Science of the Total Environment, 872: 162156, doi: 10.1016/j.scitotenv.2023.162156.
|
|
|
| [34] |
Singh D K, Thakur P K, Naithani B P, et al. 2021. Quantifying the sensitivity of band ratio methods for clean glacier ice mapping. Spatial Information Research, 29(3): 281-295.
|
|
|
| [35] |
Sorg A, Bolch T, Stoffel M, et al. 2012. Climate change impacts on glaciers and runoff in Tien Shan (Central Asia). Nature Climate Change, 2(10): 725-731.
|
|
|
| [36] |
Su B, Xiao C D, Chen D L, et al. 2022. Glacier change in China over past decades: Spatiotemporal patterns and influencing factors. Earth-Science Reviews, 226: 103926, doi: 10.1016/j.earscirev.2022.103926.
|
|
|
| [37] |
Sun C J, Yang J, Chen Y N, et al. 2016. Comparative study of streamflow components in two inland rivers in the Tianshan Mountains, Northwest China. Environmental Earth Sciences, 75(9): 727, doi: 10.1007/s12665-016-5314-1.
|
|
|
| [38] |
Sun M P, Liu S Y, Yao X J, et al. 2018. Glacier changes in the Qilian Mountains in the past half-century: Based on the revised First and Second Chinese Glacier Inventory. Journal of Geographical Sciences, 28(2): 206-220.
doi: 10.1007/s11442-018-1468-y
|
|
|
| [39] |
Tang H. 2023. Simulation of Manas River runoff based on reanalysis dataset. MSc Thesis. Shihezi: Shihezi University. (in Chinese)
|
|
|
| [40] |
Tielidze L G, Nosenko G A, Khromova T E, et al. 2022. Strong acceleration of glacier area loss in the Greater Caucasus between 2000 and 2020. The Cryosphere, 16(2): 489-504.
|
|
|
| [41] |
Unger-Shayesteh K, Vorogushyn S, Farinotti D, et al. 2013. What do we know about past changes in the water cycle of Central Asian headwaters? A review. Global and Planetary Change, 110: 4-25.
|
|
|
| [42] |
Wang P Y, Li H L, Li Z Q, et al. 2024. Rapid mass losses of Urumqi River Basin glaciers, eastern Tianshan Mountains revealed from multi-temporal DEMs, 1964-2021. International Journal of Digital Earth, 17(1): 2295990, doi: 10.1080/17538947.2023.2295990.
|
|
|
| [43] |
Wang R J, Ding Y J, Shangguan D H, et al. 2023. Projections of glacier peak water and its timing in the Sanjiangyuan on the Tibetan Plateau. Journal of Hydrology: Regional Studies, 45(4): 101313, doi: 10.1016/j.ejrh.2022.101313.
|
|
|
| [44] |
Wang T X, Zhang Z Y, Liu L, et al. 2021. Simulation of the potential distribution of the glacier based on maximum entropy model in the Tianshan Mountains, China. Water, 13(11): 1541, doi: 10.3390/w13111541.
|
|
|
| [45] |
Xu B R, Lu Z X, Liu S Y, et al. 2015. Glacier changes and their impacts on the discharge in the past half-century in Tekes watershed, Central Asia. Physics and Chemistry of the Earth, Parts A/B/C, 89-90: 96-103.
|
|
|
| [46] |
Yang Z L, Bai P. 2024. Response of runoff and its components to climate change in the Manas River of the Tian Shan Mountains. Advances in Climate Change Research, 15(1): 62-74.
|
|
|
| [47] |
Yang Z N. 1987. Glacier water resources in China. Resources Science, 9(1): 46-55. (in Chinese)
|
|
|
| [48] |
Yao G H, Zhou X B, Ke C Q, et al. 2022. The potential of Sentinel-1A data for identification of debris-covered alpine glacier based on machine learning approach. Remote Sensing, 14(9): 1980, doi: 10.3390/rs14091980.
|
|
|
| [49] |
Yao T D, Wang Y Q, Liu S Y, et al. 2004. Recent glacial retreat in High Asia in China and its impact on water resource in Northwest China. Science in China Series D: Earth Sciences, 47(12): 1065-1075.
|
|
|
| [50] |
Zhang H, Li Z Q, Zhou P, et al. 2018. Mass-balance observations and reconstruction for Haxilegen Glacier No.51, eastern Tien Shan, from 1999 to 2015. Journal of Glaciology, 64(247): 689-699.
|
|
|
| [51] |
Zhang S Q, Ye B S, Liu S Y, et al. 2012. A modified monthly degree-day model for evaluating glacier runoff changes in China. Part I: model development. Hydrological Processes, 26(11): 1686-1696.
|
|
|
| [52] |
Zhang Y, Liu S Y, Ding Y J. 2006. Spatial variation of degree-day factors on the observed glaciers in western China. Acta Geographica Sinica, 61(1): 89-98. (in Chinese)
doi: 10.11821/xb200601009
|
|
|
| [53] |
Zhang Y, Liu S Y, Wang X. 2019a. A dataset of the spatial distribution of degree-day factors for glaciers in High Mountain Asia. China Scientific Data, 4(3): 141-151.
|
|
|
| [54] |
Zhang Z Y, Liu L, He X L, et al. 2019b. Evaluation on glaciers ecological services value in the Tianshan Mountains, Northwest China. Journal of Geographical Sciences, 29(1): 101-114.
|
|
|
| [55] |
Zhao G N, Zhang Z Y, Liu L, et al. 2020. Simulation and construction of the glacier mass balance in the Manas River Basin, Tianshan, China from 2000 to 2016. Journal of Geographical Sciences, 30(6): 988-1004.
doi: 10.1007/s11442-020-1766-z
|
|
|
|
Viewed |
|
|
|
Full text
|
|
|
|
|
Abstract
|
|
|
|
|
Cited |
|
|
|
|
| |
Shared |
|
|
|
|
| |
Discussed |
|
|
|
|