| Research article |
|


|
|
|
| Promoting the production of salinized cotton field by optimizing water and nitrogen use efficiency under drip irrigation |
LIN En1,2, LIU Hongguang1,2,*( ), LI Xinxin1,2, LI Ling1,2, Sumera ANWAR3 ), LI Xinxin1,2, LI Ling1,2, Sumera ANWAR3 |
1College of Water Conservancy & Architectural Engineering, Shihezi University, Shihezi 832000, China
2Xinjiang Production & Construction Group Key Laboratory of Modern Water-Saving Irrigation, Shihezi 832000, China
3Institute of Molecular Biologyand Biotechnology, The University of Lahore, Lahore 54660, Pakistan |
|
|
|
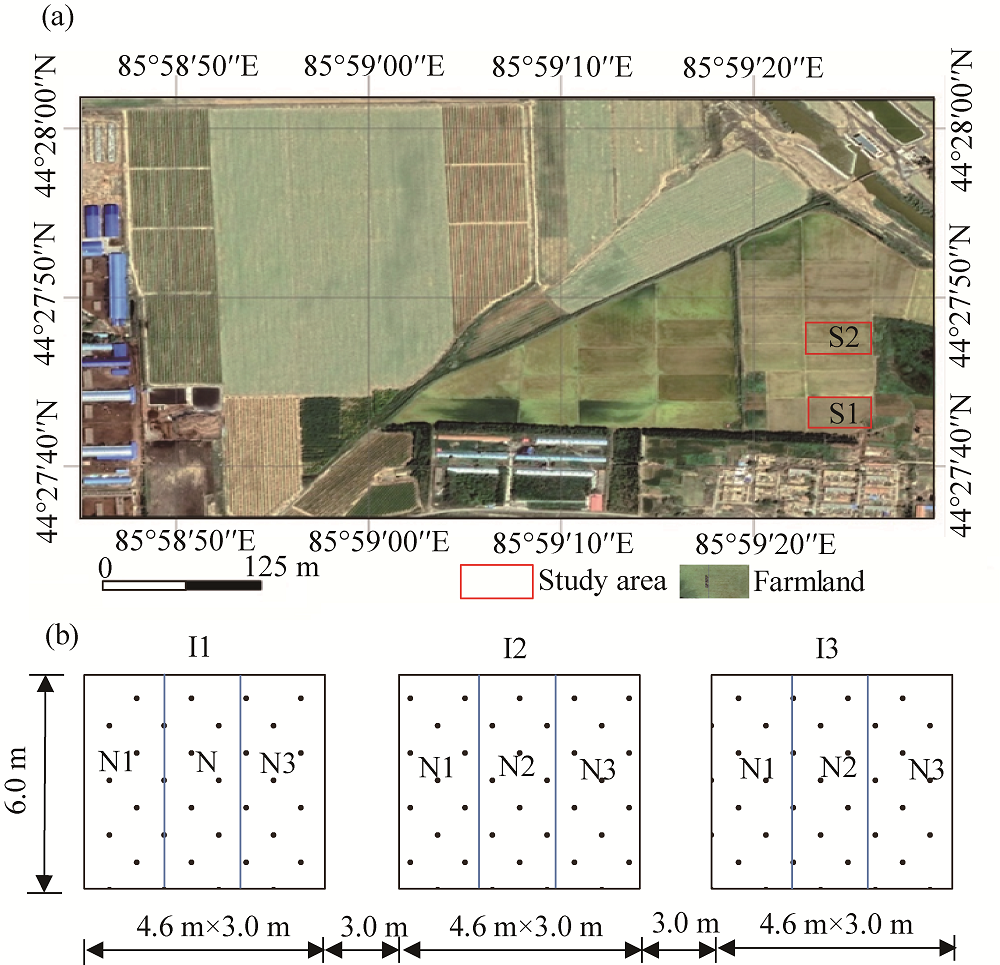
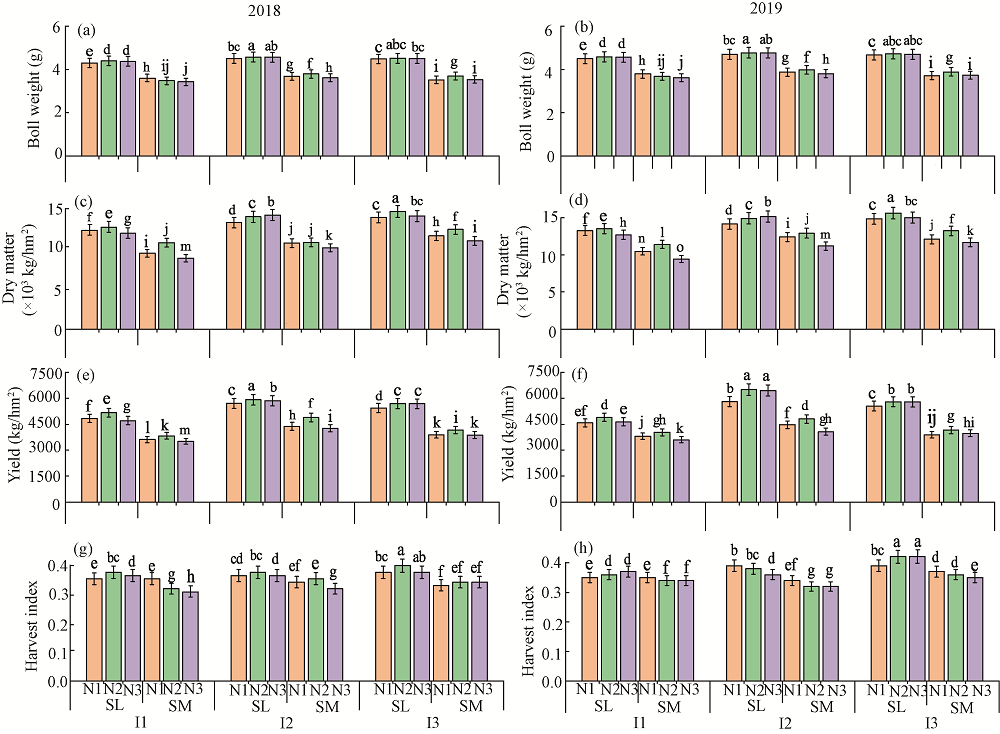
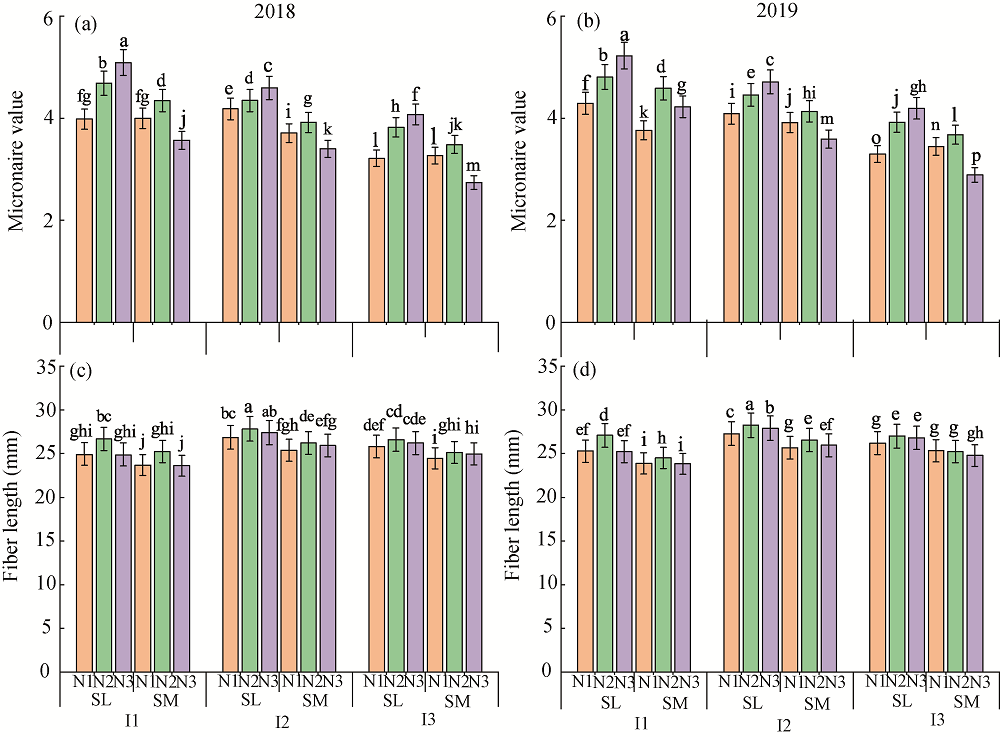
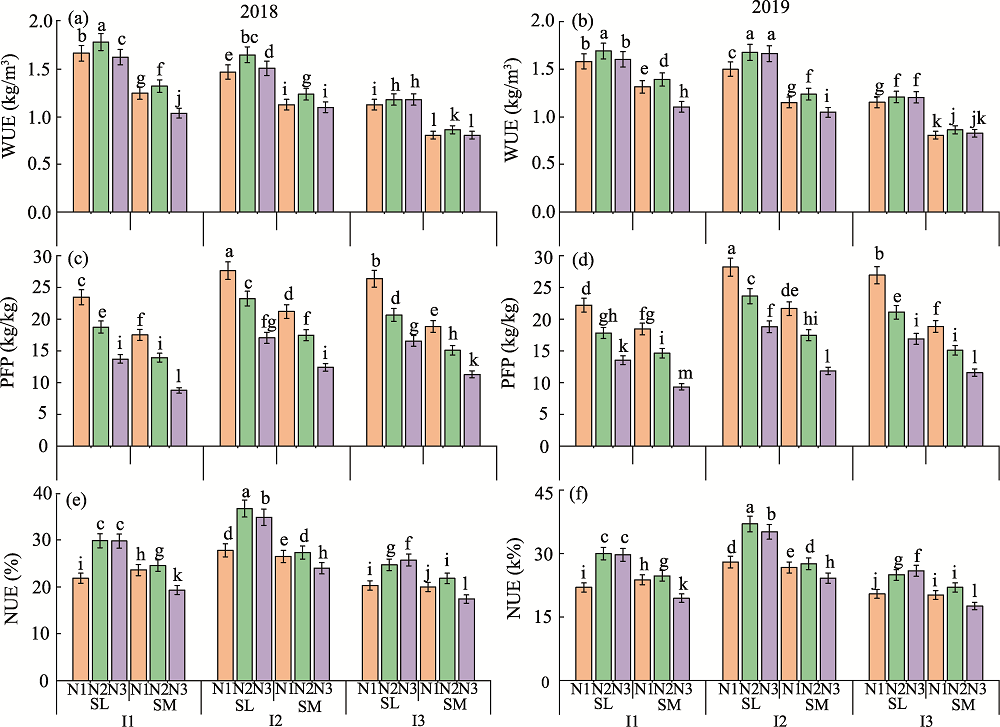
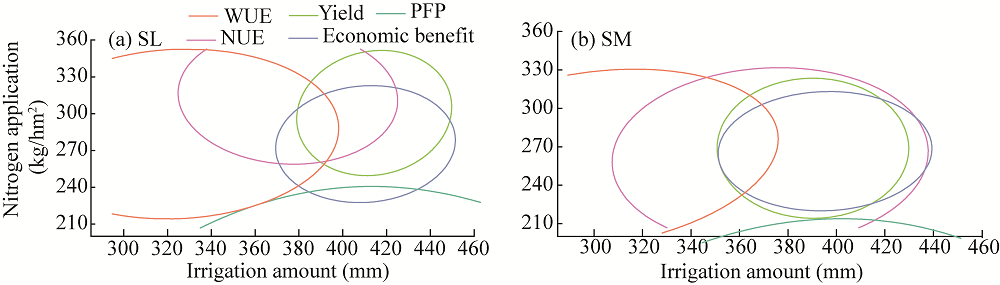
Abstract Cotton is the main economically important crop in Xinjiang, China, but soil salinization and shortage of water and nutrients have restricted its production. A field experiment was carried out in the salinity-affected arid area of Northwest China from 2018 to 2019 to explore the effects of nitrogen and water regulation on physiological growth, yield, water and nitrogen use efficiencies, and economic benefit of cotton. The salinity levels were 7.7 (SL) and 12.5 dS/m (SM). Drip irrigation was used with low, medium and adequate irrigation levels representing 60%, 80% and 100% of cotton crop water demand, respectively, and three nitrogen applications, i.e., 206, 275 and 343 kg/hm2, accounting for 75%, 100% and 125% of local N application, respectively were used. The multi-objective optimization based on spatial analysis showed that, at SL salinity, water use efficiency (WUE), nitrogen use efficiency (NUE), economic benefit and yield simultaneously reached more than 85% of their maxima at 379.18-398.32 mm irrigation and 256.69-308.87 kg/hm2. At SM salinity, WUE, yield and economic benefit simultaneously reached more than 85% of their maxima when irrigation was 351.24-376.30 mm and nitrogen application was 230.18-289.89 kg/hm2. NUE, yield and economic benefit simultaneously reached their maxima at 428.01-337.72 mm irrigation, and nitrogen application range was 222.14-293.93 kg/hm2. The plants at SL salinity had 21.58%-46.59% higher WUE rates, 14.91%-34.35% higher NUE rates and 20.71%-35.34% higher yields than those at SM salinity. The results are of great importance for the nutrient and water management in cotton field in the arid saline area.
|
|
Received: 11 November 2020
Published: 10 July 2021
|
|
Corresponding Authors:
|
About author: *LIU Hongguang (E-mail: liuhongguang-521@163.com)
|
|
|
| [1] |
Adiku S G K, Renger M, Wessolek G, et al. 2001. Simulation of the dry matter production and seed yield of common beans under varying soil water and salinity conditions. Agricultural Water Management, 47(1):55-68.
doi: 10.1016/S0378-3774(00)00094-9
|
|
|
| [2] |
Allen R G, Pereira L S, Raes D, et al. 1998. Crop evapotranspiration-guidelines for computing crop water requirements-FAO irrigation and drainage paper 56. FAO, Rome, 300(9):D05109.
|
|
|
| [3] |
Badr M A, Abou-Hussein S D, El-Tohamy W A. 2016. Tomato yield, nitrogen uptake and water use efficiency as affected by planting geometry and level of nitrogen in an arid region. Agricultural Water Management, 169:90-97.
doi: 10.1016/j.agwat.2016.02.012
|
|
|
| [4] |
Chen W L, Jin M G, Ferré T P, et al. 2020. Soil conditions affect cotton root distribution and cotton yield under mulched drip irrigation. Field Crops Research, 249:107743.
doi: 10.1016/j.fcr.2020.107743
|
|
|
| [5] |
Chen W P, Hou Z N, Wu L S, et al. 2010. Effects of salinity and nitrogen on cotton growth in arid environment. Plant and Soil, 326(1):61-73.
doi: 10.1007/s11104-008-9881-0
|
|
|
| [6] |
Choudhary R L, Minhas P S, Wakchaure G C, et al. 2020. Effect of IW: CPE-based irrigation scheduling and N-fertilization rate on yield, water and N-use efficiency of wheat (Triticum aestivum). Agricultural Research, 10(2):1-12.
doi: 10.1007/s40003-020-00482-3
|
|
|
| [7] |
Dağdelen N, Başal H, Yılmaz E, et al. 2009. Different drip irrigation regimes affect cotton yield, water use efficiency and fiber quality in western Turkey. Agricultural Water Management, 96(1):111-120.
doi: 10.1016/j.agwat.2008.07.003
|
|
|
| [8] |
Deng Z, Bai D, Zhai G L, et al. 2013. Effects of water and nitrogen regulation on the yield and water and nitrogen use efficiency of cotton in south Xinjiang, Northwest China under plastic mulched drip irrigation. Chinese Journal of Applied Ecology, 24(9):2525-2532. (in Chinese)
|
|
|
| [9] |
Du H Y, Sun X L, Liu X W, et al. 2017. Effects of optimized fertilization on plant growth and soil nutrients supply in saline fields. Acta Agriculturae Boreali-Sinica, 32(1):220-225. (in Chinese)
|
|
|
| [10] |
Feng L, Zhang J P, Sun C T, et al. 2014. Responses of cotton growth and water physiological indices to salt stress at different growing stages. Chinese Journal of Ecology, 33(5):1195-1199. (in Chinese)
|
|
|
| [11] |
García-López J, Lorite I J, García-Ruiz R, et al. 2016. Yield response of sunflower to irrigation and fertilization under semi-arid conditions. Agricultural Water Management, 176:151-162.
doi: 10.1016/j.agwat.2016.05.020
|
|
|
| [12] |
He H J, Wang Z H, Zheng X R, et al. 2017. Effects of water-nitrogen coupling on growth and yield of cotton under mulch drip irrigation. Xinjiang Agricultural Sciences, 54(11):1983-1989. (in Chinese)
|
|
|
| [13] |
Hou Z A, Chen W P, Li X, et al. 2009. Effects of salinity and fertigation practice on cotton yield and 15N recovery. Agricultural Water Management, 96(10):1483-1489.
doi: 10.1016/j.agwat.2009.04.019
|
|
|
| [14] |
Hu Y J, Wang X B, Zhao Q S, et al. 2010. Effects of sea ice water irrigation and different fertilizations on soil salinity dynamics and cotton. Transactions of the Chinese society of Agricultural Engineering, 26(9):20-27. (in Chinese)
|
|
|
| [15] |
Ierna A, Pandino G, Lombardo S, et al. 2011. Tuber yield, water and fertilizer productivity in early potato as affected by a combination of irrigation and fertilization. Agricultural Water Management, 101(1):35-41.
doi: 10.1016/j.agwat.2011.08.024
|
|
|
| [16] |
Jiang Y J, Zheng D M, Lv S Q, et al. 1995. Influence of soil salt content on cotton yield and quality. Xinjiang Agricultural Sciences, 3:116-118. (in Chinese)
|
|
|
| [17] |
Kljun A, El-Dessouky H M, Benians T A, et al. 2014. Analysis of the physical properties of developing cotton fibres. European Polymer Journal, 51:57-68.
doi: 10.1016/j.eurpolymj.2013.11.016
|
|
|
| [18] |
Krishnamurthy S L, Gautam R K, Sharma P C, et al. 2016. Effect of different salt stresses on agro-morphological traits and utilisation of salt stress indices for reproductive stage salt tolerance in rice. Field Crops Research, 190:26-33.
doi: 10.1016/j.fcr.2016.02.018
|
|
|
| [19] |
Leal A J, Piati G L, Leite R C, et al. 2020. Nitrogen and mepiquat chloride can affect fiber quality and cotton yield. Revista Brasileira de Engenharia Agrícola e Ambiental, 24(4):238-243.
doi: 10.1590/1807-1929/agriambi.v24n4p238-243
|
|
|
| [20] |
Lin E, Liu H G, He X L, et al. 2019. Water-nitrogen coupling effect on drip-irrigated dense planting of dwarf jujube in an extremely arid area. Agronomy, 9(9):561.
doi: 10.3390/agronomy9090561
|
|
|
| [21] |
Li P L, Zhang F C. 2010. Regulation effect of water and nitrogen on cotton biomass and yield under different drip irrigation patterns. Journal of Applied Ecology, 21(11):2814-2820. (in Chinese)
|
|
|
| [22] |
Li P L, Zhang F C. 2012. Effects of water and nitrogen coupling on cotton nitrogen absorption and utilization under alternate root partition drip. Transactions of the Chinese Society of Agricultural Engineering, 28(S1):112-116. (in Chinese)
|
|
|
| [23] |
Li X X, Liu H G, He X L, et al. 2019. Water-nitrogen coupling and multi-objective optimization of cotton under mulched drip irrigation in arid northwest China. Agronomy, 9(12):894.
doi: 10.3390/agronomy9120894
|
|
|
| [24] |
Luo J, Chen B L, Xiang G R, et al. 2017. Effects of organic manure on dry matter accumulation, nutrient absorption and cotton production on salt affected land. Soil and Fertilizer Sciences in China, (2):107-113. (in Chinese)
|
|
|
| [25] |
Min W, Hou Z A, Ma L J, et al. 2014. Effects of water salinity and N application rate on water-and N-use efficiency of cotton under drip irrigation. Journal of Arid land, 6(4):454-467.
doi: 10.1007/s40333-013-0250-3
|
|
|
| [26] |
Pinnamaneni S R, Anapalli S S, Ruixiu S U I, et al. 2021. Effects of irrigation and planting geometry on cotton (Gossypium hirsutum L.) fiber quality and seed composition. Journal of Cotton Research, 4(1):1-11.
doi: 10.1186/s42397-020-00077-x
|
|
|
| [27] |
Sobrinho F P C, Guerra H O, Araújo W P, et al. 2015. Fiber quality of upland cotton under different irrigation depths. Revista Brasileira de Engenharia Agrícola e Ambiental, 19(11):1057-1063.
doi: 10.1590/1807-1929/agriambi.v19n11p1057-1063
|
|
|
| [28] |
Sui R, Byler R K, Delhom C D. 2017. Effect of nitrogen application rates on yield and quality in irrigated and rainfed cotton. Journal of Cotton Science, 21(2):113-121.
|
|
|
| [29] |
Tang L S, Li Y, Zhang J H. 2005. Physiological and yield responses of cotton under partial root zone irrigation. Field Crops Research, 94(2-3):214-223.
doi: 10.1016/j.fcr.2005.01.005
|
|
|
| [30] |
Thompson T L, Doerge T A. 1996. Nitrogen and water interactions in subsurface trickle-irrigated leaf lettuce II. Agronomic, economic, and environmental outcomes. Soil Science Society of America Journal, 60(1):168-173.
doi: 10.2136/sssaj1996.03615995006000010027x
|
|
|
| [31] |
Umbetaev I, Bigaraev O, Baimakhanov K. 2015. Effect of soil salinity on the yield of cotton in Kazakhstan. Russian Agricultural Sciences, 41(4):222-224.
doi: 10.3103/S1068367415040205
|
|
|
| [32] |
Wang H D, Wu L F, Cheng M H, et al. 2018. Coupling effects of water and fertilizer on yield, water and fertilizer use efficiency of drip-fertigated cotton in northern Xinjiang, China. Field Crops Research, 219:169-179.
doi: 10.1016/j.fcr.2018.02.002
|
|
|
| [33] |
Wang R S, Kang Y H, Wan S Q, et al. 2011. Salt distribution and the growth of cotton under different drip irrigation regimes in a saline area. Agricultural Water Management, 100(1):58-69.
doi: 10.1016/j.agwat.2011.08.005
|
|
|
| [34] |
Wang R S, Kang Y H, Wan S Q, et al. 2012. Influence of different amounts of irrigation on salt leaching and cotton growth under drip irrigation in an arid and saline area. Agricultural Water Management, 110:109-117.
doi: 10.1016/j.agwat.2012.04.005
|
|
|
| [35] |
Wang R S, Wan S Q, Sun J X, et al. 2018. Soil salinity, sodicity and cotton yield parameters under different drip irrigation regimes during saline wasteland reclamation. Agricultural Water Management, 209:20-31.
doi: 10.1016/j.agwat.2018.07.004
|
|
|
| [36] |
Wang Z H, Zhu Y K, Zhang J Z, et al. 2018. Effects of water and nitrogen fertilization on physiological characteristics and yield of cotton under drip irrigation in mildly salinized soil. Transactions of the Chinese Society for Agricultural Machinery, 49(6):296-308. (in Chinese)
|
|
|
| [37] |
Wang Z M, Wang B G, Jin M G. 2013. Water and salt stress to cotton in the condition of drip irrigation under mulch. Geological Science and Technology Information, 32(3):166-170. (in Chinese)
|
|
|
| [38] |
Wu L F, Zhang F C, Zhou H M, et al. 2014. Effect of drip irrigation and fertilizer application on water use efficiency and cotton yield in North of Xinjiang. Transactions of the Chinese Society of Agricultural Engineering, 30(20):137-146. (in Chinese)
|
|
|
| [39] |
Wu L F, Zhang F C, Wang H D, et al. 2015. Simulation of cotton leaf area index under deficit irrigation in Xinjiang. Transactions of the Chinese Society for Agricultural Machinery, 46(1):249-258. (in Chinese)
|
|
|
| [40] |
Xue Z, Shi H B, Guo Y, et al. 2007. Effects of coupling of soil water and fertilizer on the growth of sunflower during its seeding period in saline soil. Transactions of the Chinese Society of Agricultural Engineering, (3):91-94.
|
|
|
| [41] |
Ye Q B, Zhang H C, Wei H Y, et al. 2007. Effects of nitrogen fertilizer on nitrogen use efficiency and yield of rice under different soil conditions. Frontiers of Agriculture in China, 1(1):30-36.
doi: 10.1007/s11703-007-0005-z
|
|
|
| [42] |
Zhang D M, Li W J, Xin C S, et al. 2012. Lint yield and nitrogen use efficiency of field-grown cotton vary with soil salinity and nitrogen application rate. Field Crops Research, 138:63-70.
doi: 10.1016/j.fcr.2012.09.013
|
|
|
| [43] |
Zhang H, Li D S, Zhou Z G, et al. 2017. Soil water and salt affect cotton (Gossypium hirsutum L.) photosynthesis, yield and fiber quality in coastal saline soil. Agricultural Water Management, 187:112-121.
doi: 10.1016/j.agwat.2017.03.019
|
|
|
| [44] |
Zhang L, Chen B L, Zhang G W, et al. 2013. Effect of soil salinity, soil drought, and their combined action on the biochemical characteristics of cotton roots. Acta Physiologiae Plantarum, 35(11):3167-3179.
doi: 10.1007/s11738-013-1350-6
|
|
|
| [45] |
Zhao W Q, Wang Y H, Zhou Z G, et al. 2012. Effect of nitrogen rates and flowering dates on fiber quality of cotton (Gossypium hirsutum L.). Journal of Experimental Agriculture International, 2(2):133-159.
|
|
|
| [46] |
Zou H Y, Fan J L, Zhang F C, et al. 2020. Optimization of drip irrigation and fertilization regimes for high grain yield, crop water productivity and economic benefits of spring maize in Northwest China. Agricultural Water Management, 230:105986.
doi: 10.1016/j.agwat.2019.105986
|
|
|
|
Viewed |
|
|
|
Full text
|
|
|
|
|
Abstract
|
|
|
|
|
Cited |
|
|
|
|
| |
Shared |
|
|
|
|
| |
Discussed |
|
|
|
|