| Research article |
|


|
|
|
| Flow regime changes in three catchments with different landforms following ecological restoration in the Chinese Loess Plateau |
LUO Zhidong1,2, LIU Erjia1, QI Shi1,3,4,*( ), ZHAO Nan5, SUN Yun2 ), ZHAO Nan5, SUN Yun2 |
1 College of Soil and Water Conservation, Beijing Forestry University, Beijing 100083, China
2 Water and Soil Conservation Monitoring Center of Ministry of Water Resources, Beijing 100053, China
3 Key Laboratory of Soil and Water Conservation of State Forestry Administration, Beijing 100083, China
4 Engineering Research Center of Forestry Ecological Engineering, Ministry of Education, Beijing 100083, China
5 Shanxi Institute of Soil and Water Conservation, Taiyuan 030045, China |
|
|
|
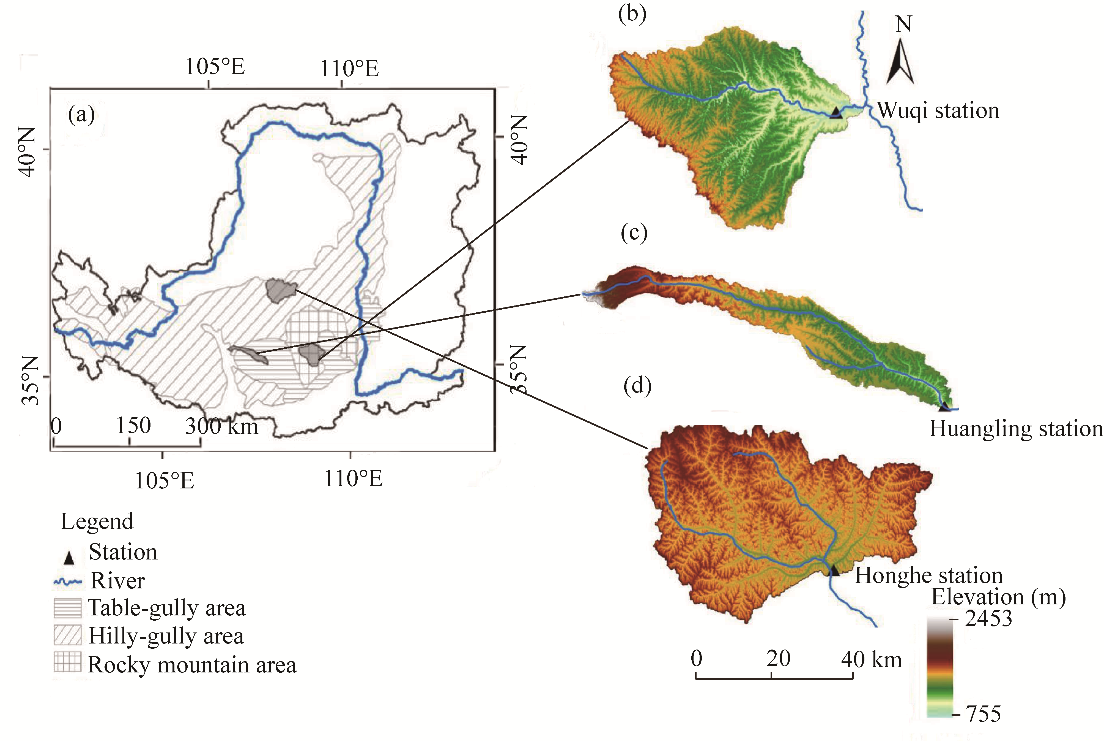
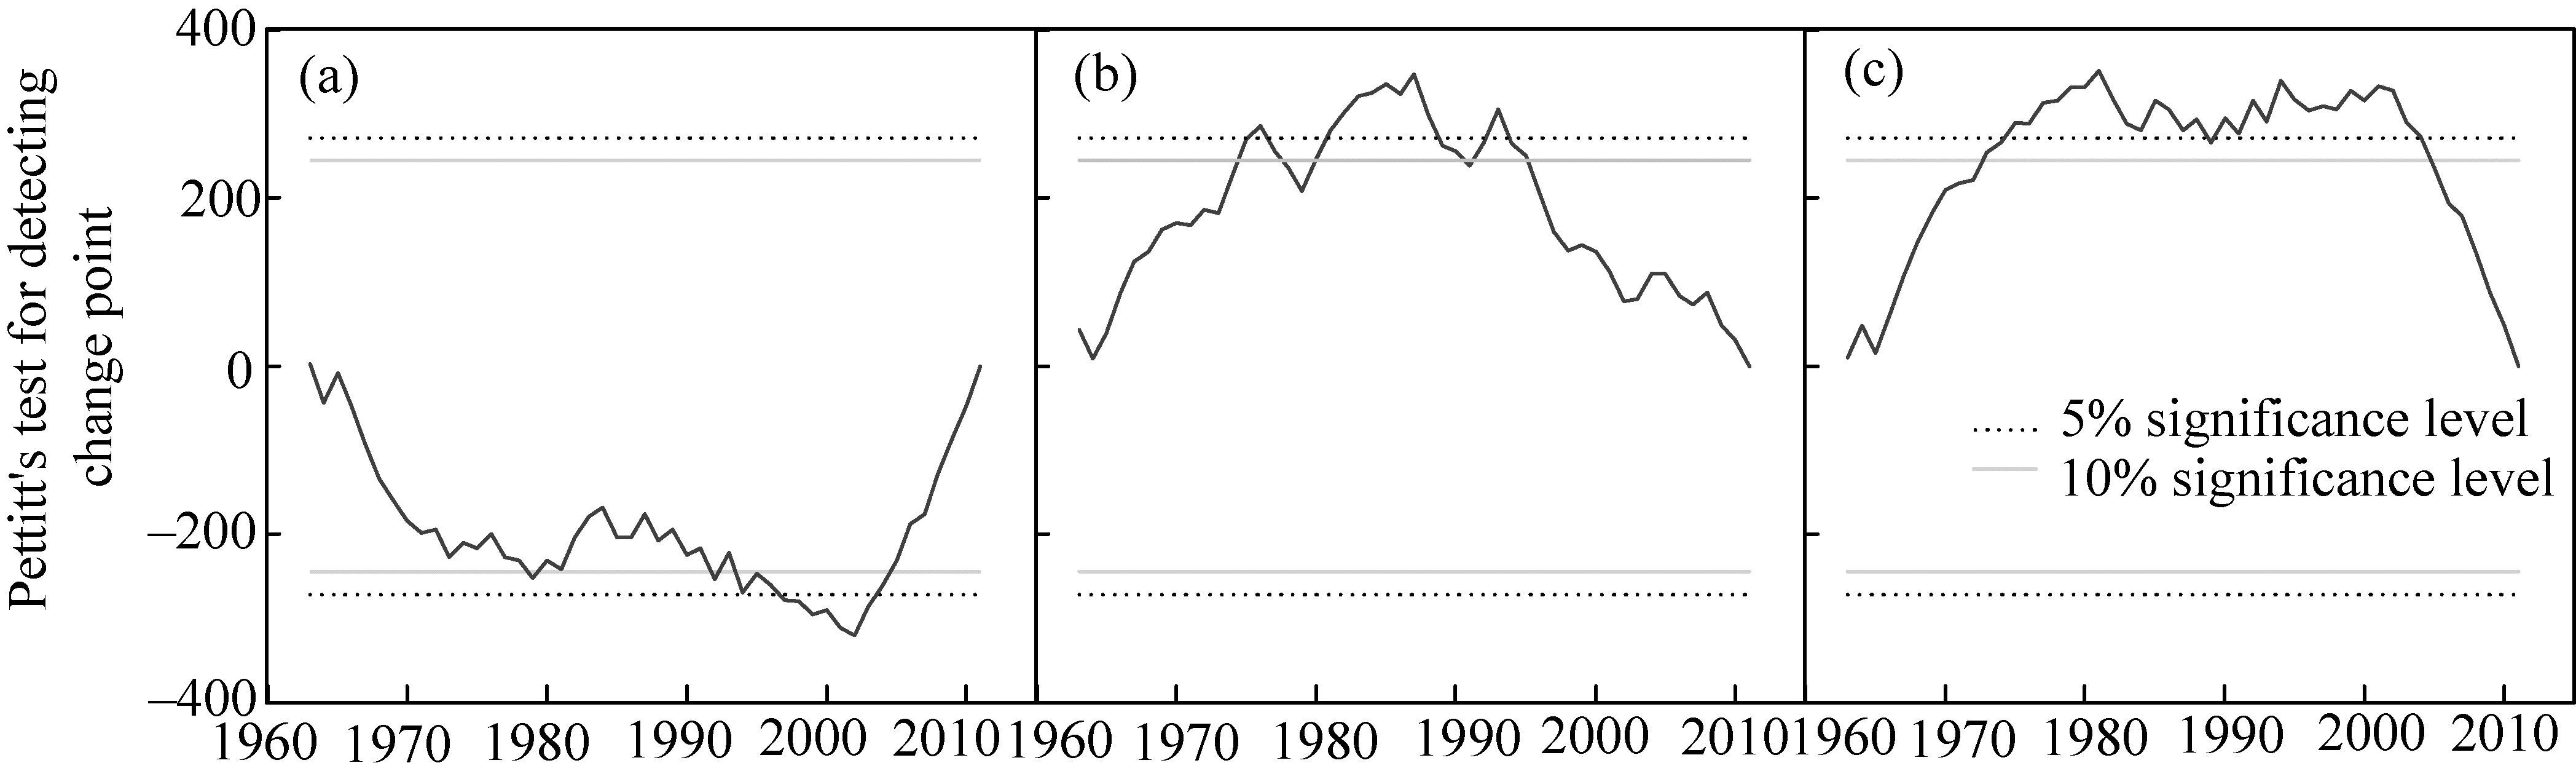
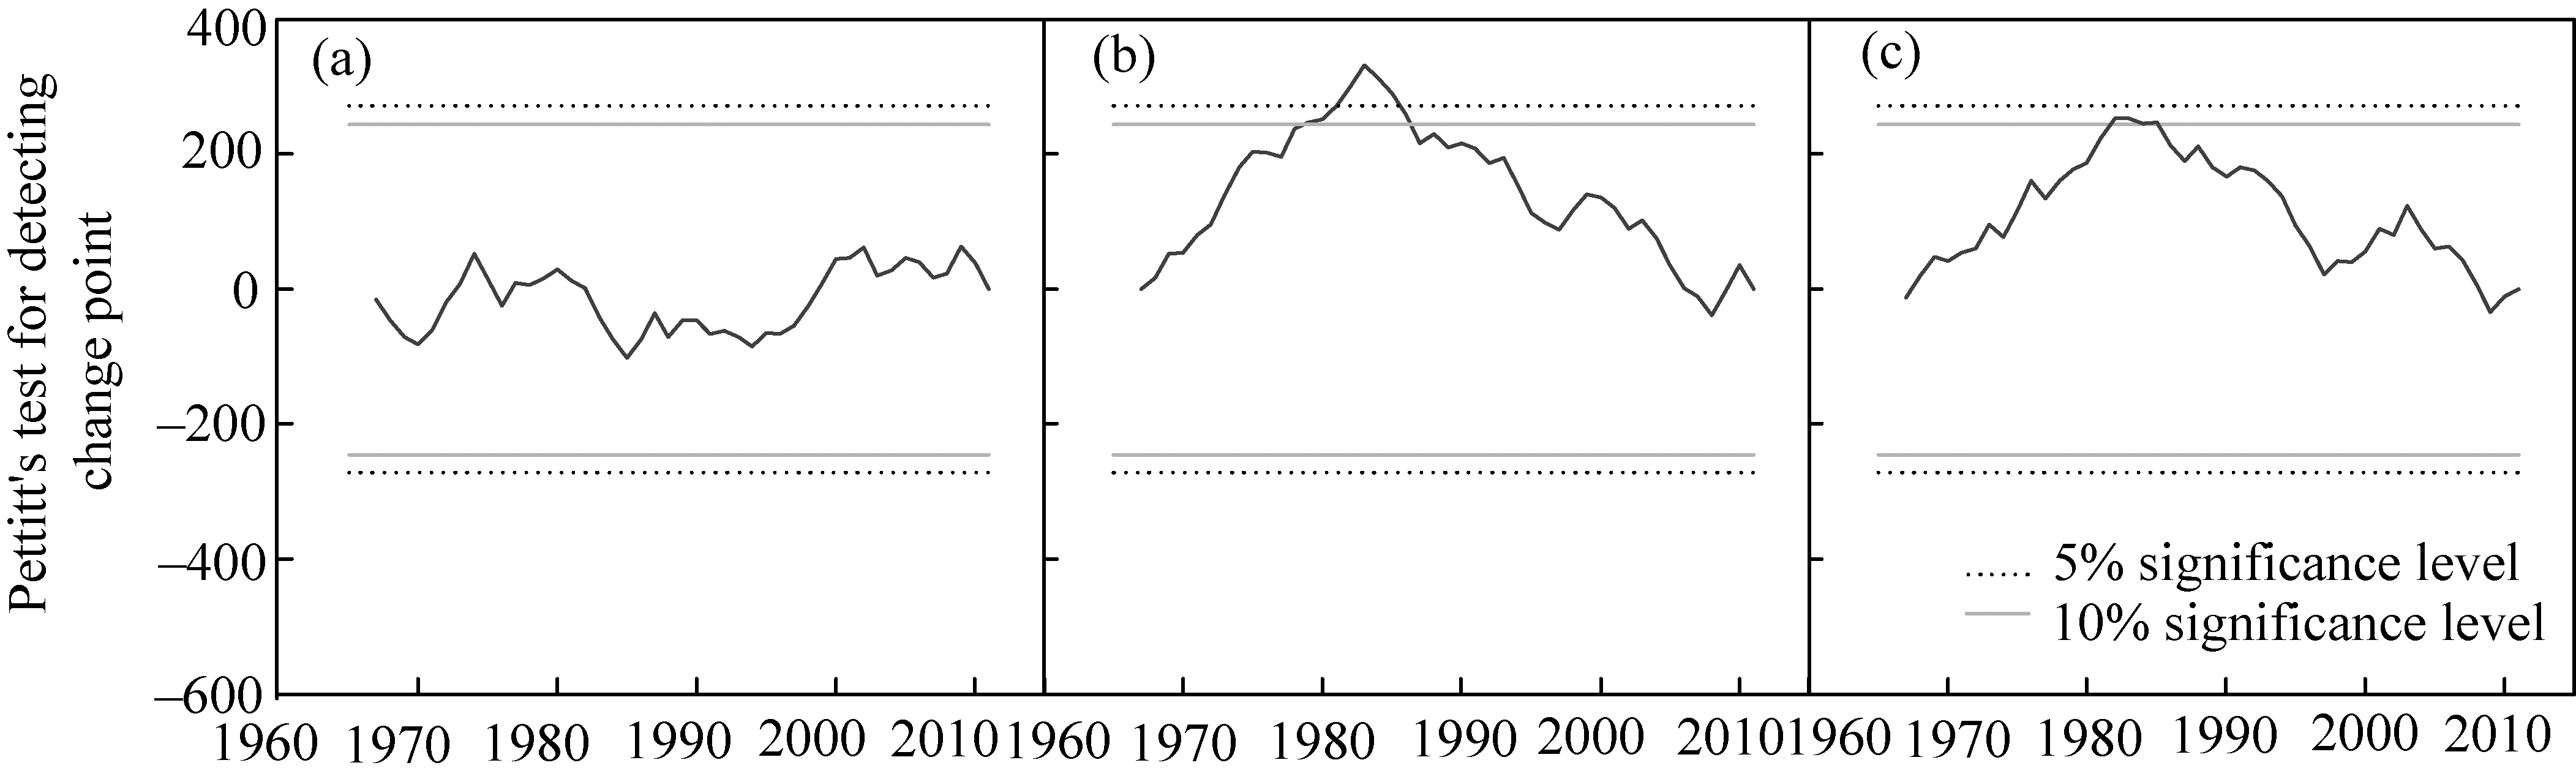
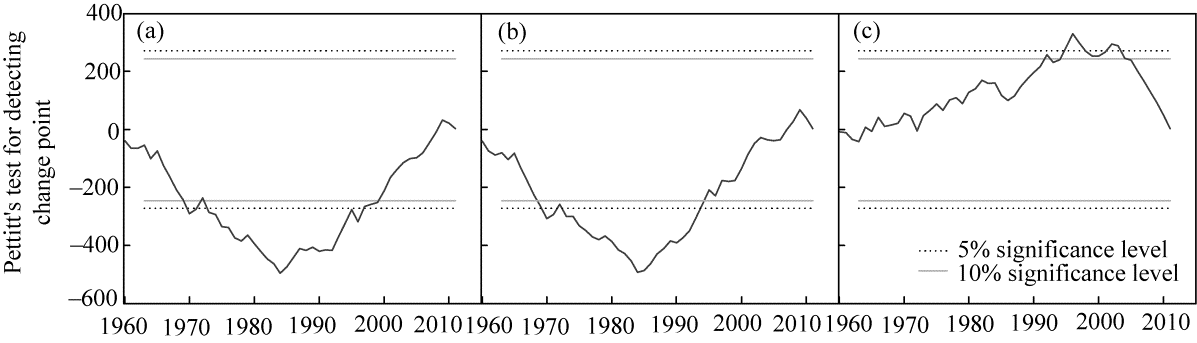
Abstract The Chinese Loess Plateau is known as one of the most severe soil erosion regions in the world. Two ecological restoration projects, i.e., the integrated soil conservation project since the 1970s and the ''Grain for Green'' project since 1999, have been progressively implemented to control the soil erosion in this area. Ecological restoration has greatly changed flow regime over the past five decades. However, the mechanism of how flow regime responds to ecological restoration among landforms remains poorly understood. In this study, we investigated the temporal dynamics of flow regime in three catchments, i.e., Wuqi, Honghe and Huangling hydrological stations, respectively representing the loess hilly-gully, loess table-gully and rocky mountain (covered by secondary forest) areas in the Chinese Loess Plateau, using daily hydrological data during the 1960s-2010s. The nonparametric Mann-Kendall test, Pettitt's test and daily flow series were used to investigate the changes of flow regime. Significantly negative trends of annual streamflow were detected at the Wuqi and Honghe stations, except for the Huangling station. The annual baseflow at the Wuqi station showed a significantly positive trend whereas a significantly negative trend was observed at the Honghe station, and there was no significant trend at the Huangling station. It was interesting that baseflow index significantly increased during the whole period in all catchments. However, the trends and change points of daily flow series derived by different percentages of exceedance and extreme series in different consecutive days varied among individuals. Based on the change points analysis of annual streamflow, we divided data series into three periods, i.e., the baseline period (from 1959 and 1963 to 1979, PI), the integrated soil conservation period (1980-1999, PII) and the ''Grain for Green'' period (2000-2011, PIII). We found that streamflow decreased due to the reduction of high streamflow (exceeding 5% of time within a year) and median streamflow (50%) in PII and PIII at the Wuqi and Honghe stations. However, low flow (95%) increased in PII and PIII at the Wuqi station while decreased at the Honghe station. Streamflow change at the Huangling station was more stable, thus potentially resulting in much less soil erosion in the forestry area than in the other areas. The great improvement in ecological environment on the Chinese Loess Plateau revealed the advantages of ecological restoration in reducing flood amount and compensating streamflow at a regional scale.
|
|
Received: 03 August 2018
Published: 10 February 2020
|
|
Corresponding Authors:
|
| About author: *Corresponding author: QI Shi (E-mail: qishi@bjfu.edu.cn) |
|
|
| [1] |
Cai Q G. 2001. Soil erosion and management on the Loess Plateau. Journal of Geographical Sciences, 11(1): 53-70.
|
|
|
| [2] |
Du H Q, Xue X, Wang T. 2014. Estimation of the quantity of aeolian saltation sediments blown into the Yellow River from the Ulanbuh Desert, China. Journal of Arid Land, 6(2): 205-218.
|
|
|
| [3] |
Gao P, Jiang G T, Wei Y P, et al. 2015. Streamflow regimes of the Yanhe River under climate and land use change, Loess Plateau, China. Hydrological Processes, 29(10), 2402-2413.
|
|
|
| [4] |
Gao Z L, Fu Y L, Li Y H, et al. 2012. Trends of streamflow, sediment load and their dynamic relation for the catchments in the middle reaches of the Yellow River over the past five decades. Hydrology and Earth System Sciences, 9(4): 5487-5516.
|
|
|
| [5] |
Hirsch R M. 2010. Statistical methods and sampling design for estimating step trends in surface-water quality. Journal of the American Water Resources Association, 24(3): 493-503.
|
|
|
| [6] |
Nian Y Y, Li X, Zhou J, et al. 2014. Impact of land use change on water resource allocation in the middle reaches of the Heihe River Basin in northwestern China. Journal of Arid Land, 6(3): 273-286.
|
|
|
| [7] |
Nie W M, Yuan Y P, Kepner W, et al. 2011. Assessing impacts of land use and land cover changes on hydrology for the upper San Pedro watershed. Journal of Hydrology, 407(1-4): 105-114.
|
|
|
| [8] |
Pettitt A N. 1979. A non-parametric approach to the change-point problem. Journal of the Royal Statistical Society, 28(2): 126-135.
|
|
|
| [9] |
Qin W, Zhu Q K, Liu G Q, et al. 2010. Regulation effects of runoff and sediment of ecological conservation in the upper reaches of Beiluo River. Journal of Hydraulic Engineering, 41(11): 1325-1332.
|
|
|
| [10] |
Ran L S, Lu X X, Xin Z B, et al. 2013. Cumulative sediment trapping by reservoirs in large river basins: a case study of the Yellow River basin. Global and Planetary Change, 100(1): 308-319.
|
|
|
| [11] |
Scott D F, Smith R E. 1997. Preliminary empirical models to predict reductions in total and low flows resulting from afforestation. Forestry, 23(2): 135-140.
|
|
|
| [12] |
Sen P K. 1965. Some non-parametric tests for m-dependent time series. Journal of the American Statistical Association, 60(309): 134-147.
|
|
|
| [13] |
Shi C X, Dian Z, You L Y. 2002. Changes in sediment yield of the Yellow River basin of China during the Holocene. Geomorphology, 46(3-4): 267-283.
|
|
|
| [14] |
Shi H, Shao M A. 2000. Soil and water loss from the Loess Plateau in China. Journal of Arid Environments, 45(1): 9-20.
|
|
|
| [15] |
Wan L, Zhang X P, Ma Q, et al. 2014. Spatiotemporal characteristics of precipitation and extreme events on the Loess Plateau of China between 1957 and 2009. Hydrological Processes, 28(18): 4971-4983.
|
|
|
| [16] |
Wang G Q, Zhang J Y, Pagano T C, et al. 2013. Identifying contributions of climate change and human activity to changes in runoff using epoch detection and hydrologic simulation. Journal of Hydrologic Engineering, 18(11): 1385-1392.
|
|
|
| [17] |
Wang Y, Shao M A, Liu Z. 2013. Vertical distribution and influencing factors of soil water content within 21-m profile on the Chinese Loess Plateau. Geoderma, 193-194: 300-310.
|
|
|
| [18] |
Wang Y F, Fu B J, Chen L D, et al. 2011. Check dam in the Loess Plateau of China: engineering for environmental services and food security. Environmental Science and Technology, 45(24): 10298-10299.
|
|
|
| [19] |
Xu J. 1998. A study of physico-geographical factors for formation of hyperconcentrated flows in the Loess Plateau of China. Geomorphology, 24(2-3): 245-255.
|
|
|
| [20] |
Xu X Z, Zhang H W, Zhang O Y. 2004. Development of check-dam systems in gullies on the Loess Plateau, China. Environmental Science and Policy, 7(2): 79-86.
|
|
|
| [21] |
Yuan Y Z, Zhang Z D, Meng J H. 2015. Impact of changes in land use and climate on the runoff in Liuxihe Watershed based on SWAT model. The Journal of Applied Ecology, 26(4): 989-998. (in Chinese)
|
|
|
| [22] |
Zhang J J, Zhang T T, Lei Y N, et al. 2016. Streamflow regime variations following ecological management on the Loess Plateau, China. Forests, 7(1): 6.
|
|
|
| [23] |
Zhang J J, Zhang X P, Li R, et al. 2017. Did streamflow or suspended sediment concentration changes reduce sediment load in the middle reaches of the Yellow River? Journal of Hydrology, 546: 357-369.
|
|
|
| [24] |
Zhang, J J, Gao G Y, Fu B J, et al. 2018. Explanation of climate and human impacts on sediment discharge change in Darwinian hydrology: derivation of a differential equation. Journal of Hydrology, 559: 827-834.
|
|
|
| [25] |
Zhang K, Li L, Bai P, et al. 2017. Influence of climate variability and human activities on stream flow variation in the past 50 years in Taoer River, Northeast China. Journal of Geographical Sciences, 27(4): 481-496.
|
|
|
| [26] |
Zhang M, Wei X. 2012. The effects of cumulative forest disturbance on streamflow in a large watershed in the central interior of British Columbia, Canada. Hydrology and Earth System Sciences, 16(7): 2021-2034.
|
|
|
| [27] |
Zhang S H, Liu S X, Mo X G, et al. 2010. Impacts of precipitation variation and soil and water conservation measures on runoff and sediment yield in the Wuding River Basin, middle reaches of the Yellow River. Journal of Beijing Forestry University, 32(4): 161-168. (in Chinese)
|
|
|
| [28] |
Zhang X P, Zhang L, Zhao J, et al. 2008. Responses of streamflow to changes in climate and land use/cover in the Loess Plateau, China. Water Resources Research, 44(7): 2183-2188.
|
|
|
| [29] |
Zhao F F, Zhang L, Xu Z X, et al. 2010. Evaluation of methods for estimating the effects of vegetation change and climate variability on streamflow. Water Resources Research, 46(3): 742-750.
|
|
|
| [30] |
Zhao G J, Mu X M, Tian P, et al. 2013. Climate changes and their impacts on water resources in semiarid regions: a case study of the Wei River basin, China. Hydrological Processes, 27(26): 3852-3863.
|
|
|
| [31] |
Zhao G J, Tian P, Mu X M, et al. 2014. Quantifying the impact of climate variability and human activities on streamflow in the middle reaches of the Yellow River basin, China. Journal of Hydrology, 519: 387-398.
|
|
|
|
Viewed |
|
|
|
Full text
|
|
|
|
|
Abstract
|
|
|
|
|
Cited |
|
|
|
|
| |
Shared |
|
|
|
|
| |
Discussed |
|
|
|
|