| Research article |
|


|
|
|
| Change features of time-series climate variables from 1962 to 2016 in Inner Mongolia, China |
XU Lili1,2,*( ), YU Guangming1,2, ZHANG Wenjie3,4, TU Zhenfa1,2, TAN Wenxia1,2 ), YU Guangming1,2, ZHANG Wenjie3,4, TU Zhenfa1,2, TAN Wenxia1,2 |
1 Key Laboratory for Geographical Process Analysis & Simulation of Hubei Province, Central China Normal University, Wuhan 430079, China;
2 College of Urban and Environmental Sciences, Central China Normal University, Wuhan 430079, China
3 State Key Laboratory of Resources and Environmental Information System, Institute of Geographic Sciences and Natural Resources Research, Beijing 100101, China
4 Plant Functional Biology and Climate Change Cluster (C3), University of Technology Sydney, NSW 2007, Australia |
|
|
|
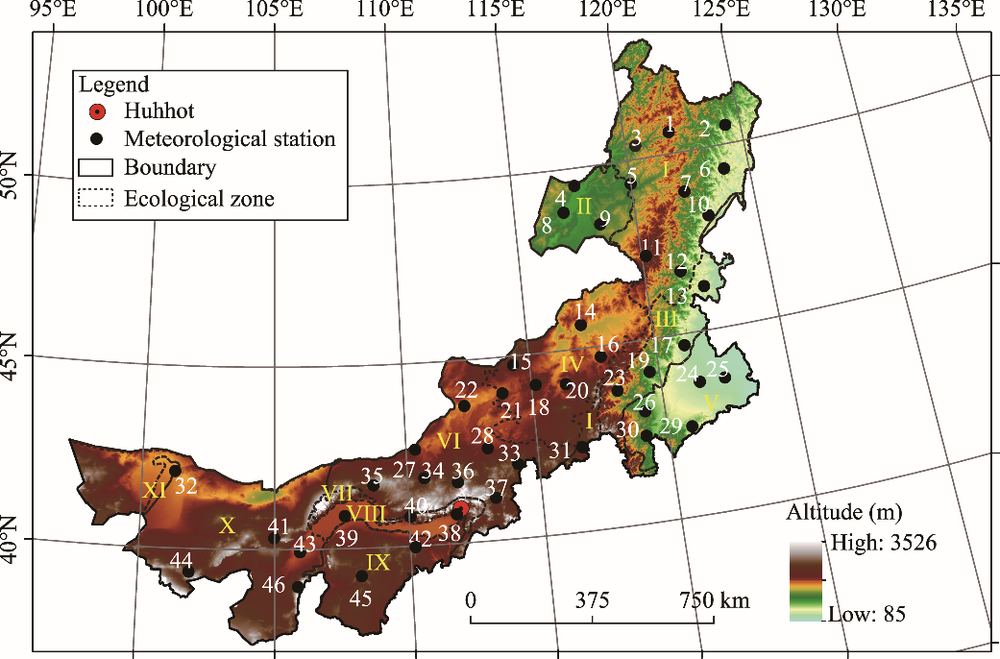
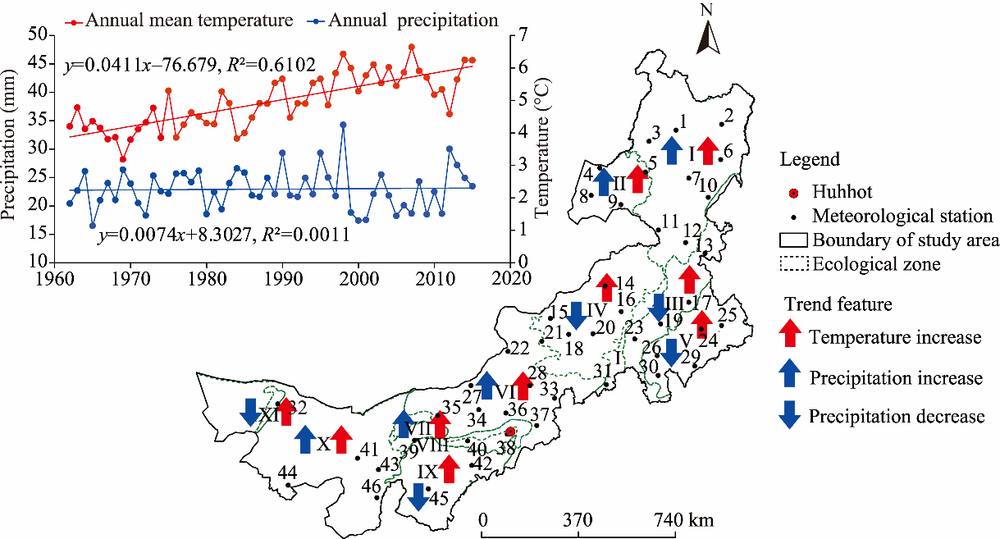
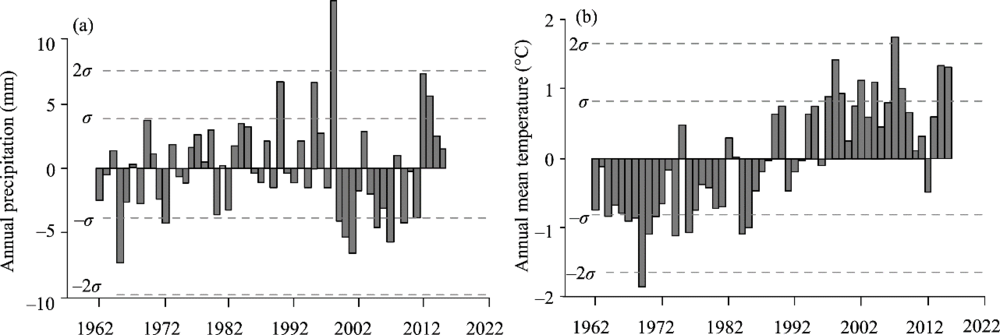
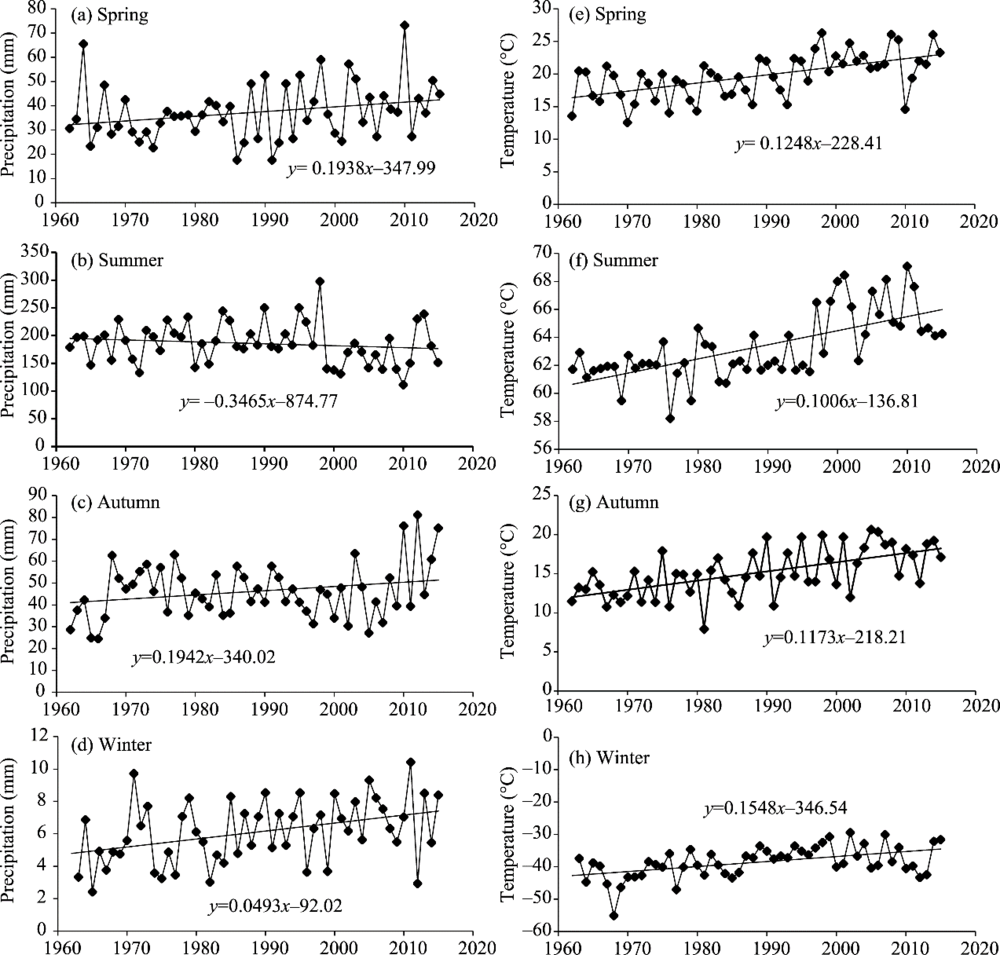
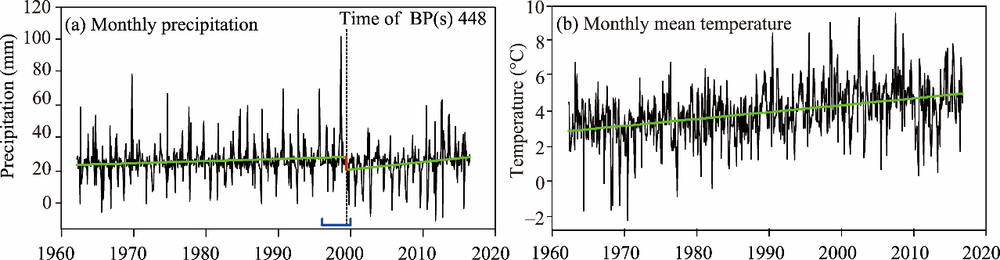
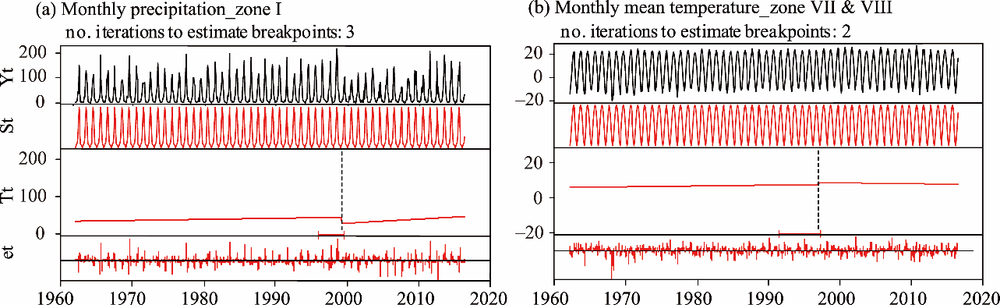
Abstract Detecting change features of climate variables in arid/semi-arid areas is essential for understanding related climate change patterns and the driving and evolution mechanism between climate and arid/semi-arid ecosystems. This paper takes Inner Mongolia of China, a unique arid/semi-arid ecosystem, as the study area. We first detected trend features of climate variables using the linear trend analysis method and then detected their trend-shift features using the breaks for additive seasonal and trend method based on the time-series of monthly precipitation and monthly mean temperature datasets from 1962 to 2016. We analyzed the different change features of precipitation and temperature on a regional scale and in different ecological zones to discover the spatial heterogeneity of change features. The results showed that Inner Mongolia has become warmer-wetter during the past 54 years. The regional annual mean temperature increased 0.4°C per decade with a change rate of 56.2%. The regional annual precipitation increased 0.07 mm per decade with a slightly change rate of about 1.7%, but the trend was not statistically significant. The warmer trend was contributed by the same positive trend in each season, while the wetter trend was contributed by the negative trend of the summer precipitation and the positive trend of the other three seasons. The regional monthly precipitation series had a trend-shift pattern with a structural breakpoint in the year 1999, while the regional monthly mean temperature series showed an increasing trend without a periodical trend-shift. After the year 2000, the warmer-wetter trend of the climate in Inner Mongolia was accelerated. The late 20th century was a key period, because the acceleration of the wetter trend in some local zones (I and II) and the alleviation of the warmer trend in some local zones (VII, VIII and IX) occurred simultaneously. Moreover, the change features had a strong spatial heterogeneity, the southeastern and southwestern of Inner Mongolia went through a warmer-drier trend compared with the other areas. The spatio-temporal heterogeneity of the climate change features is a necessary background for various types of research, such as regional climate change, the evolution of arid/semi-arid ecosystems, and the interaction mechanisms between climate and arid/semi-arid ecosystems based on earth-system models in Inner Mongolia.
|
|
Received: 08 April 2018
Published: 10 February 2020
|
|
Corresponding Authors:
|
| About author: *Corresponding author: XU Lili (E-mail: xulls@mail.ccnu.edu.cn) |
|
|
| [1] |
An L J. 2015. Variations in autumn temperature in Inner Mongolia and circulation characteristics of abnormal low temperature types during 1961-2012. Desert and Oasis Meteorology, 9(6): 34-39. (in Chinese)
|
|
|
| [2] |
Bai J, Perron P. 2003. Computation and analysis of multiple structural change models. Journal of Applied Econometrics, 18(1): 1-22.
|
|
|
| [3] |
Bao Y, Li X B, Li C. 2010. Spatial-temporal distribution characteristics of temperature in Inner Mongolia during 1961-2007. Journal of Arid Land Resources and Environment, 24(12): 80-84. (in Chinese)
|
|
|
| [4] |
Bhandari J, Pan X, Bijaya G C D. 2015. Spatial and seasonal variation in rain use efficiency in semiarid grasslands of Inner Mongolia. Advances in Meteorology, 917415, doi:10.1155/2015/917415.
|
|
|
| [5] |
Charles J. 2012. Global weirdness: severe storms, deadly heat waves, relentless drought, rising seas, and the weather of the future. Reports of the National Center for Science Education, 33(4): 6.
|
|
|
| [6] |
Chen H, Shao L, Zhao M, et al. 2017. Grassland conservation programs, vegetation rehabilitation and spatial dependency in Inner Mongolia, China. Land Use Policy, 64: 429-439.
|
|
|
| [7] |
Chen X, Li B L, LI Q, et al. 2012. Spatio-temporal pattern and changes of evapotranspiration in arid Central Asia and Xinjiang of China. Journal of Arid Land, 4(1): 105-112.
|
|
|
| [8] |
Chen Z, Zhang X, He X, et al. 2013. Extension of summer (June-August) temperature records for northern Inner Mongolia (1715-2008), China using tree rings. Quaternary International, 283(2): 21-29.
|
|
|
| [9] |
Cleveland R B, Cleveland W S, McRae J E, et al. 1990. STL: A seasonal-trend decomposition procedure based on loess. Journal of Official Statistics, 6(1): 3-33.
|
|
|
| [10] |
Dufresne J L, Foujols M A, Denvil S, et al. 2013. Climate change projections using the IPSL-CM5 earth system model: from CMIP3 to CMIP5. Climate Dynamics, 40(9-10): 2123-2165.
|
|
|
| [11] |
Fisher R A, Koven C D, Anderegg W, et al. 2017. Vegetation demographics in earth system models: a review of progress and priorities. Global Change Biology, 24(1): 35-54.
|
|
|
| [12] |
Geng Q, Wu P, Zhao X. 2016. Spatial and temporal trends in climatic variables in arid areas of Northwest China. International Journal of Climatology, 36(12): 4118-4129.
|
|
|
| [13] |
Guo L, Wu S, Zhao D, et al.2014. NDVI-Based vegetation change in Inner Mongolia from 1982 to 2006 and its relationship to climate at the biome scale. Advances in Meteorology, 2014: 79-92.
|
|
|
| [14] |
Han F, Zang Q, Buyantuev A, et al. 2015. Effects of climate change on phenology and primary productivity in the desert steppe of Inner Mongolia. Journal of Arid Land, 7(2): 251-263.
|
|
|
| [15] |
Harrison S P, Laforgia M L, Latimer A M. 2018. Climate-driven diversity change in annual grasslands: drought plus deluge does not equal normal. Global Change Biology, 24(4): 1782-1792.
|
|
|
| [16] |
Hartmann D L, Klein Tank, A M G, Rusticucci M, et al. 2013: Observations: Atmosphere and Surface. In: Qin T F, Plattner D, Tignor M, et al. Climate Change 2013-The Physical Science Basis. Cambridge: Cambridge University Press.159-254
|
|
|
| [17] |
Holling C S. 1973. Resilience and stability of ecological systems. Annual Review of Ecology and Systematics, 4(4): 1-23.
|
|
|
| [18] |
Hu Q, Pan F, Pan X, et al. 2015. Spatial analysis of climate change in Inner Mongolia during 1961-2012, China. Applied Geography, 60: 254-260.
|
|
|
| [19] |
Hu Y, Wang S, Song X, et al. 2017. Precipitation changes in the mid-latitudes of the Chinese mainland during 1960-2014. Journal of Arid Land, 9(6): 924-937.
|
|
|
| [20] |
Huang J, Xue Y, Sun S, et al. 2015a. Spatial and temporal variability of drought during 1960-2012 in Inner Mongolia, North China. Quaternary International, 355: 134-144.
|
|
|
| [21] |
Huang J, Ji M, Xie Y, et al. 2015b. Global semi-arid climate change over last 60 years. Climate Dynamics, 46(3-4): 1131-1150.
|
|
|
| [22] |
Huang J, Yu H, Guan X, et al. 2016. Accelerated dryland expansion under climate change. Nature Climate Change, 6(2): 166-172.
|
|
|
| [23] |
Huang J, Yu H, Dai A, et al. 2017. Drylands face potential threat under 2°C global warming target. Nature Climate Change, 7(6): 417-422.
|
|
|
| [24] |
Jong R D, Verbesselt J, Zeileis A, et al. 2013. Shifts in global vegetation activity trends. Remote Sensing, 5(3): 1117-1133.
|
|
|
| [25] |
Leng G, Tang Q, Rayburg S. 2015. Climate change impacts on meteorological, agricultural and hydrological droughts in China. Global and Planetary Change, 126(126): 23-34.
|
|
|
| [26] |
Li A, Wu J, Huang J. 2012. Distinguishing between human-induced and climate-driven vegetation changes: a critical application of RESTREND in Inner Mongolia. Landscape Ecology, 27(7): 969-982.
|
|
|
| [27] |
Liu Q S, Liu G H, Huang C. 2018. Monitoring desertification processes in Mongolian Plateau using MODIS tasseled cap transformation and TGSI time series. Journal of Arid Land, 10(1): 12-26.
|
|
|
| [28] |
Maestre F T, Cortina J. 2002. Spatial patterns of surface soil properties and vegetation in a Mediterranean semi-arid steppe. Plant and Soil, 241(2): 279-291.
|
|
|
| [29] |
Mahoney J R, Patrinos A, Schafer J, et al. 2004. Strategic plan for the U.S. climate change science program climate change: science program and the subcommittee on global change research. Environmental Policy Collection, 74(4): 1-6.
|
|
|
| [30] |
Mora C, Dousset B, Caldwell I R, et al. 2017. Global risk of deadly heat. Nature Climate Change, 7(7): 501-506.
|
|
|
| [31] |
Peng S, Piao S, Shen Z, et al. 2013. Precipitation amount, seasonality and frequency regulate carbon cycling of a semi-arid grassland ecosystem in Inner Mongolia, China: a modeling analysis. Agricultural and Forest Meteorology, 178-179(4): 46-55.
|
|
|
| [32] |
Qin F, Jia G, Yang J, et al. 2018. Spatiotemporal variability of precipitation during 1961-2014 across the Mongolian Plateau. Journal of Mountain Science, 15(5): 992-1005.
|
|
|
| [33] |
R Core Team. 2017. R: A language and environment for statistical computing. R Foundation for Statistical Computing, Vienna, Austria. [2018-02-21]. .
|
|
|
| [34] |
Shao L, Chen H, Zhang C, et al. 2017. Effects of major grassland conservation programs implemented in Inner Mongolia since 2000 on vegetation restoration and natural and anthropogenic disturbances to their success. Sustainability, 9(3): 466.
|
|
|
| [35] |
Suld B. 2015. Charactersitics of the climate change and the impact on NDVI in Inner Mongolia Grassland. MSc Thesis. Huhhot: Inner Mongolia University. (in Chinese)
|
|
|
| [36] |
Tong S Q, Zhang J Q, Bao Y H, et al. 2017. Spatial and temporal variations of vegetation cover and the relationships with climate factors in Inner Mongolia based on GIMMS NDVI3g data. Journal of Arid Land, 9(3): 394-407.
|
|
|
| [37] |
Verbesselt J, Hyndman R, Zeileis A, et al. 2010a. Phenological change detection while accounting for abrupt and gradual trends in satellite image time series. Remote Sensing of Environment, 114(12): 2970-2980.
|
|
|
| [38] |
Verbesselt J, Hyndman R, Newnham G, et al. 2010b. Detecting trend and seasonal changes in satellite image time series. Remote Sensing of Environment, 114(1): 106-115.
|
|
|
| [39] |
Verbesselt J, Zeileis A, Herold M. 2012. Near real-time disturbance detection using satellite image time series. Remote Sensing of Environment, 123(123): 98-108.
|
|
|
| [40] |
Wang Z, Li J, Lai C, et al. 2017. Does drought in China show a significant decreasing trend from 1961 to 2009?. Science of the Total Environment, 579: 314-324.
|
|
|
| [41] |
Wu J S, Feng Y F, Zhang X Z, et al. 2017. Grazing exclusion by fencing non-linearly restored the degraded alpine grasslands on the Tibetan Plateau. Scientific Reports, 7: 15202.
|
|
|
| [42] |
Xu L, Li B, Yuan Y, et al. 2016. Detecting different types of directional land cover changes using MODIS NDVI time series dataset. Remote Sensing, 8(6): 495.
|
|
|
| [43] |
Xu L, Tu Z, Zhou Y, et al. 2018. Profiling human-induced vegetation change in the horqin sandy land of China using time series datasets. Sustainability, 10(4): 1068.
|
|
|
| [44] |
Yang K, Hui W, Jun Q, et al. 2014. Recent climate changes over the Tibetan Plateau and their impacts on energy and water cycle: a review. Global and Planetary Change, 112: 79-91.
|
|
|
| [45] |
Yao J, Zhao Y, Chen Y, et al. 2018. Multi-scale assessments of droughts: a case study in Xinjiang, China. Science of the Total Environment, 630: 444.
|
|
|
| [46] |
You L, Dai X, Zhang Y. 2010. Extreme precipitation events in Inner Mongolia in 1961-2008. Advances in Climate Change Research, 6(6): 411-416.
|
|
|
| [47] |
Zeileis A, Leisch F, Hornik K, et al. 2001. Strucchange: an R package for testing for structural change in linear regression models. Journal of Statistical Software, 7(2): 1-38.
|
|
|
| [48] |
Zeileis A. 2005. A unified approach to structural change tests based on ML scores, F statistics, and OLS residuals. Econometric Reviews, 24(4): 445-466.
|
|
|
| [49] |
Zeileis A, Leisch F, Kleiber C, et al. 2005. Monitoring structural change in dynamic econometric models. Journal of Applied Econometrics, 20(1): 99-121.
|
|
|
| [50] |
Zhang C, Lu D, Chen X, et al. 2016. The spatiotemporal patterns of vegetation coverage and biomass of the temperate deserts in Central Asia and their relationships with climate controls. Remote Sensing of Environment, 175: 271-281.
|
|
|
| [51] |
Zhang L, Karthikeyan R, Bai Z, et al. 2018. Spatial and temporal variability of temperature, precipitation, and streamflow in upper Sang-kan basin, China. Hydrological Processes, 31(2): 279-295.
|
|
|
| [52] |
Zhao Y, Ma M, Li X. 2012. Nutritional value and amino acid content of four grasses in eastern Inner Mongolia. Journal of Animal and Veterinary Advances, 11(21): 3928-3936.
|
|
|
|
Viewed |
|
|
|
Full text
|
|
|
|
|
Abstract
|
|
|
|
|
Cited |
|
|
|
|
| |
Shared |
|
|
|
|
| |
Discussed |
|
|
|
|