| Research article |
|


|
|
|
| Improving wood volume predictions in dry tropical forest in the semi-arid Brazil |
Robson B de LIMA1,*( ), Patrícia A B BARRETO-GARCIA2, Alessandro de PAULA2, Jhuly E S PEREIRA3, Flávia F de CARVALHO2, Silvio H M GOMES4 ), Patrícia A B BARRETO-GARCIA2, Alessandro de PAULA2, Jhuly E S PEREIRA3, Flávia F de CARVALHO2, Silvio H M GOMES4 |
1Department of Forest Engineering, State University of Amapá, Macapá 68900070, Brazil
2Department of Forest Science, State University of Southwest Bahia, Vitória da Conquista 45083900, Brazil
3Universidade Federal de Lavras, Lavras 37200900, Brazil
4Universidade de S?o Paulo, Piracicaba 13418900, Brazil |
|
|
|
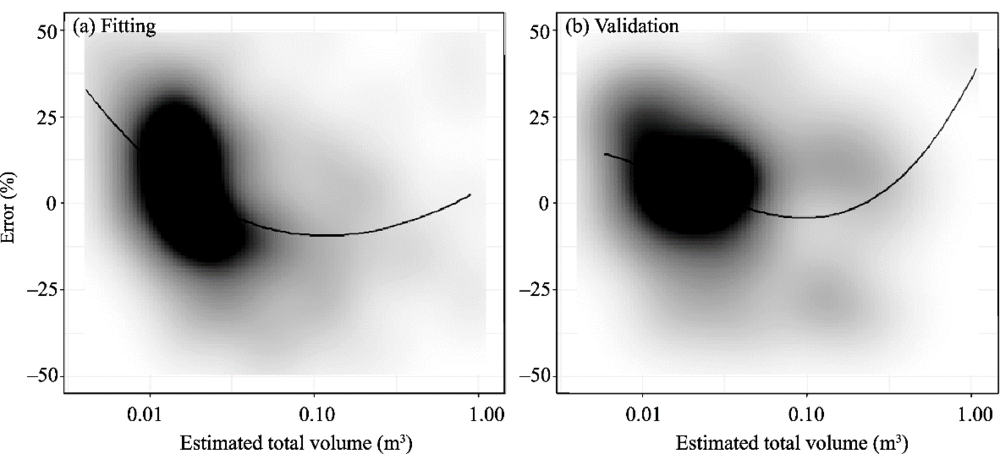
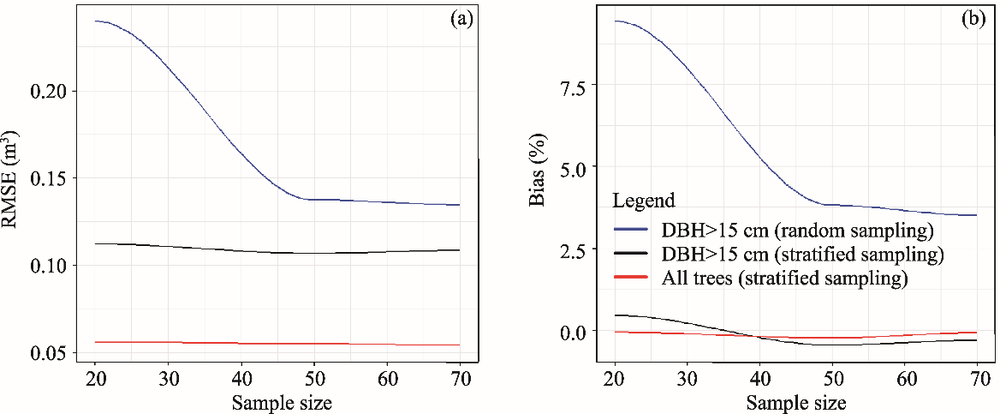
Abstract The volumetric variability of dry tropical forests in Brazil and the scarcity of studies on the subject show the need for the development of techniques that make it possible to obtain adequate and accurate wood volume estimates. In this study, we analyzed a database of thinning trees from a forest management plan in the Contendas de Sincorá National Forest, southwestern Bahia State, Brazil. The data set included a total of 300 trees with a trunk diameter ranging from 5 to 52 cm. Adjustments, validation and statistical selection of four volumetric models were performed. Due to the difference in height values for the same diameter and the low correlation between both variables, we do not suggest models which only use the diameter at breast height (DBH) variable as a predictor because they accommodate the largest estimation errors. In comparing the best single entry model (Hohenald-Krenn) with the Spurr model (best fit model), it is noted that the exclusion of height as a predictor causes the values of 136.44 and 0.93 for Akaike information criterion (AIC) and adjusted determination coefficient (R2 adj), which are poorer than the second best model (Schumacher-Hall). Regarding the minimum sample size, errors in estimation (root mean square error (RMSE) and bias) of the best model decrease as the sample size increases, especially when a larger number of trees with DBH≥15.0 cm are randomly sampled. Stratified sampling by diameter class produces smaller volume prediction errors than random sampling, especially when considering all trees. In summary, the Spurr and Schumacher-Hall models perform better. These models suggest that the total variance explained in the estimates is not less than 95%, producing reliable forecasts of the total volume with shell. Our estimates indicate that the bias around the average is not greater than 7%. Our results support the decision to use regression methods to build models and estimate their parameters, seeking stratification strategies in diameter classes for the sample trees. Volume estimates with valid confidence intervals can be obtained using the Spurr model for the studied dry forest. Stratified sampling of the data set for model adjustment and selection is necessary, since we find significant results with mean error square root values and bias of up to 70% of the total database.
|
|
Received: 07 July 2020
Published: 10 November 2020
|
|
Corresponding Authors:
|
About author: *Robson B de LIMA (E-mail: rbl_florestal@yahoo.com.br)
|
|
|
| [1] |
Abreu J C, Silva J A A, Ferreira R L C, et al. 2016. Setting linear and nonlinear mathematical models for biomass estimate and nutrients in Anadenanthera colubrina var. cebil in the semiarid region of Pernambuco. Scientia Forestalis, 44(111):739-750. (in Brazilian)
|
|
|
| [2] |
Albuquerque U P, Araújo E L, El-Deir A C A, et al. 2012. Caatinga revisited: ecology and conservation of an important seasonal dry forest. Scientific World Journal, 2012: e205182, doi: 10.1100/2012/205182.
|
|
|
| [3] |
Alvares C A, Stape J L, Sentelhas P C, et al. 2013. Köppen climate classification map for Brazil. Meteorologische Zeitschrift, 22(6):711-728. (in Brazilian)
|
|
|
| [4] |
Araújo L V C, Silva J A. 2010. Belo Horizonte farm experimental unit-Mossoró/RN. In: Gariglio M A, Sampaio E V S B, Cestaro L A, et al. Sustainable Use and Conservation of Caatinga Forest Resources. Brazilian Forest Service, 205-214. (in Brazilian)
|
|
|
| [5] |
Basuki T M, van Laake P E, Skidmore A K, et al. 2009. Allometric equations for estimating the above-ground biomass in tropical lowland Dipterocarp forests. Forest Ecology and Management, 257(8):1684-1694.
|
|
|
| [6] |
Berger A, Gschwantner T, Mcroberts R E, et al. 2014. Effects of measurement errors on individual tree stem volume estimates for the Austrian national forest inventory. Forest Science, 60(1):14-24.
|
|
|
| [7] |
Brando P. 2018. Tree height matters. Nature Geoscience, 11(1):390-391.
|
|
|
| [8] |
Brasil. 2006. Normative Instruction, No. 5 of December 11. Provides for technical procedures for the preparation, execution and technical evaluation of sustainable forest management plans. [2020-04-24]. https://www.mma.gov.br/estruturas/pnf/_arquivos/in%20mma%2004-06.pdf. (in Brazilian)
|
|
|
| [9] |
Brazilian Institute of Geography and Statistics. 2012. Technical Manual of the Brazilian vegetation (2nd) . Rio de Janeiro, Brazil, 271. (in Brazilian)
|
|
|
| [10] |
Burkhart H E, Tomé M. 2012. Modeling Forest Trees and Stands. Dordrecht: Springer Netherlands, 1-460.
|
|
|
| [11] |
Cabacinha C D, Scolforo J R S, Thiersch, C R, et al. 2013. A new approach for the geometric method using the parabola index method. Ciência Florestal, 23(1):261-271. (in Brazilian)
|
|
|
| [12] |
Chave J, Andalo C, Brown S, et al. 2005. Tree allometry and improved estimation of carbon stocks and balance in tropical forests. Oecologia, 145(6):87-99.
|
|
|
| [13] |
Chave J, Réjou-Méchain M, Búrquez A, et al. 2014. Improved allometric models to estimate the aboveground biomass of tropical trees. Global Change Biology, 20(10):3177-3190.
doi: 10.1111/gcb.12629
pmid: 24817483
|
|
|
| [14] |
Costa T L, Sampaio E V S B, Sales M F, et al. 2014. Root and shoot biomasses in the tropical dry forest of semi-arid Northeast Brazil. Plant and Soil, 378:113-123.
|
|
|
| [15] |
Dalmagro H J, Lobo F D A, Vourlitis G L, et al. 2014. The physiological light response of two tree species across a hydrologic gradient in Brazilian savanna (Cerrado). Photosynthetica, 52(1):22-35.
|
|
|
| [16] |
Duncanson L, Rourke O, Dubayah R. 2015. Small sample sizes yield biased allometric equations in temperate forests. Scientific Reports, 5:17153, doi: 10.1038/srep17153.
doi: 10.1038/srep17153
pmid: 26598233
|
|
|
| [17] |
Duncanson L, Huang W, Johnson K, et al. 2017. Implications of allometric model selection for county-level biomass mapping. Carbon Balance and Management, 12(18):1-11.
|
|
|
| [18] |
Duncanson L, Dubayah R. 2018. Monitoring individual tree-based change with airborne lidar. Ecology and Evolution, 8(10):5079-5089.
doi: 10.1002/ece3.4075
pmid: 29876083
|
|
|
| [19] |
Fraga M P, Barreto P A B, de Paula A. 2014. Volume estimation of Pterogyne nitens in pure plantation in the southwest of Bahia. Embrapa Forestry, 34(79):207-215. (in Brazilian)
|
|
|
| [20] |
Jenkins J C, Chojnacky D C, Heath L S, et al. 2003. National-scale biomass estimators for United States tree species. Forest Science, 49(1):12-35.
|
|
|
| [21] |
Kachamba D J, Eid T. 2016. Total tree, merchantable stem and branch volume models for miombo woodlands of Malawi. Southern Forests, 78(1):41-51.
|
|
|
| [22] |
Leite F S L, Resende A V. 2010. Estimate of wood volume departing from the diameter at stump height in an exploited area in "terra firme" amazon forest. Ciência Florestal, 20(1):69-79. (in Brazilian)
|
|
|
| [23] |
Levick S R, Hessenmöller D, Schulze E. 2016. Scaling wood volume estimates from inventory plots to landscapes with airborne LiDAR in temperate deciduous forest. Carbon Balance and Management, 11(7):1-14.
|
|
|
| [24] |
Lima P C F, Oliveira E B, Machado S A. 1996 Equations for biomass estimation of Prosopis species in the brazilian semi-arid region. Boletim de Pesquisa Florestal, 32(33):67-79. (in Brazilian)
|
|
|
| [25] |
Lima R B, Aparício P S, Ferreira R L C, et al. 2014. Volumetry and classification of production capacity for Mora paraensis (Ducke) in Amapa estuary. Scientia Forestalis, 42(101):141-154. (in Brazilian)
|
|
|
| [26] |
Lima R B, Alves Júnior F T, Oliveira C P D, et al. 2017. Predicting of biomass in Brazilian tropical dry forest: a statistical evaluation of generic equations. Anais da Academia Brasileira de Ciências, 89(3):1815-1828.
doi: 10.1590/0001-3765201720170047
|
|
|
| [27] |
Litton C M, Boone K J. 2008. Allometric models for predicting aboveground biomass in two widespread woody plants in Hawaii. Biotropica, 40(3):313-320.
doi: 10.1111/(ISSN)1744-7429
|
|
|
| [28] |
Mcroberts R E, Westfall J A. 2014. Effects of uncertainty in model predictions of individual tree volume on large area volume estimates. Forest Science, 60(1):34-42.
doi: 10.5849/forsci.12-141
|
|
|
| [29] |
Miles L, Newton A C, Defries R S, et al. 2006. A global overview of the conservation status of tropical dry forests. Journal of Biogeography, 33(3):491-505.
doi: 10.1111/jbi.2006.33.issue-3
|
|
|
| [30] |
Ministry of the Environment. 2006. National Forest Management Plan Contendas do Sincorá. Volume I: General Information about the National Forest. Brasília: Brazilian Institute of Environment and Renewable Natural Resources, 132. (in Brazilian)
|
|
|
| [31] |
Moro M F, Lughadha E N, Araújo F S, et al. 2016. A Phytogeographical metaanalysis of the semiarid Caatinga domain in Brazil. The Botanical Review, 82(2):91-148.
doi: 10.1007/s12229-016-9164-z
|
|
|
| [32] |
Murphy P G, Lugo A E. 1986. Ecology of tropical dry forest. Annual Review of Ecology and Systematics, 17(1):67-88.
doi: 10.1146/annurev.es.17.110186.000435
|
|
|
| [33] |
Murphy P G, Lugo A E. 1995. Dry forests of Central America and the Caribbean. In: Bullock S, Mooney H, Medina E. Seasonally Dry Tropical Forests. California: University Press, 9-34.
|
|
|
| [34] |
Oliveira L Z, Klitzke A R, Fantini A, et al. 2018. Robust volumetric models for supporting the management of secondary forest stands in the Southern Brazilian Atlantic Forest. Anais da Academia Brasileira de Ciências, 90(4):3729-3744. (in Brazilian)
doi: 10.1590/0001-3765201820180111
|
|
|
| [35] |
Pennington R T, Lewis G P, Ratter J A. 2006. An overview of the plant diversity, biogeography and conservation of Neotropical Savannas and seasonally dry forests. In: Pennington R T, Lewis G P, Ratter J A. Neotropical Savannas and Seasonally Dry Forests: Plant Diversity, Biogeography, and Conservation. Boca Raton: CRC Press, 1-29.
|
|
|
| [36] |
Queiroz L P. 2009. Leguminous of Caatinga. Feira de Santana: UEFS, 443. (in Brazilian)
|
|
|
| [37] |
R Development Core Team. 2019. R: A Language and Environment for Statistical Computing. Vienna: R Foundation for Statistical Computing.[2020-04-24]. http://www.R-project.org/.
|
|
|
| [38] |
Robinson A P, Hamann J D. 2011. Forest Analytics with R. New York: Springer, 1-311.
|
|
|
| [39] |
Sampaio E, Gasson P, Baracat A, et al. 2010. Tree biomass estimation in regenerating areas of tropical dry vegetation in northeast Brazil. Forest Ecology and Management, 259(6):1135-1140.
doi: 10.1016/j.foreco.2009.12.028
|
|
|
| [40] |
Segura M, Kanninen M. 2005. Allometric models for tree volume and total aboveground biomass in a tropical humid forest in Costa Rica. Biotropica, 37(1):2-8.
doi: 10.1111/j.1744-7429.2005.02027.x
|
|
|
| [41] |
Silva J M C, Bates J M. 2002. Biogeographic patterns and conservation in the South American Cerrado: A tropical Savanna hotspot. BioScience, 52(3):225-234.
doi: 10.1641/0006-3568(2002)052[0225:BPACIT]2.0.CO;2
|
|
|
| [42] |
Silva-Ribeiro R B, Gama J R V, Melo L O. 2014. Sectional analysis for volume determination and selection of volume equations for the Tapajos Nacional Forest. Cerne, 20(4):605-612. (in Brazilian)
doi: 10.1590/01047760201420041400
|
|
|
| [43] |
Souza P F, Silva J A, Lucena D S, et al. 2016. Dendrometric and phytosociological studies in a fragment of caatinga, São José de Espinharas - PB. Ciência Florestal, 26(4):1317-1330. (in Brazilian)
|
|
|
| [44] |
Sullivan M J P, Lewis S L, Hubau W, et al. 2018. Field methods for sampling tree height for tropical forest biomass estimation. Methods in Ecology and Evolution, 9(5):1179-1189.
doi: 10.1111/2041-210X.12962
pmid: 29938017
|
|
|
| [45] |
Vanclay J K. 1994. Modelling Forest Growth and Yield: Applications to Mixed Tropical Forests. Oxford: CAB International, 1-330.
|
|
|
| [46] |
Vibrans A C, Moser P, Oliveira L Z, et al. 2015. Generic and specific stem volume models for three subtropical forest types in southern Brazil. Annals of Forest Science, 72:865-874.
|
|
|
| [47] |
Watt M S, Adams T, Gonzalez-Aracil S, et al. 2013. The influence of LiDAR pulse density and plot size on the accuracy of New Zealand plantation stand volume equations. New Zealand Journal of Forestry Science, 43(15):1-10.
|
|
|
| [48] |
Werneck F P. 2011. The diversification of eastern South American open vegetation biomes: historical biogeography and perspectives. Quaternary Science Reviews, 30(13-14):1630-1648.
|
|
|
| [49] |
Zeng W S, Tang S Z. 2011. Bias correction in logarithmic regression and comparison with weighted regression for nonlinear models. Nature Precedings, 24(2):137-143.
|
|
|
|
Viewed |
|
|
|
Full text
|
|
|
|
|
Abstract
|
|
|
|
|
Cited |
|
|
|
|
| |
Shared |
|
|
|
|
| |
Discussed |
|
|
|
|