| Research article |
|


|
|
|
| Mapping the current and future distributions of Onosma species endemic to Iran |
Farzaneh KHAJOEI NASAB1, Ahmadreza MEHRABIAN1,*( ), Hossein MOSTAFAVI2 ), Hossein MOSTAFAVI2 |
1Department of Plant Sciences and Biotechnology, Faculty of Life Sciences and Biotechnology, Shahid Beheshti University, Tehran 1983969411, Iran
2Department of Biodiversity and Ecosystems Management, Environmental Sciences Research Institute, Shahid Beheshti University, Tehran 1983969411, Iran |
|
|
|
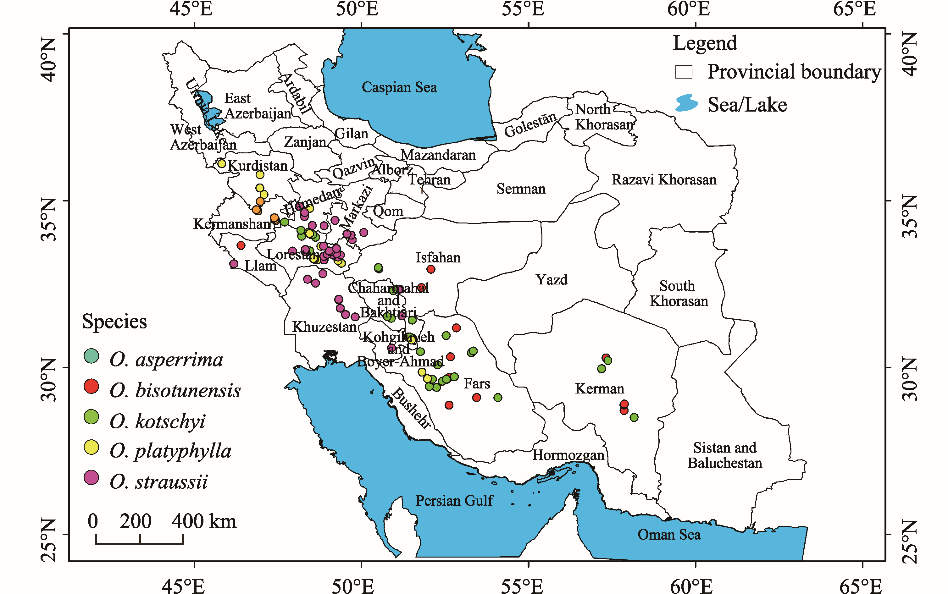
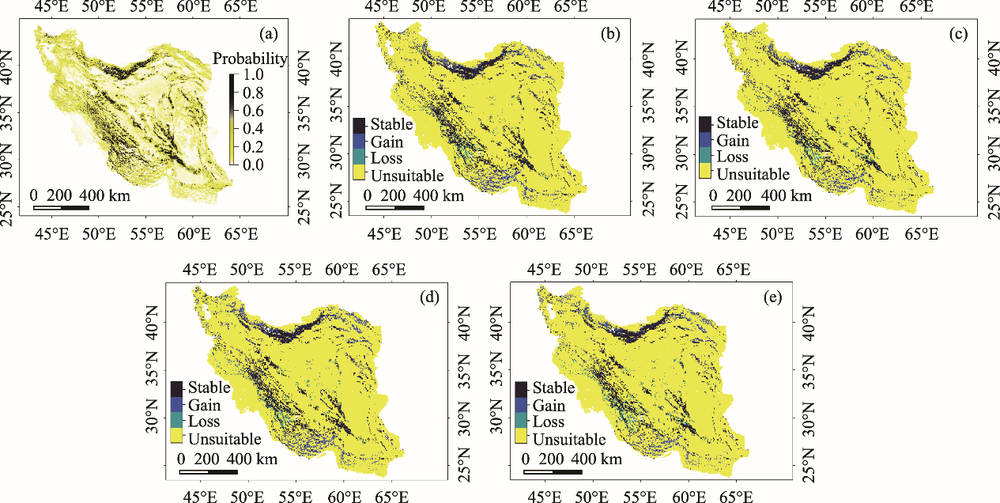
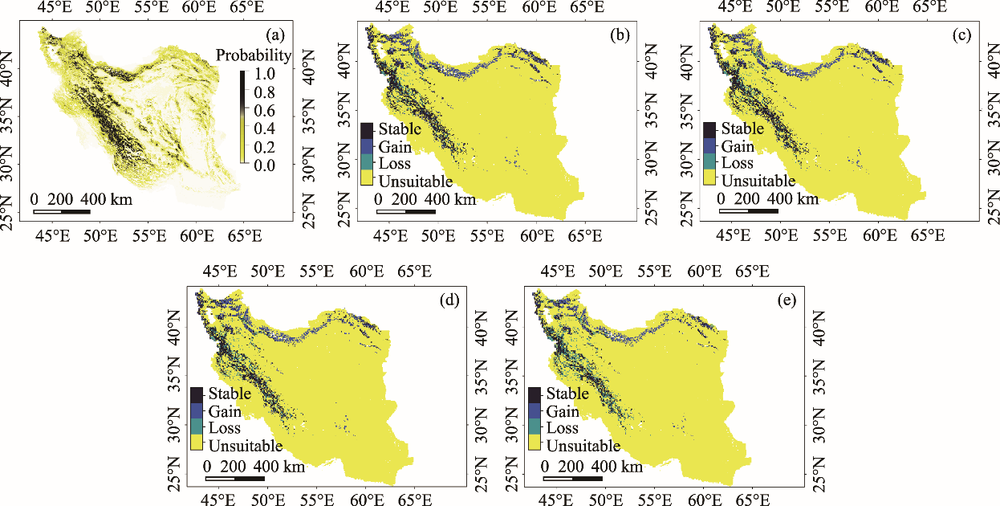
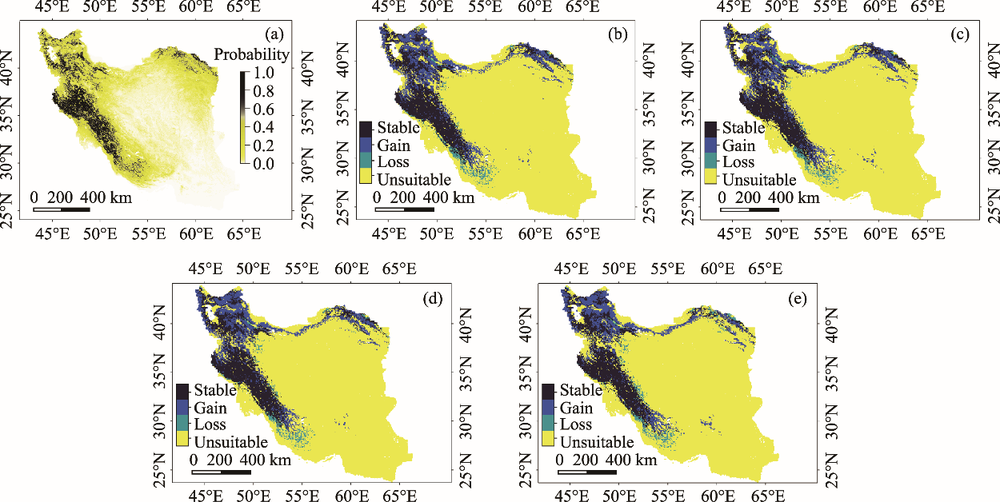
Abstract Climate change may cause shifts in the natural range of species especially for those that are geographically restricted and/or endemic species. In this study, the spatial distribution of five endemic and threatened species belonging to the genus Onosma (including O. asperrima, O. bisotunensis, O. kotschyi, O. platyphylla, and O. straussii) was investigated under present and future climate change scenarios: RCP2.6 (RCP, representative concentration pathway; optimistic scenario) and RCP8.5 (pessimistic scenario) for the years 2050 and 2080 in Iran. Analysis was conducted using the maximum entropy (MaxEnt) model to provide a basis for the protection and conservation of these species. Seven environmental variables including aspect, depth of soil, silt content, slope, annual precipitation, minimum temperature of the coldest month, and annual temperature range were used as main predictors in this study. The model output for the potential habitat suitability of the studied species showed acceptable performance for all species (i.e., the area under the curve (AUC)>0.800). According to the models generated by MaxEnt, the potential current patterns of the species were consistent with the observed areas of distributions. The projected climate maps under optimistic and pessimistic scenarios (RCP2.6 and RCP8.5, respectively) of 2050 and 2080 resulted in reductions and expansions as well as positive range changes for all species in comparison to their current predicted distributions. Among all species, O. bisotunensis showed the most significant and highest increase under the pessimistic scenario of 2050 and 2080. Finally, the results of this study revealed that the studied plant species have shown an acute adaptability to environmental changes. The results can provide useful information to managers to apply appropriate strategies for the management and conservation of these valuable Iranian medicinal and threatened plant species in the future.
|
|
Received: 16 January 2020
Published: 10 November 2020
|
|
Corresponding Authors:
|
About author: *Ahmadreza MEHRABIAN (E-mail: a_mehrabian@sbu.ac.ir)
|
|
|
| [1] |
Abolmaali S M R, Tarkesh M, Bashari H. 2018. MaxEnt modeling for predicting suitable habitats and identifying the effects of climate change on a threatened species, Daphne mucronata, in central Iran. Ecological Informatics, 43:16-123.
|
|
|
| [2] |
Abdelaal M, Fois M, Fenu G, et al. 2019. Using MaxEnt modeling to predict the potential distribution of the endemic plant Rosa arabica Crép. in Egypt. Ecological Informatics, 50:68-75.
doi: 10.1016/j.ecoinf.2019.01.003
|
|
|
| [3] |
Adams J. 2007. Vegetation-Climate Interaction: How Vegetation Makes the Global Environment. Chichester: Springer-Praxis Ltd., 21-26.
|
|
|
| [4] |
Adams-Hosking C, McAlpine C A, Rhodes J R, et al. 2015. Prioritizing regions to conserve a specialist folivore: considering probability of occurrence, food resources, and climate change. Conservation Letters, 8(3):162-170.
|
|
|
| [5] |
Adhikari P, Jeon J, Kim H W, et al. 2019. Potential impact of climate change on plant invasion in the Republic of Korea. Journal of Ecology and Environment, 43(4):352-363.
|
|
|
| [6] |
Akhani H. 2006. Flora Iranica: facts and figures and a list of publications by K. H. Rechinger on Iran and adjacent areas. Rostaniha, 7(2):19-61.
|
|
|
| [7] |
Alamgir M, Mukul S A, Turton S M. 2015. Modelling spatial distribution of critically endangered Asian elephant and hoolock gibbon in Bangladesh forest ecosystems under a changing climate. Applied Geography, 60:10-19.
|
|
|
| [8] |
Amedie F A. 2013. Impacts of Climate Change on Plant Growth, Ecosystem Services, Biodiversity, and Potential Adaptation Measure. Gothenburg: University of Gothenburg, 1-34.
|
|
|
| [9] |
Anderson D W. 1988. The effect of parent material and soil development on nutrient cycling in temperate ecosystems. Biogeochemistry, 5(1):71-97.
doi: 10.1007/BF02180318
|
|
|
| [10] |
Aragón P, Rodríguez M A, Olalla-Tárraga M A, et al. 2010. Predicted impact of climate change on threatened terrestrial vertebrates in central Spain highlights differences between endotherms and ectotherms. Animal Conservation, 13(4):363-373.
doi: 10.1111/acv.2010.13.issue-4
|
|
|
| [11] |
Ardestani G E, Tarkesh M, Bassiri M, et al. 2015. Potential habitat modeling for reintroduction of three native plant species in central Iran. Journal of Arid Land, 7:381-390.
doi: 10.1007/s40333-014-0050-4
|
|
|
| [12] |
Ashraf U, Chaudhry M N, Ahmad S J, et al. 2018. Impacts of climate change on Capparis spinosa L. based on ecological niche modeling. PeerJ, 6: e5792, https://doi.org/10.7717/peerj.5792.
doi: 10.7717/peerj.5792
pmid: 30356932
|
|
|
| [13] |
Bellard C, Bertelsmeier C, Leadley P, et al. 2012. Impacts of climate change on the future of biodiversity. Ecology letters, 365-377.
doi: 10.1111/j.1461-0248.2011.01736.x
pmid: 22257223
|
|
|
| [14] |
Bender I M A, Kissling W D, Böhning-Gaese K, et al. 2019. Projected impacts of climate change on functional diversity of frugivorous birds along a tropical elevational gradient. Scientific Reports, 9:17708.
doi: 10.1038/s41598-019-53409-6
pmid: 31776351
|
|
|
| [15] |
Bleyhl B, Sipko T, Trepet S, et al. 2015. Mapping seasonal European bison habitat in the Caucasus Mountains to identify potential reintroduction sites. Biological Conservation, 191:83-92.
|
|
|
| [16] |
Bonn A, Rodrigues A S L, Gaston K J. 2002. Threatened and endemic species: are they good indicators of patterns of biodiversity on a national scale? Ecology Letters, 5(6):733-741.
|
|
|
| [17] |
Bosso L, Di Febbraro M, Cristinzio G, et al. 2016. Shedding light on the effects of climate change on the potential distribution of Xylella fastidiosa in the Mediterranean basin. Biological Invasions, 18:1759-1768.
|
|
|
| [18] |
Cantlon J E. 1953. Vegetation and microclimates on north and south slopes of Cushetunk Mountain, New Jersey. Ecological Monographs, 23(3):241-270.
|
|
|
| [19] |
Cecchi L, Coppi A, Selvi F. 2011. Evolutionary dynamics of serpentine adaptation in Onosma (Boraginaceae) as revealed by ITS sequence data. Plant Systematics and Evolution, 297(3-4):185-199.
doi: 10.1007/s00606-011-0506-3
|
|
|
| [20] |
Ceddia M B, Vieira S R, Villela A L O, et al. 2009. Topography and spatial variability of soil physical properties. Scientia Agricola, 66(3):338-352.
|
|
|
| [21] |
Coblentz D, Riitters K H. 2004. Topographic controls on the regional-scale biodiversity of the south-western USA. Journal of Biogeography, 31(7):1125-1138.
|
|
|
| [22] |
Dubuis A, Pottier J, Rion V, et al. 2011. Predicting spatial patterns of plant species richness: a comparison of direct macroecological and species stacking modelling approaches. Diversity and Distributions, 17(6):1122-1131.
|
|
|
| [23] |
Dyakov N. 2014. Gradient analysis of vegetation on the south slope of Vitosha Mountain, Southwest Bulgaria. Applied Ecology and Environmental Research, 12(4):1003-1025.
|
|
|
| [24] |
Elith J, Graham C, Anderson R, et al. 2006. Novel methods improve prediction of species' distributions from occurrence data. Ecography, 29(2):129-151.
doi: 10.1111/j.2006.0906-7590.04596.x
|
|
|
| [25] |
Elith J, Leathwick J R. 2007. Predicting species distributions from museum and herbarium records using multiresponse models fitted with multivariate adaptive regression splines. Diversity and Distributions, 13(3):165-175.
|
|
|
| [26] |
Elith J, Leathwick J R. 2009. Species distribution models: ecological explanation and prediction across space and time. Annual Review of Ecology, Evolution, and Systematics, 40:677-697.
doi: 10.1146/annurev.ecolsys.110308.120159
|
|
|
| [27] |
Elith J, Kearney M, Phillips S. 2010. The art of modelling range-shifting species. Methods in Ecology and Evolution, 1(4):330-342.
doi: 10.1111/j.2041-210X.2010.00036.x
|
|
|
| [28] |
Elith J, Phillips S J, Hastie T, et al. 2011. A statistical explanation of MaxEnt for ecologists. Diversity and Distributions, 17(1):43-57.
doi: 10.1111/j.1472-4642.2010.00725.x
|
|
|
| [29] |
Farashi A, Erfani M. 2018. Modeling of habitat suitability of Asiatic black bear (Ursus thibetanus gedrosianus) in Iran in future. Acta Ecologica Sinica, 38(1):9-14.
doi: 10.1016/j.chnaes.2017.07.003
|
|
|
| [30] |
Feng Y, Ma K M, Zhang Y X, et al. 2011. Effects of slope position on species abundance distribution of Quercus wutaishanica community in Dongling Mountain of Beijing. Chinese Journal of Ecology, 30(10):2137-2144. (in Chinese)
|
|
|
| [31] |
Fisher W B. 1968. ''Physical Geography''. In: Fisher W B. The Cambridge History of Iran. Cambridge: Cambridge University, 3-110.
|
|
|
| [32] |
Fois M, Cuena-Lombraña A, Fenu G, et al. 2018. Does a correlation exist between environmental suitability models and plant population parameters? An experimental approach to measure the influence of disturbances and environmental change. Ecological Indicators, 86:1-8.
doi: 10.1016/j.ecolind.2017.12.009
|
|
|
| [33] |
Garcia R A, Cabeza M, Rahbek C, et al. 2014. Multiple dimensions of climate change and their implications for biodiversity. Science, 344(6183):1247579.
doi: 10.1126/science.1247579
pmid: 24786084
|
|
|
| [34] |
Graham C H, Ferrier S, Huettman F, et al. 2004. New developments in museum-based informatics and applications in biodiversity analysis. Trends in Ecology & Evolution, 19(9):497-503.
doi: 10.1016/j.tree.2004.07.006
pmid: 16701313
|
|
|
| [35] |
Groves C R, Jensen D B, Valutis L L, et al. 2002. Planning for biodiversity conservation: Putting conservation science into Practice. BioScience, 52(6):499-512.
doi: 10.1641/0006-3568(2002)052[0499:PFBCPC]2.0.CO;2
|
|
|
| [36] |
Guillera-Arroita G, Lahoz-Monfort J J, Elith J, et al. 2015. Is my species distribution model fit for purpose? Matching data and models to applications. Global Ecology and Biogeography, 24(3):276-292.
doi: 10.1111/geb.2015.24.issue-3
|
|
|
| [37] |
Guisan A, Thuiller W. 2005. Predicting species distribution: Offering more than simple habitat models. Ecology Letters, 8(9):993-1009.
|
|
|
| [38] |
Guisan A, Tingley R, Baumgartner J B, et al. 2013. Predicting species distributions for conservation decisions. Ecology Letters, 16(12):1424-1435.
doi: 10.1111/ele.12189
pmid: 24134332
|
|
|
| [39] |
Hanson H C, Churchill E D. 1962. The Plant Community. New York: Reinhold Publishing Corp, 1-218.
|
|
|
| [40] |
He J. 2009. Complex of shikonin and β-cyclodextrins by using supercritical carbon dioxide. Journal of Inclusion Phenomena and Macrocyclic Chemistry, 63(3):249-255.
|
|
|
| [41] |
Hedge I C, Wendelbo P. 1978. Patterns of distribution and endemism in Iran. Notes from the Royal Botanic Garden. Edinburgh, UK, 36:441-464.
|
|
|
| [42] |
Homke S, Verges J, Emami H, et al. 2004. Magnetostratigraphy of Miocene-Pliocene Zagros foreland deposits in the front of the Push-e Kush Arc (Lurestan Province, Iran). Earth and Planetary Science Letters, 225(3-4):397-410.
|
|
|
| [43] |
Hosseini A, Asghari S. 2012. Investigating the relation between climatic variables and the dying occurrence in Iranian oak. In: 3rd National Conference on Combating Desertification and Sustainable Development of Iran Desert Wetlands (Relying on Meighan Desert Wetland). Islamic Azad University of Arak, Arak, Iran, 1-5.
|
|
|
| [44] |
Howden S M, Ash A J, Barlow E W R, et al. 2003. An overview of the adaptive capacity of the Australian agricultural sector to climate change-options, costs and benefits. Report to the Australian Greenhouse Office, Canberra.
|
|
|
| [45] |
Kafash A, Kaboli M, Köhler G, et al. 2016. Ensemble distribution modeling of the Mesopotamian spiny-tailed lizard (Saara loricata) in Iran: an insight into the impact of climate change. Turkish Journal of Zoology, 40(2):262-271.
|
|
|
| [46] |
Kafash A, Ashrafi S, Ohler A, et al. 2018. Climate change produces winners and losers: differential responses of amphibians in mountain forests of the Near East. Global Ecology and Conservation, 16:e00471.
|
|
|
| [47] |
Kaky E, Gilbert F. 2016. Using species distribution models to assess the importance of Egypt's protected areas for the conservation of medicinal plants. Journal of Arid Environments, 135:140-146.
|
|
|
| [48] |
Khanum R, Mumtaz A S, Kumar S. 2013. Predicting impacts of climate change on medicinal asclepiads of Pakistan using MaxEnt modeling. Acta Oecologica, 49:23-31.
doi: 10.1016/j.actao.2013.02.007
|
|
|
| [49] |
Khatamsaz M. 2002. Boraginaceae. Flora of Iran 39. Tehran: Research Institute of Forests and Rangelands, 114-168. (in Persian)
|
|
|
| [50] |
Kujala H, Moilanen A, Araujo M B, et al. 2013. Conservation planning with uncertain climate change projections. PLoS ONE, 8(2):e5331.
|
|
|
| [51] |
Legault A, Theuerkauf J, Chartendrault V, et al. 2013. Using ecological niche models to infer the distribution and population size of parakeets in New Caledonia. Biological Conservation, 167:149-160.
doi: 10.1016/j.biocon.2013.07.041
|
|
|
| [52] |
Li J L, Zhang J D. 2006. Plant species diversity in the middle part of the Taihang Mountain. Journal of Applied and Environmental Biology, 12:766-771. (in Chinese)
|
|
|
| [53] |
Liu C, White M, Newell G. 2013. Selecting thresholds for the prediction of species occurrence with presence-only data. Journal of Biogeography, 40(4):778-789.
doi: 10.1111/jbi.12058
|
|
|
| [54] |
Liu G L, Pang Y J, Shen H G, et al. 2010. Expression analysis of shikonin-biosynthetic genes in response to M9 medium and light in Lithospermum erythrorhizon cell cultures. Plant Cell Tissue and Organ Culture, 101(2):135-142.
doi: 10.1007/s11240-010-9670-3
|
|
|
| [55] |
Loarie S R, Carter B E, Hayhoe K, et al. 2008. Climate change and the future of California's endemic flora. PLoS ONE, 3(6):e2502.
doi: 10.1371/journal.pone.0002502
pmid: 18648541
|
|
|
| [56] |
Lobo J M, Jiménez-Valverde A, Real R. 2008. AUC: A misleading measure of the performance of predictive distribution models. Global Ecology and Biogeography, 17(2):145-151.
|
|
|
| [57] |
Luo Z, Jiang Z, Tang S. 2015. Impacts of climate change on distributions and diversity of ungulates on the Tibetan Plateau. Ecological Applications, 25(1):24-38.
doi: 10.1890/13-1499.1
pmid: 26255355
|
|
|
| [58] |
Margules C R, Pressey R L. 2000. Systematic conservation planning. Nature, 405:243-253.
doi: 10.1038/35012251
pmid: 10821285
|
|
|
| [59] |
Mathias A, Chesson P. 2013. Coexistence and evolutionary dynamics mediated by seasonal environmental variation in annual plant communities. Theoretical Population Biology, 84(1):56-71.
|
|
|
| [60] |
Mazangi A, Ejtehadi H, Mirshamsi O, et al. 2016. Effects of climate change on the distribution of endemic Ferula xylorhachis Rech.f. (Apiaceae: Scandiceae) in Iran: predictions from ecological niche models. Russian Journal of Ecology, 47(4):349-354.
|
|
|
| [61] |
Mehrabian A R. 2015. Distribution patterns and diversity of Onosma in Iran: with emphasis on endemism conservation and distribution pattern in SW Asia. Rostaniha, 16(1):36-60. (in Persian)
|
|
|
| [62] |
Mehrabian A R, Amini R M. 2018. Onosma moussavi sp. nov (Boraginaceae) from Zagros Mountain (s) Iran. Feddes Repertorium, 129(4):304-311.
|
|
|
| [63] |
Mehrabian A R, Khajoei Nasab F, Fraser-Jenkins C R, et al. 2020a. Distribution patterns and priorities for conservation of Iranian pteridophytes. Fern Gazetee, 21(4):141-160.
|
|
|
| [64] |
Mehrabian A R, Sayadi S, Majidi K M, et al. 2020b. Priorities for conservation of Iranian endemic trees and shrubs. Asia-Pacific Journal of Biodiversity, 13(2):295-305.
|
|
|
| [65] |
Moradi Z H, Mehrabian A R, Naghizadeh S, et al. 2019. Distribution patterns, diversity and conservation priorities of Onosma L. (Boraginaceae Juss.) in some sections of the northwestern geomorphologic unit of Iran. Environmental Sciences, 17(1):73-94. (In Persian)
|
|
|
| [66] |
Muths E, Chambert T, Schmidt B R, et al. 2017. Heterogeneous responses of temperate-zone amphibian populations to climate change complicates conservation planning. Scientific Reports, 7(1):17102.
doi: 10.1038/s41598-017-17105-7
pmid: 29213103
|
|
|
| [67] |
Mwanjalolo Jackson-Gilbert M, Makooma M T, Rao K P C, et al. 2015. Soil fertility in relation to landscape position and land use/cover types: a case study of the Lake Kivu Pilot learning site. Advances in Agriculture, 2015: 752936, doi: 10.1155/2015/752936.
|
|
|
| [68] |
Noroozi J, Moser D, Essl F. 2016. Diversity, distribution, ecology and description rates of alpine endemic plant species from Iranian mountains. Alpine Botany, 126(1):1-9.
|
|
|
| [69] |
Noroozi J, Talebi A, Doostmohammadi M, et al. 2018. Hotspots within a global biodiversity hotspot - areas of endemism are associated with high mountain ranges. Scientific Reports, 8(1):10345.
pmid: 29985437
|
|
|
| [70] |
Noula E, Samanidou V F, Assimopoulou A N, et al. 2010. Solid-phase extraction for purification of alkannin/shikonin samples and isolation of monomeric and dimeric fractions. Analytical and Bioanalytical Chemistry, 397(6):2221-2232.
doi: 10.1007/s00216-010-3717-5
pmid: 20454954
|
|
|
| [71] |
Padilla F M, Pugnaire F I. 2007. Rooting depth and soil moisture control Mediterranean woody seedling survival during drought. Functional Ecology, 21(3):489-495.
|
|
|
| [72] |
Parker A J, Branner J C. 1982. The topographic relative moisture index: an approach to soil-moisture assessment in mountain terrain. Physical Geography, 3(2):160-168.
|
|
|
| [73] |
Parmesan C. 2006. Ecological and evolutionary responses to recent climate change. Annual Review of Ecology, Evolution and Systematics, 37(1):637-669.
doi: 10.1146/annurev.ecolsys.37.091305.110100
|
|
|
| [74] |
Pausas J G, Austin M P. 2001. Patterns of plant species richness in relation to different environments: An appraisal. Journal of Vegetation Science, 12(2):153-166.
|
|
|
| [75] |
Peñuelas J, Sardans J, Estiarte M, et al. 2013. Evidence of current impact of climate change on life: a walk from genes to the biosphere. Global Change Biology, 19(8):2303-2338.
doi: 10.1111/gcb.12143
pmid: 23505157
|
|
|
| [76] |
Pereira H M, Leadley P W, Proença V, et al. 2010. Scenarios for global biodiversity in the 21st century, Science, 330(6010):1496-1501.
doi: 10.1126/science.1196624
pmid: 20978282
|
|
|
| [77] |
Peterson A T, Soberón J. 2012. Species distribution modeling and ecological niche modeling: Getting the concepts right. Natureza & Conservação, 10(2):102-107.
|
|
|
| [78] |
Phillips S J, Anderson R P, Schapire R E. 2006. Maximum entropy modeling of species geographic distributions. Ecological Modeling, 190(3-4):231-259.
|
|
|
| [79] |
Phillips S J, Dudík M, Elith J, et al. 2009. Sample selection bias and presence-only distribution models: implications for background and pseudo-absence data. Ecological Applications, 19(1):181-197.
doi: 10.1890/07-2153.1
pmid: 19323182
|
|
|
| [80] |
Poulos H M, Camp A E. 2010. Topographic influences on vegetation mosaics and tree diversity in the Chihuahuan Desert Borderlands. Ecology, 91(4):1140-1151.
doi: 10.1890/08-1808.1
pmid: 20462128
|
|
|
| [81] |
Quevedo-Robledo L, Pucheta E, Ribas-Fernández Y. 2010. Influences of interyear rainfall variability and microhabitat on the germinable seed bank of annual plants in a sandy Monte Desert. Journal of Arid Environments, 74(2):167-172.
|
|
|
| [82] |
R Core Team, 2018. R: A Language and Environment for Statistical Computing. R Foundation for Statistical Computing, Vienna, Austria.[2019-05-21]. http://www.R-project.org/.
|
|
|
| [83] |
Riedl H. 1967. Boraginaceae. Flora Iranica 48. Graz: Akademische Druck-u Verlagsanstalt, 169-212.
|
|
|
| [84] |
Rivas-Martínez S, Sánchez-Mata D, Costa M. 1997. Syntaxonomical synopsis of the potential natural plant communities of North America, I. Itinera Geobotanica, 10:5-148.
|
|
|
| [85] |
Rivas-Martínez S, Sánchez-Mata D, Costa M. 1999. Boreal and western temperate forest vegetation (syntaxonomical synopsis of the potential natural plant communities of North America, II). Itinera Geobotanica, 12:3-311.
|
|
|
| [86] |
Rödder D, Weinsheimer F. 2009. Will future anthropogenic climate change increase the potential distribution of the alien invasive Cuban treefrog (Anura: Hylidae)? Journal of Natural History, 43(19-20):1207-1217.
|
|
|
| [87] |
Roshan G H, Azizi G, Mohammadi H. 2011. Simulation of temperature changes in Iran under the atmosphere carbon dioxide duplication condition. Journal of Environmental Health Science & Engineering, 8(2):141-146.
|
|
|
| [88] |
Ru W M, Zhang G P, Zhang J D, et al. 2006. Species diversity of forest communities in southern Taihang Mountains, Shanxi. Acta Botanica Boreali-Occidentalia Sinica, 26(5):1036-1042. (in Chinese)
|
|
|
| [89] |
Rubidge E M, Monahan W B, Parra J L, et al. 2011. The role of climate, habitat, and species co-occurrence as drivers of change in small mammal distributions over the past century. Global Change Biology, 17(2):696-708.
|
|
|
| [90] |
Sala O E, Chapin F S, Armesto J J, et al. 2000. Global biodiversity scenarios for the year 2100. Science, 287(5459):1770-1774.
doi: 10.1126/science.287.5459.1770
pmid: 10710299
|
|
|
| [91] |
Sayadi S, Mehrabian A R, Nikjoyan M J. 2017. Some notes on taxonomy and diversity of Onosma with emphasis on important evidence and complex groups in Flora Iranica. Rostaniha, 18(1):50-58.
|
|
|
| [92] |
Sayadi S, Mehrabian A R. 2016. Diversity and distribution patterns of Solanaceae in Iran: Implications for conservation and habitat management with emphasis on endemism and diversity in SW Asia. Rostaniha, 17(2):136-160.
|
|
|
| [93] |
Sen S, Gode A, Ramanujam S, et al. 2016. Modeling the impact of climate change on wild Piper nigrum (Black Pepper) in Western Ghats, India using ecological niche models. Journal of Plant Research, 129(6):1033-1040.
doi: 10.1007/s10265-016-0859-3
pmid: 27624169
|
|
|
| [94] |
Soberón J, Peterson A T. 2005. Interpretation of models of fundamental ecological niches and species' distributional areas. Biodiversity Informatics, 2:1-10.
|
|
|
| [95] |
Sut S, Pavela R, Kolarčik V, et al. 2017. Identification of Onosma visianii roots extract and purified shikonin derivatives as potential acaricidal agents against Tetranychus urticae. Molecules, 27(6):1002.
|
|
|
| [96] |
Tallis H, Kareiva P, Marvier M, et al. 2008. An ecosystem services framework to support both practical conservation and economic development. Proceedings of the National Academy of Sciences of the United States of America, 105(28):9457-9464.
|
|
|
| [97] |
Thiers B. 2019. Index herbariorum: A global directory of public herbaria and associated staff. New York Botanical Garden's Virtual Herbarium.[2020-04-15]. http://sweetgum.nybg.org/ih.
|
|
|
| [98] |
Ulrey C, Quintana-Ascencio P F, Kauffman G, et al. 2016. Life at the top: Long-term demography, microclimatic refugia, and responses to climate change for a high-elevation southern Appalachian endemic plant. Biological Conservation, 200:80-92.
|
|
|
| [99] |
Valavi R, Shafizadeh-Moghadam H, Matkan A A, et al. 2018. Modelling climate change effects on Zagros forests in Iran using individual and ensemble forecasting approaches. Theoretical and Applied Climatology, 137:1015-1025.
|
|
|
| [100] |
Valavi R, Elith J, Lahoz-Monfort J J, et al. 2019. An r package for generating spatially or environmentally separated folds for k-fold cross-validation of species distribution models. Methods in Ecology and Evolution, 10(2):225-232.
|
|
|
| [101] |
Vasconcelos T S, Nascimento B T M. 2014. The utility of open-access biodiversity information in representing anurans in the Brazilian Atlantic Forest and Cerrado. Phyllomedusa, 13(1):51-58.
|
|
|
| [102] |
Velazco S J E, Galvão F, Villalobos F, et al. 2017. Using worldwide edaphic data to model plant species niches: An assessment at a continental extent. PLoS ONE, 12(10):e0186025.
doi: 10.1371/journal.pone.0186025
pmid: 29049298
|
|
|
| [103] |
Warren R, VanDerWal J, Price J, et al. 2013. Quantifying the benefit of early climate change mitigation in avoiding biodiversity loss. Nature Climate Change, 3(7):678-682.
|
|
|
| [104] |
Yan H, Liang C, Li Z, et al. 2015. Impact of precipitation patterns on biomass and species richness of annuals in a dry steppe. PLoS ONE, 10(4):e0125300.
doi: 10.1371/journal.pone.0125300
pmid: 25906187
|
|
|
| [105] |
Yi Y, Cheng X Y, Yang Z, et al. 2016. MaxEnt modeling for predicting the potential distribution of endangered medicinal plant (H riparia Lour) in Yunnan, China. Ecological Engineering, 92:260-269.
doi: 10.1016/j.ecoleng.2016.04.010
|
|
|
| [106] |
Yousefi M, Jouladeh-Rodbar A, Kafash A. 2020. Using endemic freshwater fishes as proxies of their ecosystems to identify high priority rivers for conservation under climate change. Ecological Indicators, 112:106137.
|
|
|
| [107] |
Zahran M A. 2010. Climate-Vegetation: Afro-Asian Mediterranean and Red Sea Coastal Lands. New York: Springer Science & Business Media, 324.
|
|
|
| [108] |
Zohary M. 1973. Geobotanical Foundations of the Middle East (Vol. 2). Stuttgart: Gustav Fisher Verlag, 738.
|
|
|
|
Viewed |
|
|
|
Full text
|
|
|
|
|
Abstract
|
|
|
|
|
Cited |
|
|
|
|
| |
Shared |
|
|
|
|
| |
Discussed |
|
|
|
|