| Research article |
|


|
|
|
| Modelling the biological invasion of Prosopis juliflora using geostatistical-based bioclimatic variables under climate change in arid zones of southwestern Iran |
Mohadeseh AMIRI1,*( ), Mosfata TARKESH1, Mohammad SHAFIEZADEH2 ), Mosfata TARKESH1, Mohammad SHAFIEZADEH2 |
1Department of Natural Resources, Isfahan University of Technology, Isfahan 8415683111, Iran
2Natural Resources and Watershed Management Organization, Khuzestan 6134788439, Iran |
|
|
|
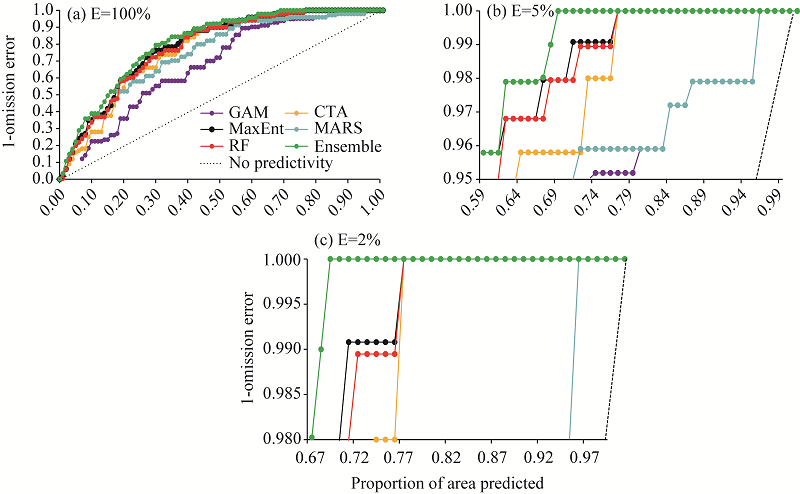
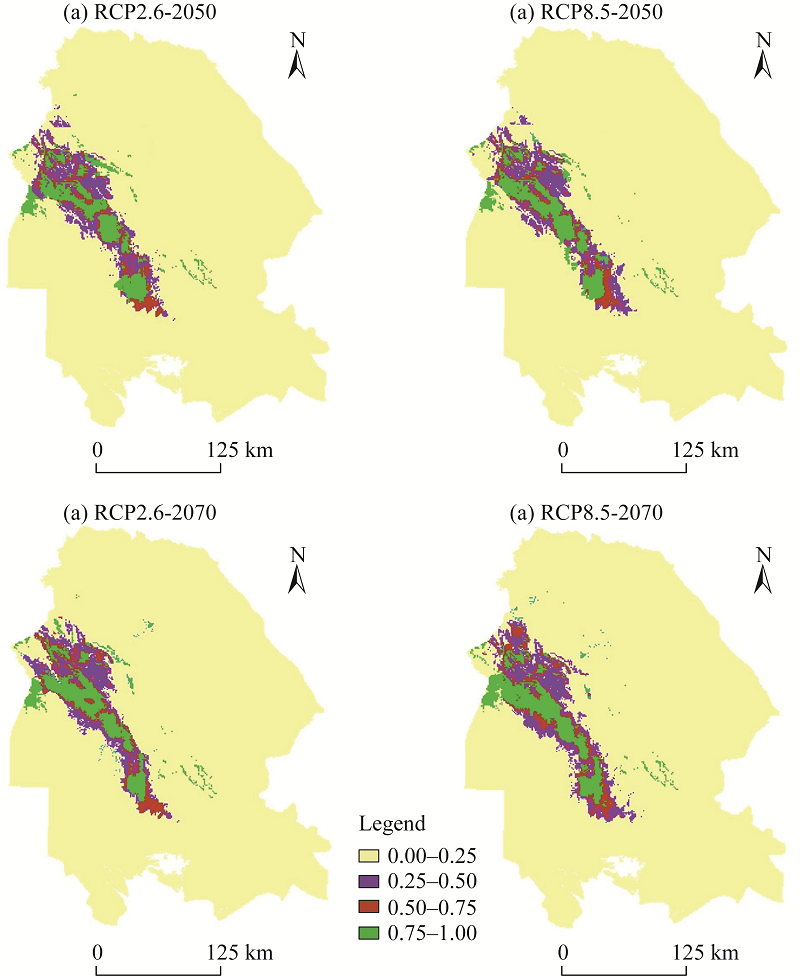
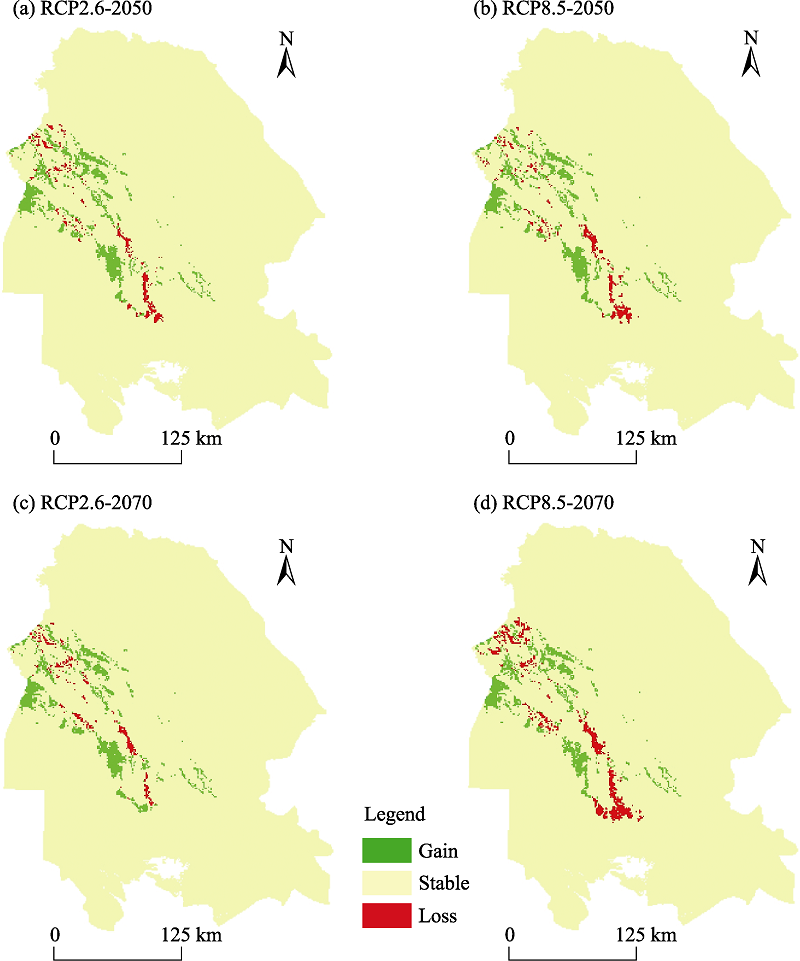
Abstract Invasive species have been the focus of ecologists due to their undesired impacts on the environment. The extent and rapid increase in invasive plant species is recognized as a natural cause of global-biodiversity loss and degrading ecosystem services. Biological invasions can affect ecosystems across a wide spectrum of bioclimatic conditions. Understanding the impact of climate change on species invasion is crucial for sustainable biodiversity conservation. In this study, the possibility of mapping the distribution of invasive Prosopis juliflora (Swartz) DC. was shown using present background data in Khuzestan Province, Iran. After removing the spatial bias of background data by creating weighted sampling bias grids for the occurrence dataset, we applied six modelling algorithms (generalized additive model (GAM), classification tree analysis (CTA), random forest (RF), multivariate adaptive regression splines (MARS), maximum entropy (MaxEnt) and ensemble model) to predict invasion distribution of the species under current and future climate conditions for both optimistic (RCP2.6) and pessimistic (RCP8.5) scenarios for the years 2050 and 2070, respectively. Predictor variables including weighted mean of CHELSA (climatologies at high resolution for the Earth's land surface areas)-bioclimatic variables and geostatistical-based bioclimatic variables (1979-2020), physiographic variables extracted from shuttle radar topography mission (SRTM) and some human factors were used in modelling process. To avoid causing a biased selection of predictors or model coefficients, we resolved the spatial autocorrelation of presence points and multi-collinearity of the predictors. As in a conventional receiver operating characteristic (ROC), the area under curve (AUC) is calculated using presence and absence observations to measure the probability and the two error components are weighted equally. All models were evaluated using partial ROC at different thresholds and other statistical indices derived from confusion matrix. Sensitivity analysis showed that mean diurnal range (Bio2) and annual precipitation (Bio12) explained more than 50%of the changes in the invasion distribution and played a pivotal role in mapping habitat suitability of P. juliflora. At all thresholds, the ensemble model showed a significant difference in comparison with single model. However, MaxEnt and RF outperformed the others models. Under climate change scenarios, it is predicted that suitable areas for this invasive species will increase in Khuzestan Province, and increasing climatically suitable areas for the species in future will facilitate its future distribution. These findings can support the conservation planning and management efforts in ecological engineering and be used in formulating preventive measures.
|
|
Received: 14 October 2021
Published: 28 February 2022
|
|
Corresponding Authors:
*Mohadeseh AMIRI (E-mail: mohaddeseh.amiri@na.iut.ac.ir)
|
|
|
| [1] |
Adhikari D, Barik S, Upadhaya K. 2012. Habitat distribution modelling for reintroduction of Ilex khasiana Purk., a critically endangered tree species of northeastern India. Ecological Engineering, 40:37-43.
doi: 10.1016/j.ecoleng.2011.12.004
|
|
|
| [2] |
Allouche O, Tsoar A, Kadmon R. 2006. Assessing the accuracy of species distribution models: prevalence, kappa and the true skill statistic (TSS). Journal of Applied Ecology, 43(6):1223-1232.
doi: 10.1111/jpe.2006.43.issue-6
|
|
|
| [3] |
Alvarez A, Salas E A L, Harings N M, et al. 2017. Projections of future suitable bioclimatic conditions of parthenogenetic whiptails. Climate, 5(2):34.
doi: 10.3390/cli5020034
|
|
|
| [4] |
Araújo M, New M. 2007. Ensemble forecasting of species distributions. Trends in Ecology and Evolution, 22(1):42-47.
doi: 10.1016/j.tree.2006.09.010
|
|
|
| [5] |
Aznar J C, Gloaguen E, Tapsoba D, et al. 2012. Interpolation of monthly mean temperatures using cokriging in spherical coordinates. International Journal of Climatology, 33(3):758-769.
doi: 10.1002/joc.3468
|
|
|
| [6] |
Bakkenes M, Alkemade J, Ihle F, et al. 2002. Assessing effects of forecasted climate change on the diversity and distribution of European higher plants for 2050. Global Change Biology, 8(4):390-407.
doi: 10.1046/j.1354-1013.2001.00467.x
|
|
|
| [7] |
Barbet-Massin M, Jiguet F, Albert C H, et al. 2012. Selecting pseudo-absences for species distribution models: how, where and how many? Methods in Ecology and Evolution, 3:327-338.
doi: 10.1111/j.2041-210X.2011.00172.x
|
|
|
| [8] |
Barve N. 2008. Tool for Partial ROC. Lawrence: Biodiversity Institute, 1-10.
|
|
|
| [9] |
Bazzichetto M, Malavasi M, Bartak V, et al. 2018. Plant invasion risk: A quest for invasive species distribution modelling in managing protected areas. Ecological Indicators, 95:311-319.
doi: 10.1016/j.ecolind.2018.07.046
|
|
|
| [10] |
Behnamfar K, Orsham A, Salehehshshtari M H, et al. 2019. Determination of tolerance to below-zero temperatures in Prosopis juliflora using physiological indices. Iranian Journal of Range and Desert Research, 26(1):49-61.
|
|
|
| [11] |
Bellard C, Thuiller W, Leroy B, et al. 2013. Will climate change promote future invasions? Global Change Biology, 19(12):3740-3748.
doi: 10.1111/gcb.12344
pmid: 23913552
|
|
|
| [12] |
Bellard C, Cassey P, Blackburn T M. 2016. Alien species as a driver of recent extinctions. Biology Letters, 12(2):20150623, doi: 10.1098/rsbl.2015.0623.
doi: 10.1098/rsbl.2015.0623
pmid: 26888913
|
|
|
| [13] |
Broennimann O, Thuiller W, Hughes G, et al. 2006. Do geographic distribution, niche property and life form explain plants' vulnerability to global change? Global Change Biology, 12(6):1079-1093.
doi: 10.1111/gcb.2006.12.issue-6
|
|
|
| [14] |
Choudhury M R, Deb P, Singha H, et al. 2016. Predicting the probable distributions and threat of invasive Mimosa diplotricha Suavalle and Mikania micrantha Kunth in a protected tropical grassland. Ecological Engineering, 97:23-31.
doi: 10.1016/j.ecoleng.2016.07.018
|
|
|
| [15] |
Crimmins S M, Dobrowski S Z, Mynsberge A R. 2013. Evaluating ensemble forecasts of plant species distributions under climate change. Ecological Modelling, 266:126-130.
doi: 10.1016/j.ecolmodel.2013.07.006
|
|
|
| [16] |
Diao C, Wang L. 2014. Development of an invasive species distribution model with fine-resolution remote sensing. International Journal of Applied Earth Observation and Geoinformation, 30:65-75.
doi: 10.1016/j.jag.2014.01.015
|
|
|
| [17] |
Dobrowski S Z, Thorne J H, Greenberg J A, et al. 2011. Modeling plant ranges over 75 years of climate change in California, USA: temporal transferability and species traits. Ecological Monographs, 81(2):241-257.
doi: 10.1890/10-1325.1
|
|
|
| [18] |
Elith J, Graham C H, Anderson R P, et al. 2006. Novel methods improve prediction of species' distributions from occurrence data. Ecography, 29(2):129-151.
doi: 10.1111/j.2006.0906-7590.04596.x
|
|
|
| [19] |
Elith J, Phillips S J, Hastie T, et al. 2010. A statistical explanation of MaxEnt for ecologists. Diversity and Distributions, 17(1):43-57.
doi: 10.1111/ddi.2010.17.issue-1
|
|
|
| [20] |
Evangelista P H, Kumar S, Stohlgren T J, et al. 2008. Modelling invasion for a habitat generalist and a specialist plant species. Diversity and Distribution, 14(5):808-817.
doi: 10.1111/ddi.2008.14.issue-5
|
|
|
| [21] |
Gong X, Chen Y, Wang T, et al. 2020. Double-edged effects of climate change on plant invasions: Ecological niche modeling global distributions of two invasive alien plants. Science of the Total Environment, 740:139933, doi: 10.1016/j.scitotenv.2020.139933.
doi: 10.1016/j.scitotenv.2020.139933
|
|
|
| [22] |
Guisan A, Tingley R, Baumgartner J B, et al. 2013. Predicting species distributions for conservation decisions. Ecology Letters, 16(12):1424-1435.
doi: 10.1111/ele.2013.16.issue-12
|
|
|
| [23] |
Harsch M A, Phillips A, Zhou Y, et al. 2017. Moving forward: insights and applications of moving-habitat models for climate change ecology. Journal of Ecology, 105(5):1169-1181.
doi: 10.1111/jec.2017.105.issue-5
|
|
|
| [24] |
Heshmati I, Khorasani N, Shams-Esfandabad B, et al. 2019. Forthcoming risk of Prosopis juliflora global invasion triggered by climate change: implications for environmental monitoring and risk assessment. Environmental Monitoring and Assessment, 191:72.
doi: 10.1007/s10661-018-7154-9
pmid: 30648210
|
|
|
| [25] |
Huang C, Asner G P. 2009. Applications of remote sensing to alien invasive plant studies. Sensors, 9(6):4869-4889.
doi: 10.3390/s90604869
|
|
|
| [26] |
IPBES (Intergovernmental Science-Policy Platform on Biodiversity and Ecosystem Services). 2015. Decision IPBES-3/1: Work Programme for the Period 2014-2018. Bonn: IPBES, 43.
|
|
|
| [27] |
IPCC. 2013. Climate change. In: Stocker T F, Qin D H, Plattner G K, et al. The Physical Science Basis. Contribution of Working Group I to the Fifth Assessment Report of the Intergovernmental Panel on Climate Change. Cambridge: Cambridge University Press, 2-27.
|
|
|
| [28] |
Jones C. 2012. Challenges in predicting the future distributions of invasive plant species. Forest Ecology and Management, 284:9-77.
|
|
|
| [29] |
Joshi C, Leeuw J D, van Duren I C. 2004. Remote sensing and GIS applications for mapping and spatial modeling of invasive species. International Journal of Geo-Information, 35:669-677.
|
|
|
| [30] |
Kaky E, Nolan V, Alatawi A, et al. 2020. A comparison between ensemble and MaxEnt species distribution modelling approaches for conservation: A case study with Egyptian medicinal plants. Ecological Informatics, 60:101150, doi: 10.1016/j.ecoinf.2020.101150.
doi: 10.1016/j.ecoinf.2020.101150
|
|
|
| [31] |
Kandwal R, Jeganathan C, Tolpekin V, et al. 2009. Discriminating the invasive species, Lantana using vegetation indices. Journal of the Indian Society of Remote Sensing, 37:275-290.
doi: 10.1007/s12524-009-0027-5
|
|
|
| [32] |
Khosravi Y, Balyani S. 2019. Spatial modeling of mean annual temperature in Iran: comparing cokriging and geographically weighted regression. Environmental Modeling and Assessment, 24:341-354.
doi: 10.1007/s10666-018-9623-5
|
|
|
| [33] |
Kindt R. 2018. Ensemble species distribution modelling with transformed suitability values. Environmental Modelling and Software, 100:136-145.
doi: 10.1016/j.envsoft.2017.11.009
|
|
|
| [34] |
Kumar S, Spaulding S A, Stohlgren T J, et al. 2009. Potential habitat distribution for the freshwater diatom Didymosphenia geminata in the continental US. Frontiers in Ecology and Environment, 7(8):415-420.
doi: 10.1890/080054
|
|
|
| [35] |
Kumar S, Neven L, Zhu H, et al. 2015. Assessing the global risk of establishment of Cydia pomonella (Lepidoptera: Totricidae) using CLIMEX and MaxEnt niche models. Journal of Economic Entomology, 108(4):1708-1719.
doi: 10.1093/jee/tov166
|
|
|
| [36] |
Lamelas-López L, Pardavila X, Borges P A V, et al. 2020. Modelling the distribution of Mustela nivalis and M. putorius in the Azores archipelago based on native and introduced ranges. PLoS ONE, 15(8):e0237216, doi: 10.1371/journal.pone.0237216.
doi: 10.1371/journal.pone.0237216
|
|
|
| [37] |
Linders T E W, Schaffner U, Eschen R, et al. 2019. Direct and indirect effects of invasive species: Biodiversity loss is a major mechanism by which an invasive tree affects ecosystem functioning. Ecology, 107:2660-2670.
|
|
|
| [38] |
Marmion M, Parviainen M, Luoto M, et al. 2009. Evaluation of consensus methods in predictive species distribution modelling. Diversity and Distributions, 15(1):59-69.
doi: 10.1111/ddi.2009.15.issue-1
|
|
|
| [39] |
Masocha M, Dube T. 2018. Global terrestrial biomes at risk of cacti invasion identified for four species using consensual modelling. Journal of Arid Environments, 156:77-86.
doi: 10.1016/j.jaridenv.2018.05.006
|
|
|
| [40] |
Naimi B, Araújo M B. 2016. SDM: a reproducible and extensible R platform for species distribution modelling. Ecography, 39(4):368-375.
doi: 10.1111/ecog.2016.v39.i4
|
|
|
| [41] |
Oldeland J, Dorigo W, Leickfeld L, et al. 2010. Combining vegetation indices, constrained ordination and fuzzy classification for mapping semi-natural vegetation units from hyperspectral imagery. Remote Sensing of Environment, 114(6):1155-1166.
doi: 10.1016/j.rse.2010.01.003
|
|
|
| [42] |
Pal J S, Eltahir E A B. 2015. Future temperature in southwest Asia projected to exceed a threshold for human adaptability. Nature Climate Change, 6:197-200.
doi: 10.1038/nclimate2833
|
|
|
| [43] |
Parmesan C. 2006. Ecological and evolutionary responses to recent climate change. Annual Review of Ecology, Evolution, and Systematics, 37:637-669.
doi: 10.1146/ecolsys.2006.37.issue-1
|
|
|
| [44] |
Pasiecznik N M, Felker P, Harris P J, et al. 2001. The Prosopis juliflora-Prosopis pallida Complex: A Monograph. UK: HDRA Coventry, 162.
|
|
|
| [45] |
Peknicová J, Berchová-Bímová K. 2016. Application of species distribution models for protected areas threatened by invasive plants. Journal for Nature Conservation, 34:1-7.
doi: 10.1016/j.jnc.2016.08.004
|
|
|
| [46] |
Perry M, Hollis D. 2005. The generation of monthly gridded datasets for a range of climatic variables over the UK. International Journal of Climatology, 25(8):1041-1054.
doi: 10.1002/(ISSN)1097-0088
|
|
|
| [47] |
Peterson A T, Papes M, Soberón J. 2008. Rethinking receiver operating characteristic analysis applications in ecological niche modeling. Ecological Modelling, 213(1):63-72.
doi: 10.1016/j.ecolmodel.2007.11.008
|
|
|
| [48] |
Phillips S J, Anderson R P, Schapire R E. 2006. Maximum entropy modeling of species geographic distributions. Ecological Modelling, 190(3-4):231-259.
doi: 10.1016/j.ecolmodel.2005.03.026
|
|
|
| [49] |
Phillips S J, Dudík M. 2008. Modeling of species distributions with MaxEnt: new extensions and a comprehensive evaluation. Ecography, 31(2):161-175.
doi: 10.1111/j.0906-7590.2008.5203.x
|
|
|
| [50] |
Phillips S J, Dudík M, Elith J, et al. 2009. Sample selection bias and presence-only distribution models: implications for background and pseudo-absence data. Ecological Applications, 19(1):181-197.
doi: 10.1890/07-2153.1
|
|
|
| [51] |
Poggiato G, Münkemüller T, Bystrova D, et al. 2021. On the interpretations of joint modeling in community ecology. Trends in Ecology and Evolution, 36(5):391-401.
doi: 10.1016/j.tree.2021.01.002
|
|
|
| [52] |
Rueda M N, Salgado-Roa F C, Gantiva Q C H, et al. 2021. Environmental drivers of diversification and hybridization in neotropical butterflies. Frontiers in Ecology and Evolution, 9:750703, doi: 10.3389/fevo.2021.750703.
doi: 10.3389/fevo.2021.750703
|
|
|
| [53] |
Ruiz G R, Bandera C F. 2017. Validation of calibrated energy models: Common errors. Energies, 10(10):1587.
doi: 10.3390/en10101587
|
|
|
| [54] |
Santini L, Benítez-López A, Maiorano L, et al. 2021. Assessing the reliability of species distribution projections in climate change research. Diversity and Distributions, 27(6):1035-1050.
doi: 10.1111/ddi.v27.6
|
|
|
| [55] |
Shrestha U B, Sharma K P, Devkota A, et al. 2018. Potential impact of climate change on the distribution of six invasive alien plants in Nepal. Ecological Indicators, 95:99-107.
doi: 10.1016/j.ecolind.2018.07.009
|
|
|
| [56] |
Singh S. 2018. Understanding the role of slope aspect in shaping the vegetation attributes and soil properties in Montane ecosystems. Tropical Ecology, 59(3):417-430.
|
|
|
| [57] |
Srivastava V, Griess V C, Padalia H. 2018. Mapping invasion potential using ensemble modelling. A case study on Yushaniamaling in the Darjeeling Himalayas. Ecological Modelling, 385:35-44.
doi: 10.1016/j.ecolmodel.2018.07.001
|
|
|
| [58] |
Stohlgren T J, Ma P, Kumar S, et al. 2010. Ensemble habitat mapping of invasive plant species. Risk Analysis, 30(2):224-235.
doi: 10.1111/j.1539-6924.2009.01343.x
pmid: 20136746
|
|
|
| [59] |
Wakie T T, Evangelista P H, Jarnevich S, et al. 2014. Mapping current and potential distribution of non-native Prosopis juliflora in the Afar region of Ethiopia. PLoS ONE, 9(11):e112854, doi: 10.1371/journal.pone.0112854.
doi: 10.1371/journal.pone.0112854
|
|
|
| [60] |
Warren D L, Seifert S N. 2011. Ecological niche modeling in MaxEnt: The importance of model complexity and the performance of model selection criteria. Ecological Applications, 21(2):335-342.
doi: 10.1890/10-1171.1
|
|
|
| [61] |
Yang X, Xie X, Liu D L, et al. 2015. Spatial interpolation of daily rainfall data for local climate impact assessment over Greater Sydney region. Advances in Meteorology, (2):523629, doi: 10.1155//2015/563629.
doi: 10.1155//2015/563629
|
|
|
| [62] |
Yin Q, Adeli E, Shen L, et al. 2021. Population-guided large margin classifier for high-dimension low-sample-size problems. Machine Learning, 79:107030, doi: 10.1016/j.patcog.2019.107030.
doi: 10.1016/j.patcog.2019.107030
|
|
|
|
Viewed |
|
|
|
Full text
|
|
|
|
|
Abstract
|
|
|
|
|
Cited |
|
|
|
|
| |
Shared |
|
|
|
|
| |
Discussed |
|
|
|
|