| Research article |
|


|
|
|
| Integrating multiple electromagnetic data to map spatiotemporal variability of soil salinity in Kairouan region, Central Tunisia |
Besma ZARAI1,2,*( ), Christian WALTER3, Didier MICHOT3, Jean P MONTOROI4, Mohamed HACHICHA1 ), Christian WALTER3, Didier MICHOT3, Jean P MONTOROI4, Mohamed HACHICHA1 |
1University of Carthage, National Research Institute of Rural Engineering, Water and Forestry LR16INRGREF02, Non-Conventional Water Valorization, Ariana 2080, Tunisia
2National Institute of Agronomy Tunis, University of Carthage, Nicolle 1082, Tunisia
3SAS, Mixed Research Unit Soil Agro and Hydrosystem Spatialization, INRAE, National Research Institute for Agriculture, Food and the Environment, Rennes 35000, France
4Bondy Research and Development Institute, Bondy 93140, France |
|
|
|
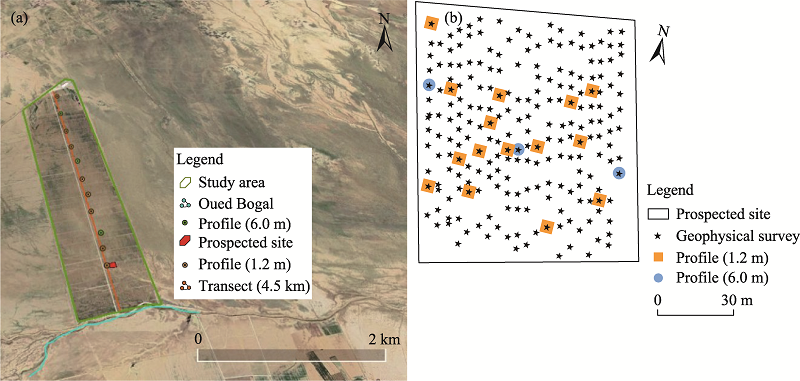
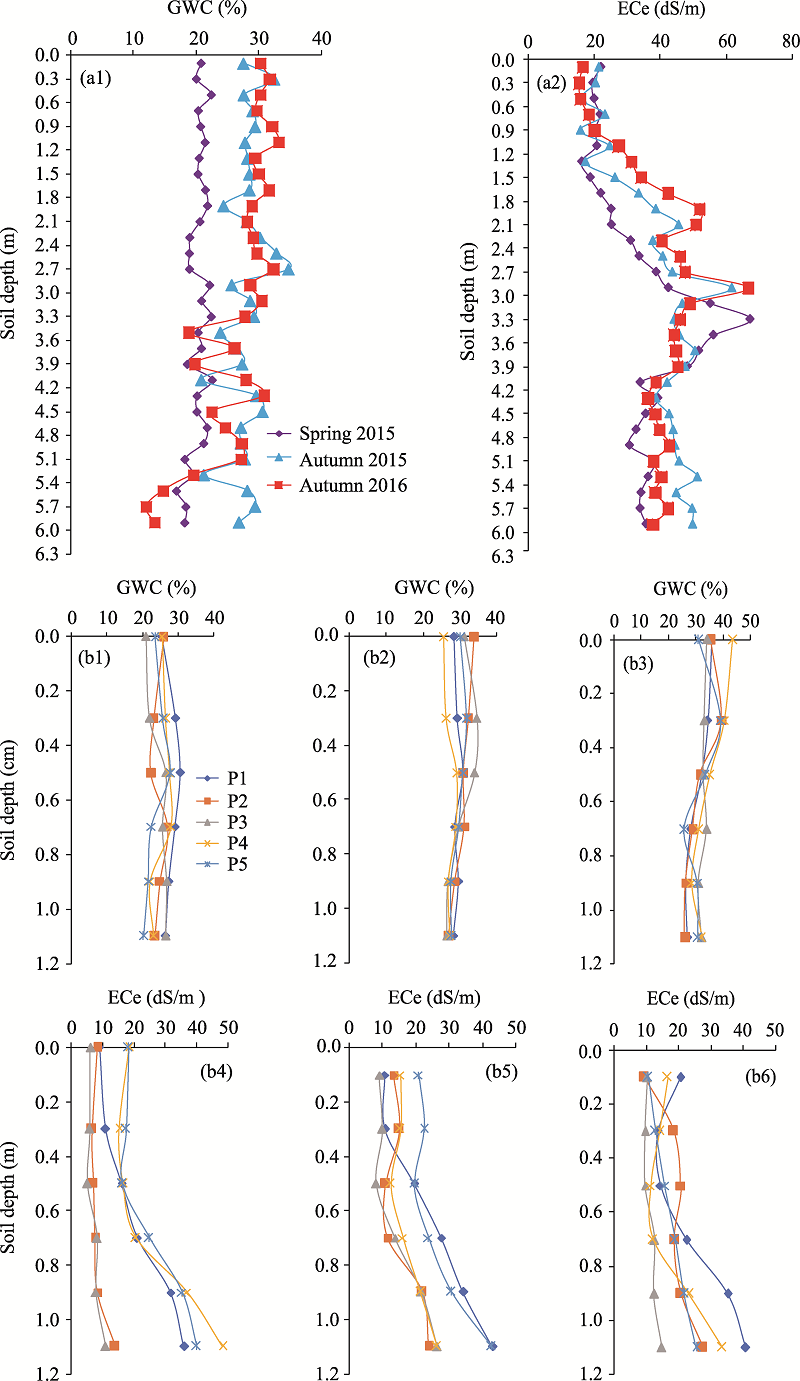
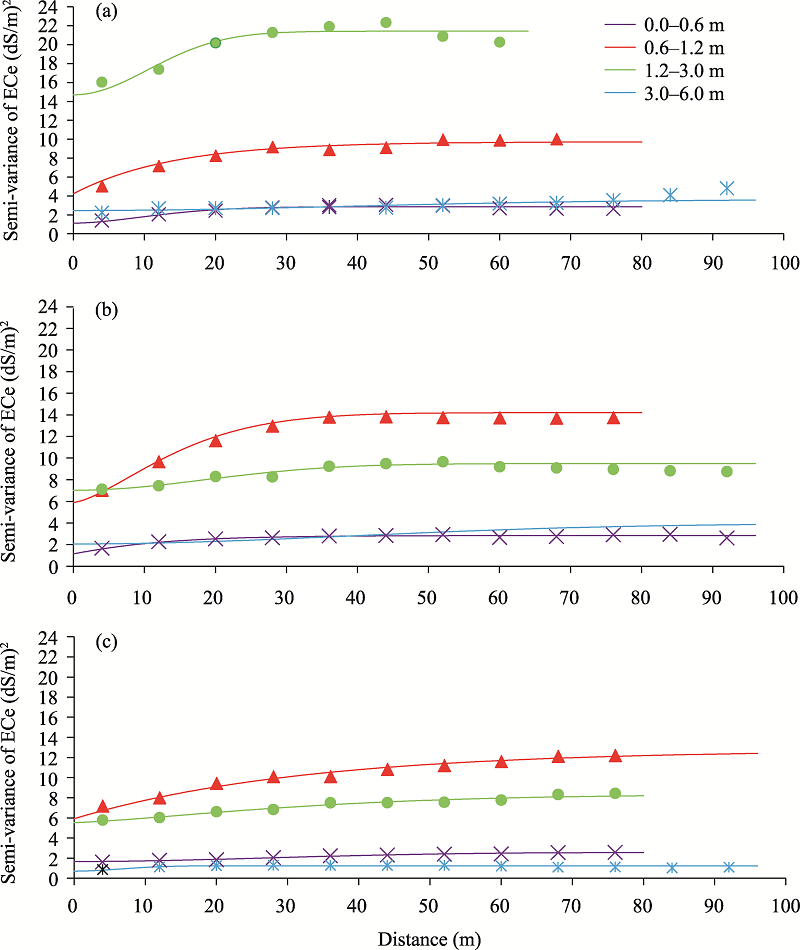
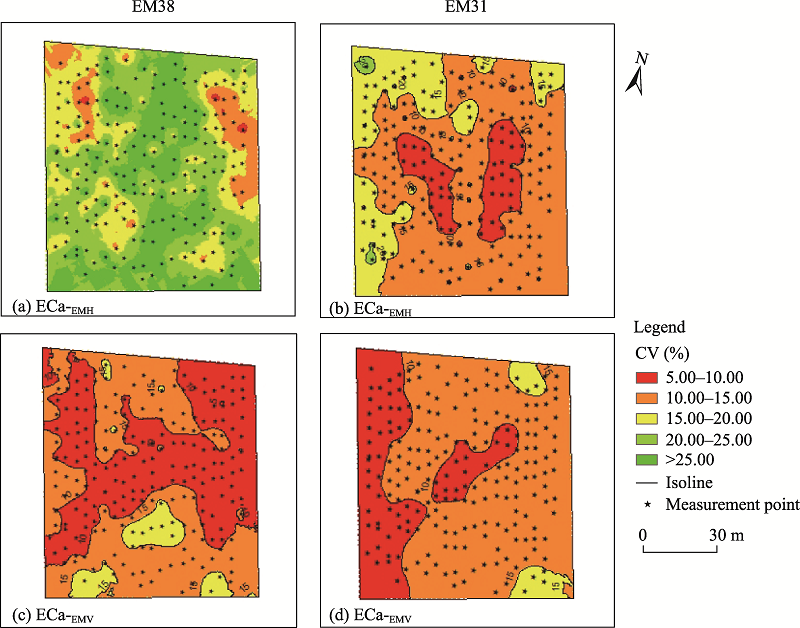
Abstract Soil salinization is a major problem affecting soils and threatening agricultural sustainability in arid and semi-arid regions, which makes it necessary to establish an efficient strategy to manage soil salinity and confront economic challenges that arise from it. Saline soil recovery involving drainage of shallow saline groundwater and the removal of soil salts by natural rainfall or by irrigation are good strategies for the reclamation of salty soil. To develop suitable management strategies for salty soil reclamation, it is essential to improve soil salinity assessment process/mechanism and to adopt new approaches and techniques. This study mapped a recovered area of 7200 m2to assess and verify variations in soil salinity in space and time in Kairouan region in Central Tunisia, taking into account the thickness of soil materials. Two electromagnetic conductivity meters (EM38 and EM31) were used to measure the electrical conductivity of saturated soil-paste extract (ECe) and apparent electrical conductivity (ECa). Multiple linear regression was established between ECe and ECa, and it was revealed that ECa-EM38 is optimal for ECe prediction in the surface soils. Salinity maps demonstrated that the spatial structure of soil salinity in the region of interest was relatively unchanged but varied temporally. Variation in salinity at the soil surface was greater than that at a depth. These findings can not only be used to track soil salinity variations and their significance in the field but also help to identify the spatial and temporal features of soil salinity, thus improving the efficiency of soil management.
|
|
Received: 17 December 2020
Published: 28 February 2022
|
|
Corresponding Authors:
*Besma ZARAI (E-mail: bessmazarai@yahoo.fr)
|
|
|
| [1] |
Adam I, Michot D, Guero Y, et al. 2012. Detecting soil salinity changes in irrigated vertisols by electrical resistivity prospection during a desalinisation experiment. Agricultural Water Management, 109:1-10.
doi: 10.1016/j.agwat.2012.01.017
|
|
|
| [2] |
Amakor X N, Jacobson A R, Cardon G E, et al. 2014. A comparison of salinity measurement methods based on soil saturated pastes. Geoderma, 219-220:32-39.
doi: 10.1016/j.geoderma.2013.12.010
|
|
|
| [3] |
Amezketa E. 2007. Use of an electromagnetic technique to determine sodicity in saline-sodic soils. Soil Use and Management, 23(3):278-285.
doi: 10.1111/sum.2007.23.issue-3
|
|
|
| [4] |
Amezketa E, de Lersundi J D V. 2008. Soil classification and salinity mapping for determining restoration potential of cropped riparian areas. Land Degradation & Development, 19(2):153-164.
doi: 10.1002/(ISSN)1099-145X
|
|
|
| [5] |
Aragüés R, Urdanoz V, Çetin M, et al. 2011. Soil salinity related to physical soil characteristics and irrigation management in four Mediterranean irrigation districts. Agricultural Water Management, 98(6):959-966.
doi: 10.1016/j.agwat.2011.01.004
|
|
|
| [6] |
Barbiero L, Cunnac S, Mané L, et al. 2001. Salt distribution in the Senegal middle valley: analysis of a saline structure on planned irrigation schemes from N'Galenka creek. Agricultural Water Management, 46(3):201-213.
doi: 10.1016/S0378-3774(00)00088-3
|
|
|
| [7] |
Bellier G, Gaaloul N, Job J O, et al. 1997. Soil interpretation of electromagnetic and electrical data. Application to the watershed of El Gouazine (central Tunisia). https://www.researchgate.net/publication/32969769_Interpretation_pedologique_de_donnees_electromagnetiques_et_electriques_application_au_bassin_versant_d'El_ Gouazine_Tunisie_centrale .
|
|
|
| [8] |
Berkal I, Walter C, Michot D, et al. 2014. Seasonal monitoring of soil salinity by electromagnetic conductivity in irrigated sandy soils from a Saharan oasis. Soil Research, 52(8):769-780.
doi: 10.1071/SR13305
|
|
|
| [9] |
Blackmore S. 2000. The interpretation of trends from multiple yield maps. Computers and Electronics in Agriculture, 26(1):37-51.
doi: 10.1016/S0168-1699(99)00075-7
|
|
|
| [10] |
Cassel F, Goorahoo D, Sharmasarkar S. 2015. Salinization and yield potential of a salt-laden Californian Soil: an in situ geophysical analysis. Water, Air, & Soil Pollution, 226 : 422, doi: 10.1007/s11270-015-2682-1.
doi: 10.1007/s11270-015-2682-1
|
|
|
| [11] |
Corwin D L, Lesch S M. 2003. Application of soil electrical conductivity to precision agriculture. Agronomy Journal, 95(3):455-471.
|
|
|
| [12] |
Corwin D L, Lesch S M. 2005. Apparent soil electrical conductivity measurements in agriculture. Computers and Electronics in Agriculture, 46:11-43.
doi: 10.1016/j.compag.2004.10.005
|
|
|
| [13] |
Doolittle J A, Brevik E C. 2014. The use of electromagnetic induction techniques in soils studies. Geoderma, 223-225:33-45.
doi: 10.1016/j.geoderma.2014.01.027
|
|
|
| [14] |
Douaoui A E K, Nicolas H, Walter C. 2006. Detecting salinity hazards within a semiarid context by means of combining soil and remote-sensing data. Geoderma, 134(1-2):217-230.
doi: 10.1016/j.geoderma.2005.10.009
|
|
|
| [15] |
ESRI (Environmental Systems Research Institute). 2010. Geostatistical Analyst Tutorial. 57. [2021-12-26] https://help.arcgis.com/es/arcgisdesktop/10.0/pdf/tutorial_geostatistical_analyst.pdf .
|
|
|
| [16] |
Gascuel-Odoux C, Boivin P. 1994. Variability of variograms and spatial estimates due to soil sampling: a case study. Geoderma, 62(1-3):165-182.
doi: 10.1016/0016-7061(94)90034-5
|
|
|
| [17] |
Guo Y, Huang J, Shi Z, et al. 2015. Mapping spatial variability of soil salinity in a coastal paddy field based on electromagnetic sensors. PloS ONE, 10(5):e0127996, doi: 10.1371/journal.pone.0127996.
doi: 10.1371/journal.pone.0127996
|
|
|
| [18] |
Hachicha M, Cheverry C, Mhiri A. 2000. The impact of long-term irrigation on changes of ground water level and soil salinity in northern Tunisia. Arid Soil Resarch and Rehabilation, 14:175-182.
|
|
|
| [19] |
Hachicha M. 2007. Salty Soils and their developement in Tunisia. Secheresse, 18(1):45-50. (in French)
|
|
|
| [20] |
Hajrasuliha S, Cassel D, Rezainejad Y. 1991. Estimation of chloride ion concentration in saline soils from measurement of electrical conductivity of saturated soil extracts. Geoderma, 49(1-2):117-127.
doi: 10.1016/0016-7061(91)90095-B
|
|
|
| [21] |
Hendrickx J, Borchers B, Corwin D, et al. 2002. Inversion of soil conductivity profiles from electromagnetic induction measurements: Theory and experimental verification. Soil Science Society of America Journal, 66(3):673-685.
|
|
|
| [22] |
Hosseini E, Gallichand J, Marcotte D. 1994. Theoretical and experimental performance of spatial interpolation methods for soil salinity analysis. Transactions of the American Society of Agricultural Engineers, 37:1799-1807.
doi: 10.13031/2013.28269
|
|
|
| [23] |
Huang J, Mokhtari A R, Cohen D R, et al. 2015. Modelling soil salinity across a gilgai landscape by inversion of EM38 and EM31 data. European Journal of Soil Science, 66(5):951-960.
doi: 10.1111/ejss.2015.66.issue-5
|
|
|
| [24] |
Huang J, Monteiro Santos F A, Triantafilis J. 2016. Mapping soil water dynamics and a moving wetting front by spatiotemporal inversion of electromagnetic induction data. Water Resources Research, 52(11):9131-9145.
doi: 10.1002/wrcr.v52.11
|
|
|
| [25] |
Job J O, Tabbagh A, Hachicha M. 1995. Determination by electromagnetic method of the salt concentration of an irrigated soil. Canadian Journal of Soil Science, 75:463-469. (in French)
doi: 10.4141/cjss95-067
|
|
|
| [26] |
Johnson C K, Eskridge K M, Corwin D L. 2005. Apparent soil electrical conductivity: applications for designing and evaluating field-scale experiments. Computers and Electronics in Agriculture, 46(1-3):181-202.
doi: 10.1016/j.compag.2004.12.001
|
|
|
| [27] |
Lesch S M, Rhoades J D, Herrero J. 1998. Monitoring for temporal changes in soil salinity using electromagnetic induction techniques. Soil Science Society of America Journal, 62(1):232-242.
doi: 10.2136/sssaj1998.03615995006200010030x
|
|
|
| [28] |
Marlet S. 2004. Evolution of irrigation systems and management of the salinity of irrigated land. [2021-12-10]. https://www.researchgate.net/publication/29646266_Evolution_des_systemes_d'irrigation_et_gestion_de_la_salinite_des_terres_irriguees . (in French)
|
|
|
| [29] |
McNeill J D. 1980. Electromagnetic terrain conductivity measurement at low induction numbers. Technical Notes No. TN-6. Geonics Limited, Mississauga, Ontario, Canada, 13.
|
|
|
| [30] |
Michot D, Benderitter Y, Dorigny A, et al. 2003. Spatial and temporal monitoring of soil water content with an irrigated corn crop cover using surface electrical resistivity tomography. Water Resources Research, 39(5):1138, doi: 10.1029/2002WR001581.
doi: 10.1029/2002WR001581
|
|
|
| [31] |
Michot D, Walter C, Adam I, et al. 2013. Digital assessment of soil-salinity dynamics after a major flood in the Niger River valley. Geoderma, 207-208:193-204.
doi: 10.1016/j.geoderma.2013.05.012
|
|
|
| [32] |
Odeh I O A, Todd A, Triantafilis J, et al. 1998. Status and trends of soil salinity at different scales: the case for the irrigated cotton growing region of eastern Australia. Nutrient Cycling in Agroecosystems, 50:99-107.
doi: 10.1023/A:1009763522702
|
|
|
| [33] |
Oliver M A, Webster R. 2014. A tutorial guide to geostatistics: Computing and modelling variograms and kriging. CATENA, 113:56-69.
doi: 10.1016/j.catena.2013.09.006
|
|
|
| [34] |
Omonode R A, Vyn T J. 2006. Spatial dependence and relationships of electrical conductivity to soil organic matter, phosphorus, and potassium. Soil Science, 171(3):223-238.
doi: 10.1097/01.ss.0000199698.94203.a4
|
|
|
| [35] |
Padhi J, Misra R K. 2011. Sensitivity of EM38 in determining soil water distribution in an irrigated wheat field. Soil and Tillage Research, 117:93-102.
doi: 10.1016/j.still.2011.09.003
|
|
|
| [36] |
Paz A M, Castanheira N, Farzamian M, et al. 2020. Prediction of soil salinity and sodicity using electromagnetic conductivity imaging. Geoderma, 314:114086, doi: 10.1016/j.geoderma.2019.114086.
doi: 10.1016/j.geoderma.2019.114086
|
|
|
| [37] |
Pitman M G, Läuchli A. 2004. Global Impact of Salinity and Agricultural Ecosystems. In: Läuchli A, Lüttge U. Salinity: Environment - Plants - Molecules. Dordrecht: Kluwer Academic Publishers, 3-20.
|
|
|
| [38] |
Provin T, Pitt J L. 2001 Managing soil salinity. Texas FARMER Collection. Texas A&M University System. [2021-12-26]. http://publications.tamu.edu/SOIL_CONSERVATION_NUTRIENTS/PUB_soil_Managing%20Soil%20Salinity.pdf .
|
|
|
| [39] |
Rhoades J D, Corwin D L. 1981. Determining soil electrical conductivity-depth relations using an inductive electromagnetic soil conductivity meter. Soil Science Society of America Journal, 45(2):255-260.
doi: 10.2136/sssaj1981.03615995004500020006x
|
|
|
| [40] |
Rhoades J D, Lesch S M, Shouse P J. 1989. New calibrations for determining soil electrical conductivity—Depth relations from electromagnetic measurements. Soil Science society of America Journal, 53(1):74-79.
doi: 10.2136/sssaj1989.03615995005300010014x
|
|
|
| [41] |
Safar T. 1983. Pedology and geochemistry of salty environments contribution to the study of the dynamics of salts in an irrigated and undrained alluvial plain. PhD Dissertation. Lorraine: National Institute of Technology, 131. (in French)
|
|
|
| [42] |
Shi Z, Li Y, Wang R C. 2005. Assessment of temporal and spatial variability of soil salinity in a coastal saline field. Environmental Geology, 48:171-178.
doi: 10.1007/s00254-005-1285-3
|
|
|
| [43] |
Sousa E D T, Queiroz D M, Rosas J T F, et al. 2021. Spatial variability of soil apparent electrical conductivity - effect of the number of subsamples. Engenharia Agrícola, 41(3):396-401.
doi: 10.1590/1809-4430-eng.agric.v41n3p396-401/2021
|
|
|
| [44] |
Thomas M, Fitzpatrick R W, Heinson G S. 2009. Distribution and causes of intricate saline-sodic soil patterns in an upland South Australian hillslope. Australian Journal of Soil Research, 47(3):328-339.
|
|
|
| [45] |
Trabelsi R, Zaïri M, Smida H, et al. 2005. Salinization of coastal aquifers: case of the aquifer north of the Sahel of Sfax, Tunisia. Comptes Rendus Geoscience, 337:515-524. (in French)
doi: 10.1016/j.crte.2005.01.010
|
|
|
| [46] |
Triantafilis J, Huckel A I, Odeh I O A. 2001a. Comparison of statistical prediction methods for estimating field-scale clay content using different combinations of ancillary variables. Soil Science, 166(6):415-427
doi: 10.1097/00010694-200106000-00007
|
|
|
| [47] |
Triantafilis J, Odeh I O A, McBratney A B. 2001b. Five geostatistical models to predict soil salinity from electromagnetic induction data across irrigated cotton. Soil Science Society of America Journal, 65(3):869-878.
doi: 10.2136/sssaj2001.653869x
|
|
|
| [48] |
Walter C, McBratney A B, Douaoui A, et al. 2001. Spatial prediction of topsoil salinity in the Chelif Valley, Algeria, using local ordinary Kriging with local variograms versus whole-area variogram. Soil Research, 39:259-272.
doi: 10.1071/SR99114
|
|
|
| [49] |
Wang F, Yang S, Wei Y, et al. 2021. Characterizing soil salinity at multiple depth using electromagnetic induction and remote sensing data with random forests: A case study in Tarim River Basin of southern Xinjiang, China. Science of the Total Environment, 754:142030, doi: 10.1016/j.scitotenv.2020.142030.
doi: 10.1016/j.scitotenv.2020.142030
|
|
|
| [50] |
Webster R, Oliver M A. 1992. Sample adequately to estimate variograms of soil properties. European Journal of Soil Science, 43(1):177-192.
|
|
|
| [51] |
Williams B G, Baker G C. 1982. An electromagnetic induction technique for reconnaissance surveys of soil salinity hazards. Soil Research, 20(2):107-118.
doi: 10.1071/SR9820107
|
|
|
| [52] |
Zhang Y, Li X, Šimůnek J, et al. 2021. Evaluating soil salt dynamics in a field drip-irrigated with brackish water and leached with freshwater during different crop growth stages. Agricultural Water Management, 244:106601, doi: 10.1016/j.agwat.2020.106601.
doi: 10.1016/j.agwat.2020.106601
|
|
|
| [53] |
Zhao D, Li N, Zare E, et al. 2020. Mapping cation exchange capacity using a quasi-3d joint inversion of EM38 and EM31 data. Soil and Tillage Research, 200:104618, doi: 10.1016/j.still.2020.104618.
doi: 10.1016/j.still.2020.104618
|
|
|
|
Viewed |
|
|
|
Full text
|
|
|
|
|
Abstract
|
|
|
|
|
Cited |
|
|
|
|
| |
Shared |
|
|
|
|
| |
Discussed |
|
|
|
|