| Research article |
|


|
|
|
| Monitoring rock desert formation caused by two different origins (ice-snow melting and drying) in the Qinghai-Tibet Plateau of China by considering topographic and meteorological elements |
JIA Wei1,2, SHI Peijun3,4,*( ), WANG Jing'ai1,4,5, MA Weidong2, XIA Xingsheng2,3, ZHOU Yuantao2 ), WANG Jing'ai1,4,5, MA Weidong2, XIA Xingsheng2,3, ZHOU Yuantao2 |
1Key Laboratory of Tibetan Plateau Land Surface Processes and Ecological Conservation (Ministry of Education), Qinghai Normal University, Xining 810008, China
2School of Geographical Sciences, Qinghai Normal University, Xining 810008, China
3Academy of Plateau Science and Sustainability, Qinghai Normal University, Xining 810008, China
4Key Laboratory of Environmental Change and Natural Disaster, Ministry of Education, Beijing Normal University, Beijing 100875, China
5Faculty of Geographical Science, Beijing Normal University, Beijing 100875, China |
|
|
|
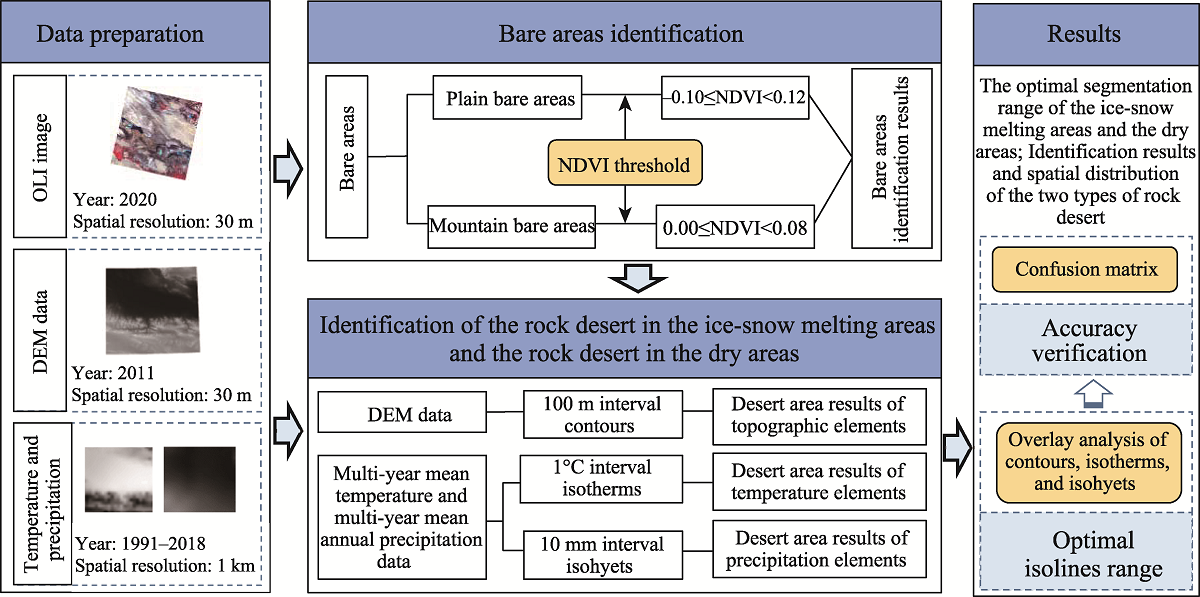
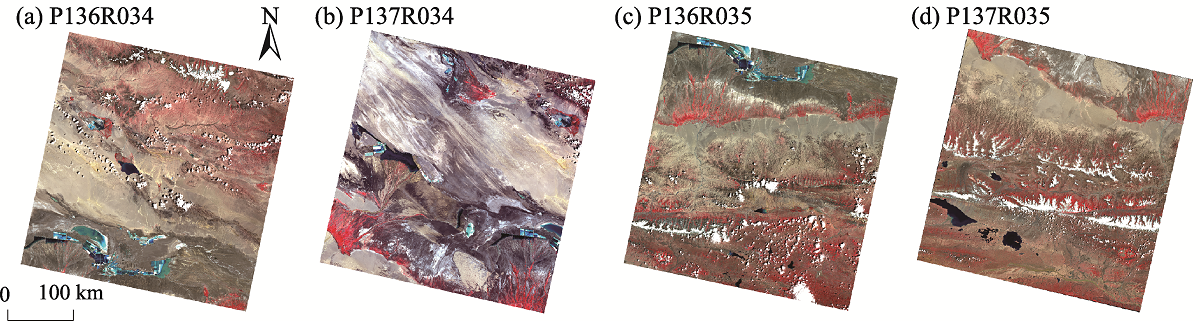
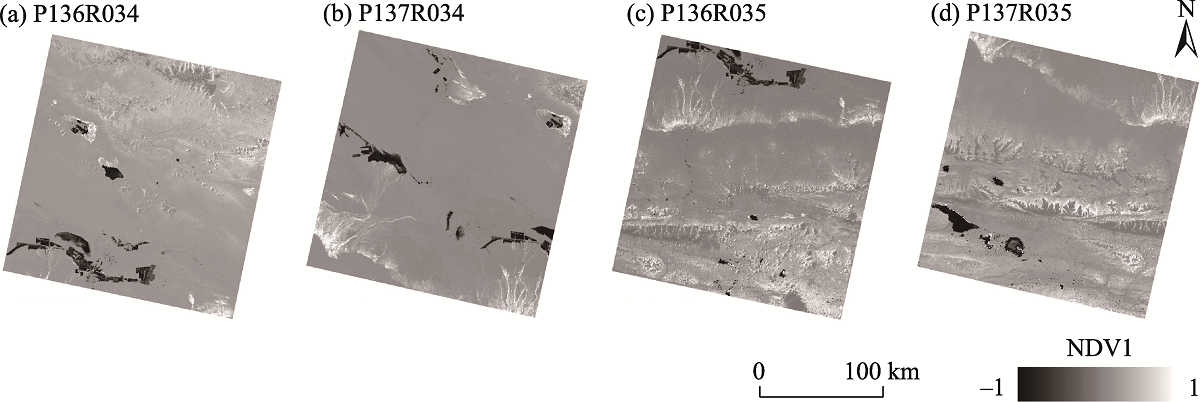
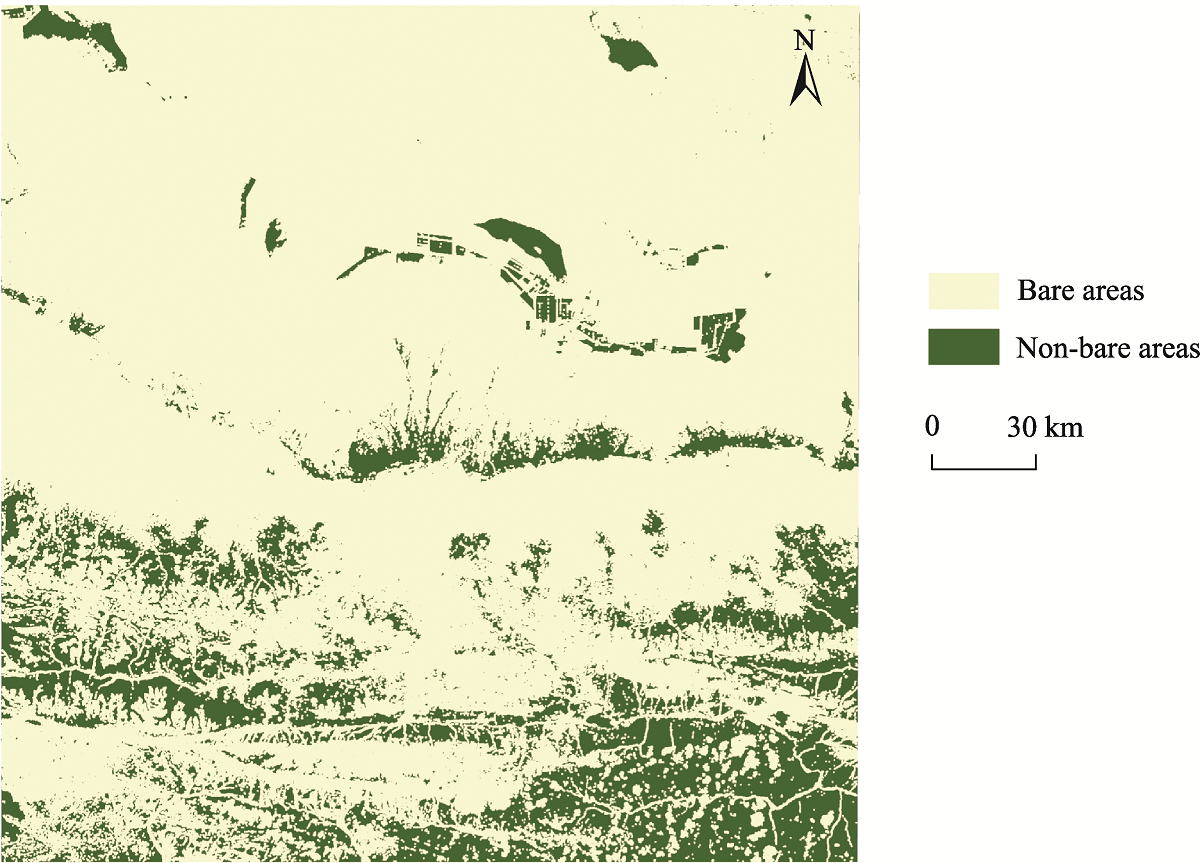
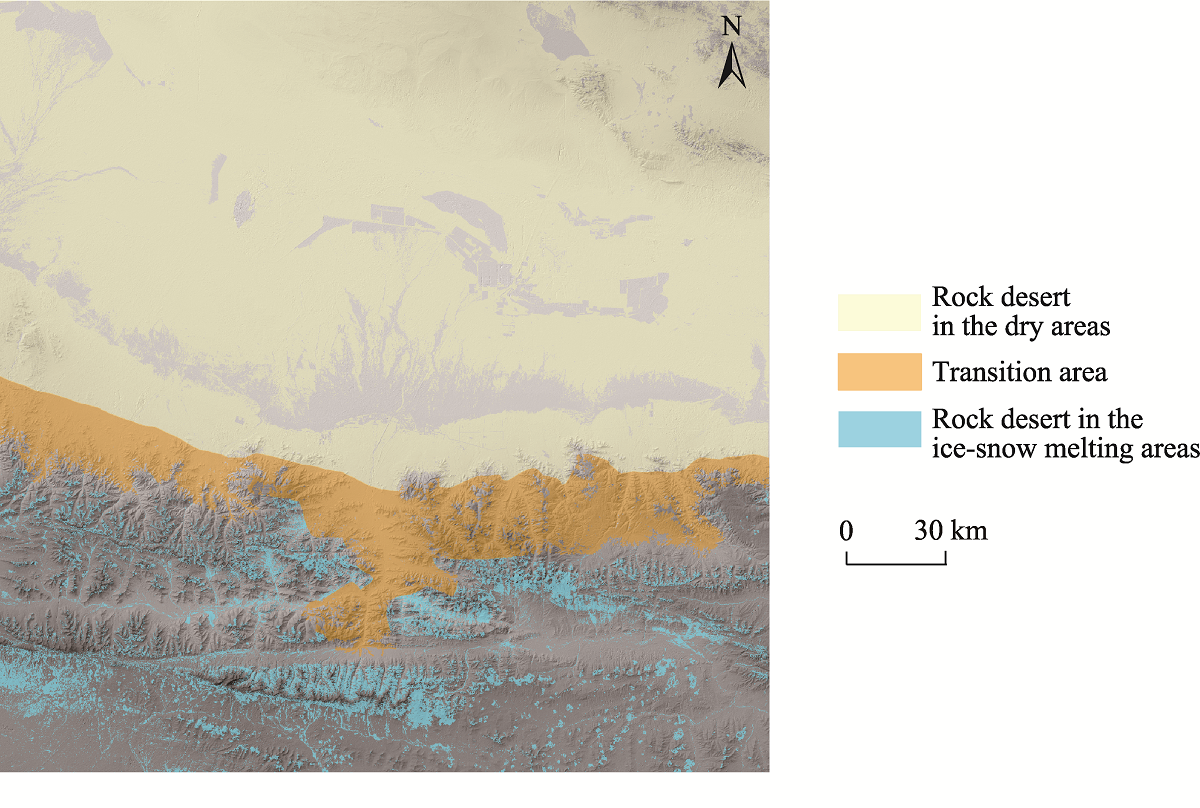
Abstract Monitoring rock desert formation caused by two different origins (ice-snow melting and drying) through remote sensing is crucial to our understanding of the interaction between the underlying surface of different rock desert and land-atmosphere types, as well as the relationship between bare land and soil erosion. A number of achievements have been made in remote sensing monitoring of desert areas, but there is a lack of accurate classification and remote sensing identification of rock desert types based on formation mechanism. In this study, the north and south sides of the eastern Kunlun Mountains in the northern part of the Qinghai-Tibet Plateau of China were taken as the study areas. Landsat operational landscape imager, digital elevation model, and precipitation and temperature grid data were used as data sources. By identifying the bare areas based on the normalized difference vegetation index (NDVI), we used the multi-element fusion method of contours, isotherms, and isohyets to identify the rock desert types in the ice-snow melting and dry areas. The results showed that: (1) the rock desert areas identified by remote sensing based on topographic and meteorological elements were highly accurate, with an overall accuracy of 88.45% and kappa coefficient of 0.77. The multi-element fusion method of contours, isotherms, and isohyets could effectively identify the rock desert types in the ice-snow melting and dry areas; (2) the optimal segmentation range of the ice-snow melting and dry areas was 3600 m contour, -2°C-2°C isotherms, and 100-130 mm isohyets. The areas with elevation less than 3600 m, annual average temperature higher than 2°C, and average annual precipitation less than 100 mm were rock desert in the dry areas. The range of -2°C-2°C isotherms and 100-130 mm isohyets was the transition area between the ice-snow melting and dry areas. The areas with elevation higher than 3600 m, annual average temperature less than -2°C, and average annual precipitation higher than 130 mm were rock desert in the ice-snow melting areas; and (3) the identification accuracy of the bare areas based on the NDVI method was better, specifically, the identification accuracy of plain bare areas was generally better than that of mountain bare areas. The remote sensing identification method considers not only the topographic factors that have great influence on the spatial distribution of the two types of rock desert areas, but also the meteorological factors, which can provide a scientific reference for the effective identification of the two types of rock desert areas.
|
|
Received: 14 May 2022
Published: 30 August 2022
|
|
Corresponding Authors:
* SHI Peijun (E-mail: spj@bnu.edu.cn)
|
| Cite this article:
JIA Wei, SHI Peijun, WANG Jing'ai, MA Weidong, XIA Xingsheng, ZHOU Yuantao. Monitoring rock desert formation caused by two different origins (ice-snow melting and drying) in the Qinghai-Tibet Plateau of China by considering topographic and meteorological elements. Journal of Arid Land, 2022, 14(8): 849-866.
URL:
http://jal.xjegi.com/10.1007/s40333-022-0100-2 OR http://jal.xjegi.com/Y2022/V14/I8/849
|
|
|
| [1] |
Böhner J. 2006. General climatic controls and topoclimatic variations in central and high Asia. Boreas, 35(2): 279-295.
doi: 10.1111/j.1502-3885.2006.tb01158.x
|
|
|
| [2] |
Çağlar Uzuner, Orhan Dengiz. 2020. Desertification risk assessment in Turkey based on environmentally sensitive areas. Ecological Indicators, 114: 106295, doi: 10.1016/j.ecolind.2020.106295.
doi: 10.1016/j.ecolind.2020.106295
|
|
|
| [3] |
Chang X L, Jin H J, He R X, et al. 2017. Evolution and changes of permafrost on the Qinghai-Tibet Plateau during the late quaternary. Sciences in Cold and Arid Regions, 9(1): 1-19. (in Chinese)
|
|
|
| [4] |
Cristina N M, Abigail M S V. 2017. Assessing the progress of desertification of the southern edge of Chihuahuan Desert: A case study of San Luis Potosi Plateau. Journal of Geographical Sciences, 27(3): 420-438.
doi: 10.1007/s11442-017-1385-5
|
|
|
| [5] |
Dawelbait M, Morari F. 2012. Monitoring desertification in a Savannah region in Sudan using Landsat images and spectral mixture analysis. Journal of Arid Environments, 80: 45-55.
doi: 10.1016/j.jaridenv.2011.12.011
|
|
|
| [6] |
Eisfelder C, Kuenzer C, Dech S. 2012. Derivation of biomass information for semi-arid areas using remote-sensing data. International Journal of Remote Sensing, 33: 2937-2984.
doi: 10.1080/01431161.2011.620034
|
|
|
| [7] |
Gevaert A I, Miralles D G, de Jeu R A M, et al. 2017. Soil moisture-temperature coupling in a set of land surface models. Journal of Geophysical Research: Atmospheres, 123: 1481-1498.
doi: 10.1002/2017JD027346
|
|
|
| [8] |
Guo B, Wei C X, Yu Y, et al. 2021. The dominant influencing factors of desertification changes in the source region of Yellow River: Climate change or human activity? Science of the Total Environment, 813(2): 152512, doi: 10.1016/j.scitotenv.2021.152512.
doi: 10.1016/j.scitotenv.2021.152512
|
|
|
| [9] |
Han J, Wang J, Chen L, et al. 2021. Driving factors of desertification in Qaidam Basin, China: An 18-year analysis using the geographic detector model. Ecological Indicators, 124: 107404, doi: 10.1016/j.ecolind.2021.107404.
doi: 10.1016/j.ecolind.2021.107404
|
|
|
| [10] |
He J, Yang K, Tang W J, et al. 2020. The first high-resolution meteorological forcing dataset for land process studies over China. Scientific Data, 7: 25, doi: 10.1038/s41597-020-0369-y.
doi: 10.1038/s41597-020-0369-y
|
|
|
| [11] |
Hendersonsellers A. 1996. Interactions of desertification and climate. Applied Geography, 16(3): 257-258.
|
|
|
| [12] |
Higginbottom T, Symeonakis E. 2014. Assessing land degradation and desertification using vegetation index data: current frameworks and future directions. Remote Sensing, 6(10): 9552, doi: 10.3390/rs6109552.
doi: 10.3390/rs6109552
|
|
|
| [13] |
Hu G Y, Dong Z B, Lu J F, et al. 2015. The developmental trend and influencing factors of aeolian desertification in the Zoige Basin, eastern Qinghai-Tibet Plateau. Aeolian Research, 19: 275-281.
doi: 10.1016/j.aeolia.2015.02.002
|
|
|
| [14] |
Hu Y F, Han Y P, Zhang Y Z. 2020. Land desertification and its influencing factors in Kazakhstan. Journal of Arid Environments, 180: 104203, doi: 10.1016/j.jaridenv.2020.104203.
doi: 10.1016/j.jaridenv.2020.104203
|
|
|
| [15] |
Hua T, Wang X M, Ci Z, et al. 2012. Responses of desertification to climate change in arid and semiarid regions of China over the past millennium. Journal of Desert Research, 32(3): 618-624. (in Chinese)
|
|
|
| [16] |
Javier T, Silva P, Barbosa A A, et al. 2018. Desertification trends in the Northeast of Brazil over the period 2000-2016. International Journal of Applied Earth Observation and Geoinformation, 73: 197-206.
doi: 10.1016/j.jag.2018.06.012
|
|
|
| [17] |
Jia W, Wang J A, Shi P J, et al. 2021. The progress and prospect of remote sensing monitoring of rocky desert dynamic changes in the ice and snow melting area of the Qinghai-Tibet Plateau. Journal of Geo-information Science, 23(10): 1715-1727. (in Chinese)
|
|
|
| [18] |
Jia W, Ma W D, Shi P J, et al. 2022. Monitoring rock desert formation caused by ice-snow melting in the Qinghai-Tibet Plateau using an optimized remote sensing technique: A case study of Yushu Prefecture. Remote Sensing, 14: 570, doi: 10.3390/rs14030570.
doi: 10.3390/rs14030570
|
|
|
| [19] |
Kang S C, Zhang Q Q, Qian Y, et al. 2019. Linking atmospheric pollution to cryospheric change in the Third Pole Region: current progress and future prospects. National Science Review, 4: 796-809.
|
|
|
| [20] |
Kefi S, Rietkerk M, Alados C L, et al. 2007. Spatial vegetation patterns and imminent desertification in Mediterranean arid ecosystems. Nature, 449(7159): 213-217.
doi: 10.1038/nature06111
|
|
|
| [21] |
Kong Y H, Jing M L. 2012. Research of the classification method based on confusion matrixes and ensemble learning. Computer Engineering & Science, 34: 111-117. (in Chinese)
|
|
|
| [22] |
Lamchin M, Lee J, Lee W, et al. 2016. Assessment of land cover change and desertification using remote sensing technology in a local region of Mongolia. Advances in Space Research, 57(1): 64-77.
doi: 10.1016/j.asr.2015.10.006
|
|
|
| [23] |
Li C, Zhao S S, Wang Q, et al. 2018. Uncertainty modeling and analysis of surface area calculation based on a regular grid digital elevation model (DEM). International Journal of Geographical Information Science, 32(2): 1-23.
doi: 10.1080/13658816.2017.1368523
|
|
|
| [24] |
Li H, Fu C, Guo W, et al. 2015. Study of energy partitioning and its feedback on the microclimate over different surfaces in an arid zone. Acta Physica Sinica, 64(5): 438-451. (in Chinese)
|
|
|
| [25] |
Li Q, Zhang C L, Shen Y P, et al. 2016. Quantitative assessment of the relative roles of climate change and human activities in desertification processes on the Qinghai-Tibetan Plateau based on net primary productivity. CATENA, 147: 789-796.
doi: 10.1016/j.catena.2016.09.005
|
|
|
| [26] |
Li Q, Zhang C L, Zhou N, et al. 2018. Spatial distribution of aeolian desertification on the Qinghai-Tibetan Plateau. Journal of Desert Research, 38(4): 690-700. (in Chinese)
|
|
|
| [27] |
Li S, Gao S Y, Yang P, et al. 2005. Some problems of freeze-thaw desertification in the Tibetan Plateau: a case study on the desertification regions of the western and northern Plateau. Journal of Glaciology and Geocryology, 27(4): 476-485. (in Chinese)
|
|
|
| [28] |
Liu Y Q, He Q, Zhang H S, et al. 2011. Studies of land-atmosphere interaction parameters in Taklimakan desert hinterland. Plateau Meteorology, 30(5): 1294-1299. (in Chinese)
|
|
|
| [29] |
McCallum I, Obersteiner M, Nilsson S, et al. 2006. A spatial comparison of four satellite derived 1 km Global Land Cover Datasets. International Journal of Applied Earth Observation and Geoinformation, 8(4): 246-255.
doi: 10.1016/j.jag.2005.12.002
|
|
|
| [30] |
Miao L J, Moore J C, Zeng F J, et al. 2015. Footprint of research in desertification management in China. Land Degradation and Development, 26(5): 450-457.
doi: 10.1002/ldr.2399
|
|
|
| [31] |
Stauch G. 2015. Geomorphological and palaeoclimate dynamics recorded by the formation of aeolian archives on the Tibetan Plateau. Earth-Science Reviews, 150: 393-408.
doi: 10.1016/j.earscirev.2015.08.009
|
|
|
| [32] |
Sun J, Hou G, Liu M, et al. 2019. Effects of climatic and grazing changes on desertification of alpine grasslands, Northern Tibet. Ecological Indicators, 107: 105647, doi: 10.1016/j.ecolind.2019.105647.
doi: 10.1016/j.ecolind.2019.105647
|
|
|
| [33] |
UNCCD, UNDP. 2012. Climate Change in the African Drylands: Options and Opportunities for Adaptation and Mitigation. [2022-02-25]. https://franklin.library.upenn.edu/catalog/FRANKLIN_9948525673503681.
|
|
|
| [34] |
Wang C, Li H, Yang J S, et al. 2015. Study on generation technique of high quality contour lines based on grid DEM. Journal of Geo-information Science, 17(2): 160-165. (in Chinese)
|
|
|
| [35] |
Wang J H, Li S H. 1996. Classification of desertification types and its quantification evaluation system. Arid Environmental Monitoring, 10(3): 129-137, 190. (in Chinese)
|
|
|
| [36] |
Wang R, Yan H, Wang Z. 2021. Hotspots and trends visual analysis of contour automated generalization. Science of Surveying and Mapping, 46(10): 167-176, 193. (in Chinese)
|
|
|
| [37] |
Xie S, Qu J, Zu R, et al. 2013. Effect of sandy sediments produced by the mechanical control of sand deposition on the thermal regime of underlying permafrost along the Qinghai-Tibetan Railway. Land Degradation and Development, 24: 453-462.
|
|
|
| [38] |
Xu Y, Xu C H, Gao X J, et al. 2009. Projected changes in temperature and precipitation extremes over the Yangtze River Basin of China in the 21st century. Quaternary International, 208(1-2): 44-52.
doi: 10.1016/j.quaint.2008.12.020
|
|
|
| [39] |
Yan C Z, Song X, Zhou Y M, et al. 2009. Assessment of aeolian desertification trends from 1975's to 2005's in the watershed of the Longyangxia Reservoir in the upper reaches of China's Yellow River. Geomorphology, 112(3-4): 205-211.
doi: 10.1016/j.geomorph.2009.06.003
|
|
|
| [40] |
Yang M X, Wang X J, Pang G J, et al. 2019. The Tibetan Plateau cryosphere: Observations and model simulations for current status and recent changes. Earth-Science Reviews, 190: 353-369.
doi: 10.1016/j.earscirev.2018.12.018
|
|
|
| [41] |
Yao T D, Xue Y K, Chen D L. 2019. Recent Third Pole's rapid warming accompanies cryospheric melt and water cycle intensification and interactions between monsoon and environment: multi-disciplinary approach with observation, modeling and analysis. Bulletin of the American Meteorological Society, 100(3): 423-444.
doi: 10.1175/BAMS-D-17-0057.1
|
|
|
| [42] |
Zhang C L, Li Q, Shen Y P, et al. 2018. Monitoring of aeolian desertification on the Qinghai-Tibetan Plateau from the 1970s to 2015 using Landsat images. Science of the Total Environment, 619: 1648-1659.
|
|
|
| [43] |
Zhang K C, Qu J J, Han Q J, et al. 2012. Wind energy environments and aeolian sand characteristics along the Qinghai-Tibetan Railway, China. Sedimentary Geology, 273-274: 91-96.
doi: 10.1016/j.sedgeo.2012.07.003
|
|
|
| [44] |
Zhang Z W, Yin H Y, Qian D F, et al. 2019. A preliminary study on the classification system of desert in alpine region-taking Duilongdeqing District as an example. Journal of Plateau Agriculture, 3(1): 47-53. (in Chinese)
|
|
|
| [45] |
Zhao Y Y, Gao G L, Qin S G, et al. 2019. Desertification detection and the evaluation indicators: A review. Journal of Arid Land Resources and Environment, 33(5): 81-87. (in Chinese)
|
|
|
| [46] |
Zu R P, He Z L, Zong Y M, et al. 2014. Review on the influences of sand accumulation on permafrost in the Tibetan Plateau. Journal of Desert Research, 34(5): 1208-1214. (in Chinese)
|
|
|
|
Viewed |
|
|
|
Full text
|
|
|
|
|
Abstract
|
|
|
|
|
Cited |
|
|
|
|
| |
Shared |
|
|
|
|
| |
Discussed |
|
|
|
|