| Research article |
|


|
|
|
| Study of the intensity and driving factors of land use/cover change in the Yarlung Zangbo River, Nyang Qu River, and Lhasa River region, Qinghai-Tibet Plateau of China |
LUO Jing1,2, XIN Liangjie3,*( ), LIU Fenggui1,2,*(), CHEN Qiong1, ZHOU Qiang1, ZHANG Yili3,4 ), LIU Fenggui1,2,*(), CHEN Qiong1, ZHOU Qiang1, ZHANG Yili3,4 |
1College of Geographic Sciences, Qinghai Normal University, Xining 810008, China
2Academy of Plateau Science and Sustainability, Xining 810008, China
3Key Laboratory of Land Surface Pattern and Simulation, Institute of Geographic Sciences and Natural Resources Research, Chinese Academy of Sciences, Beijing 100101, China
4Center for Excellence in Tibetan Plateau Earth Sciences, Chinese Academy of Sciences, Beijing 100101, China |
|
|
|
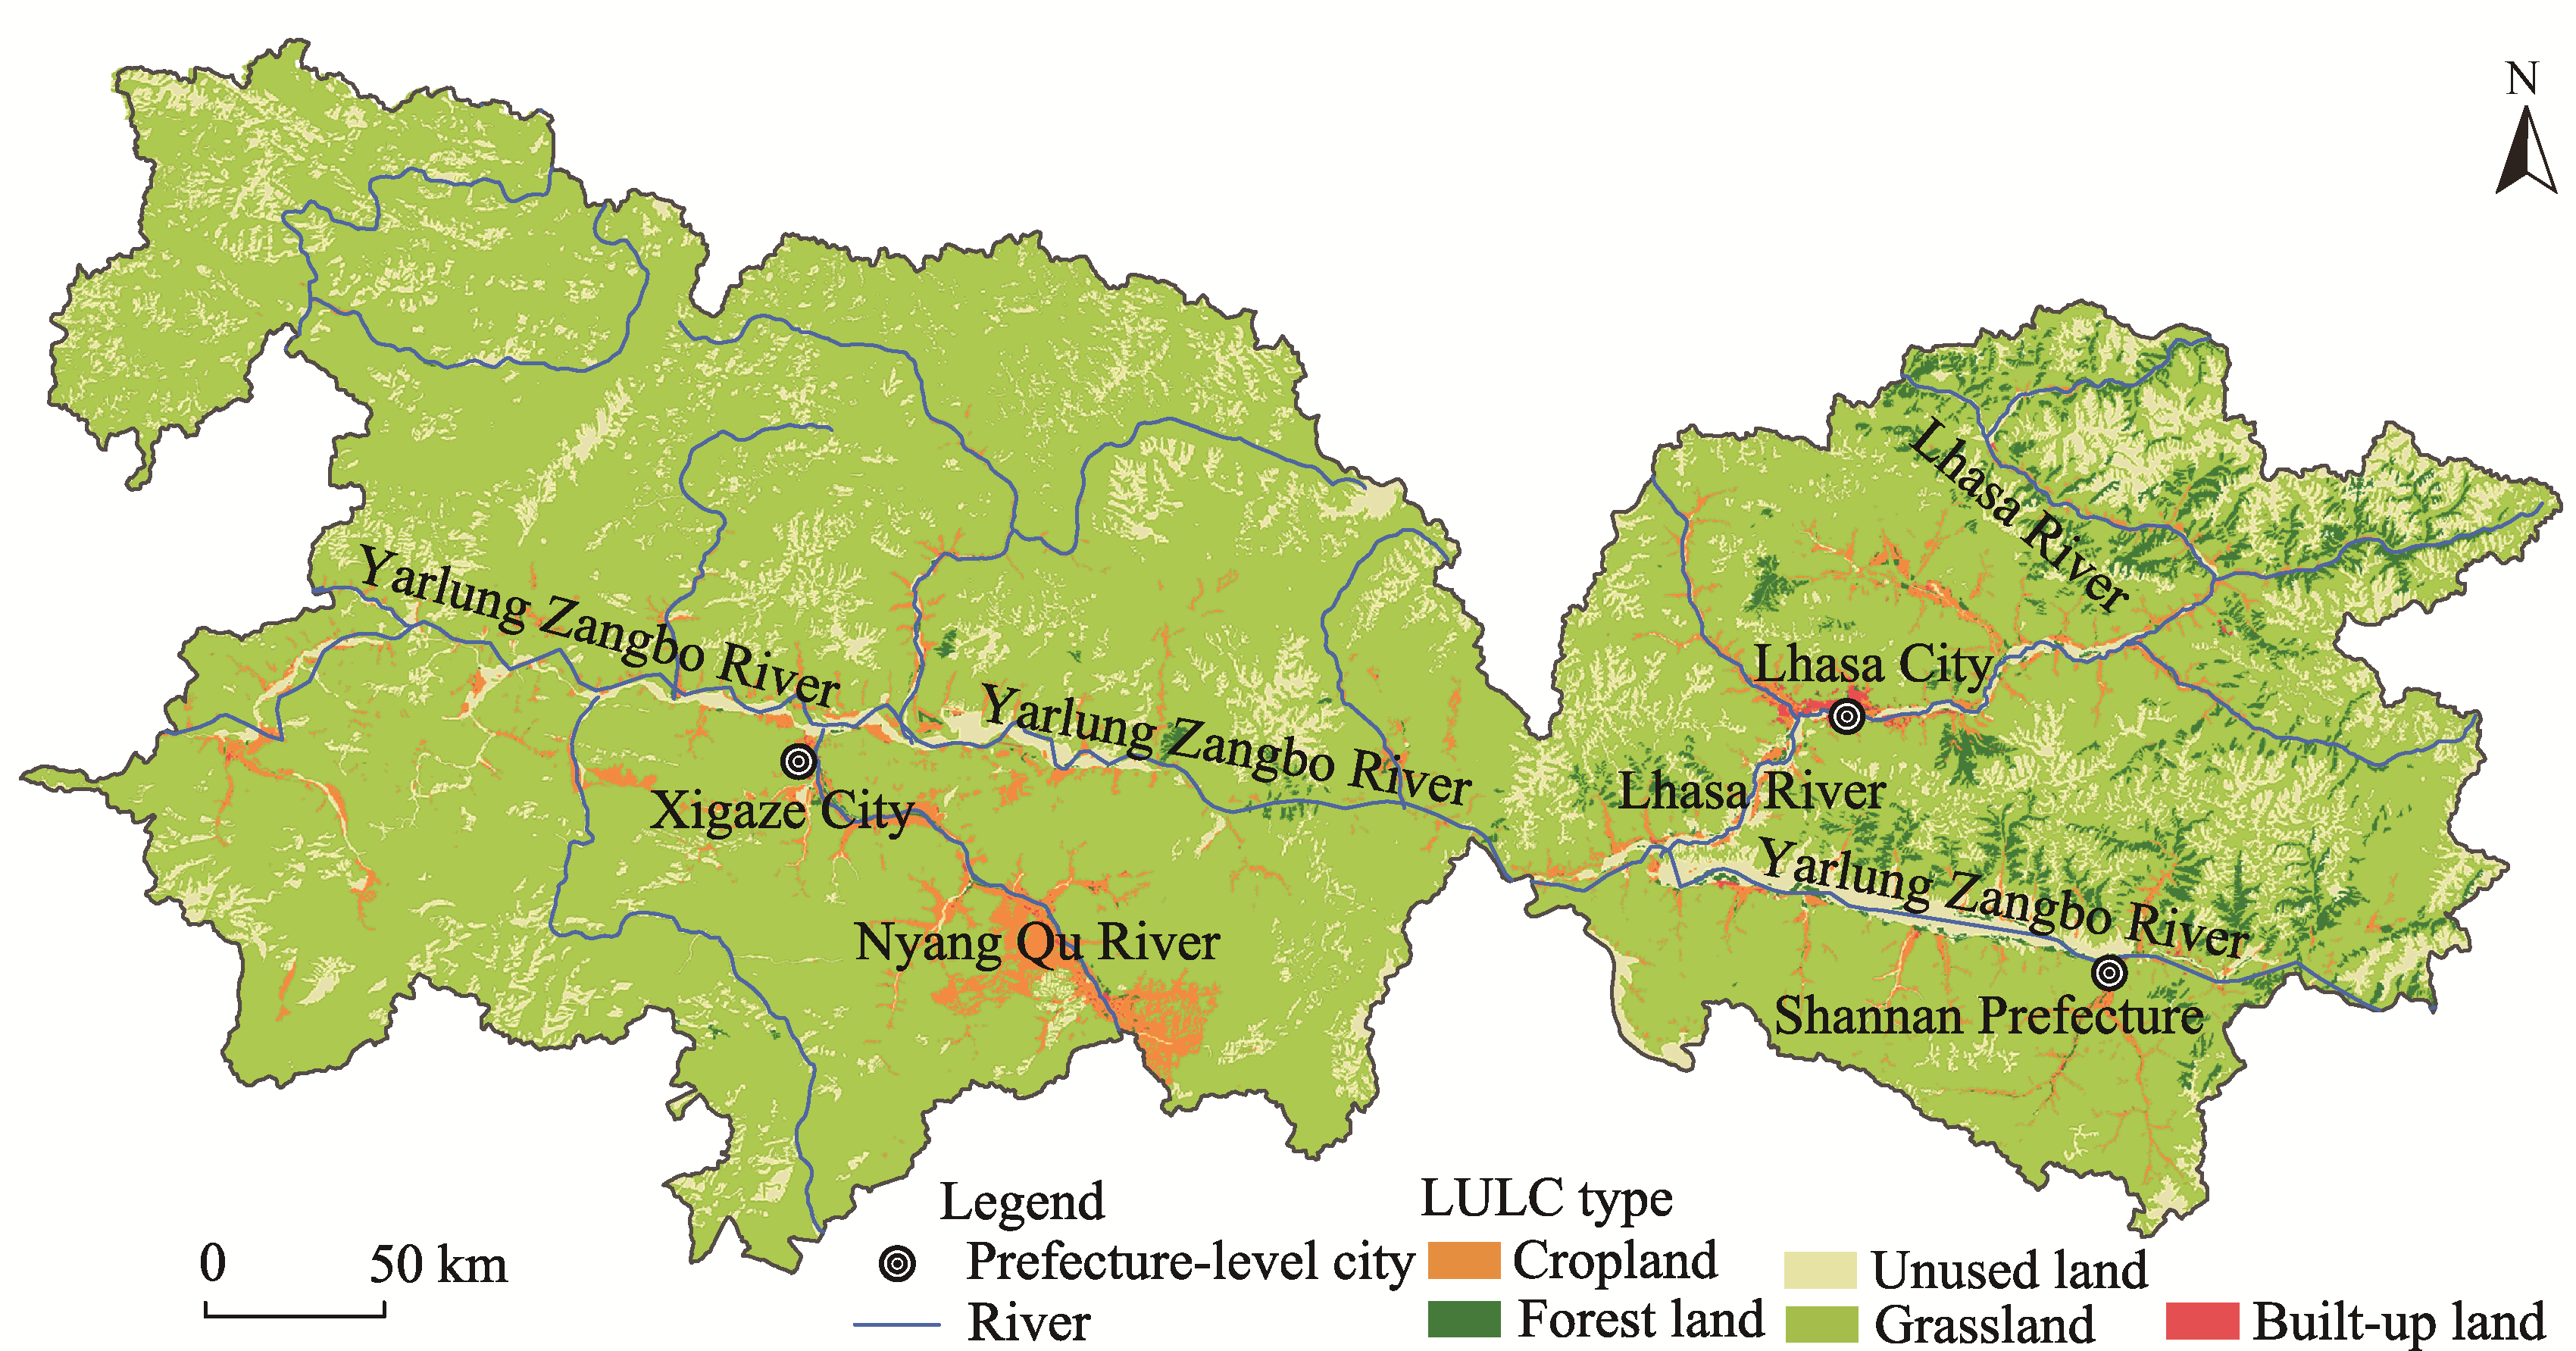
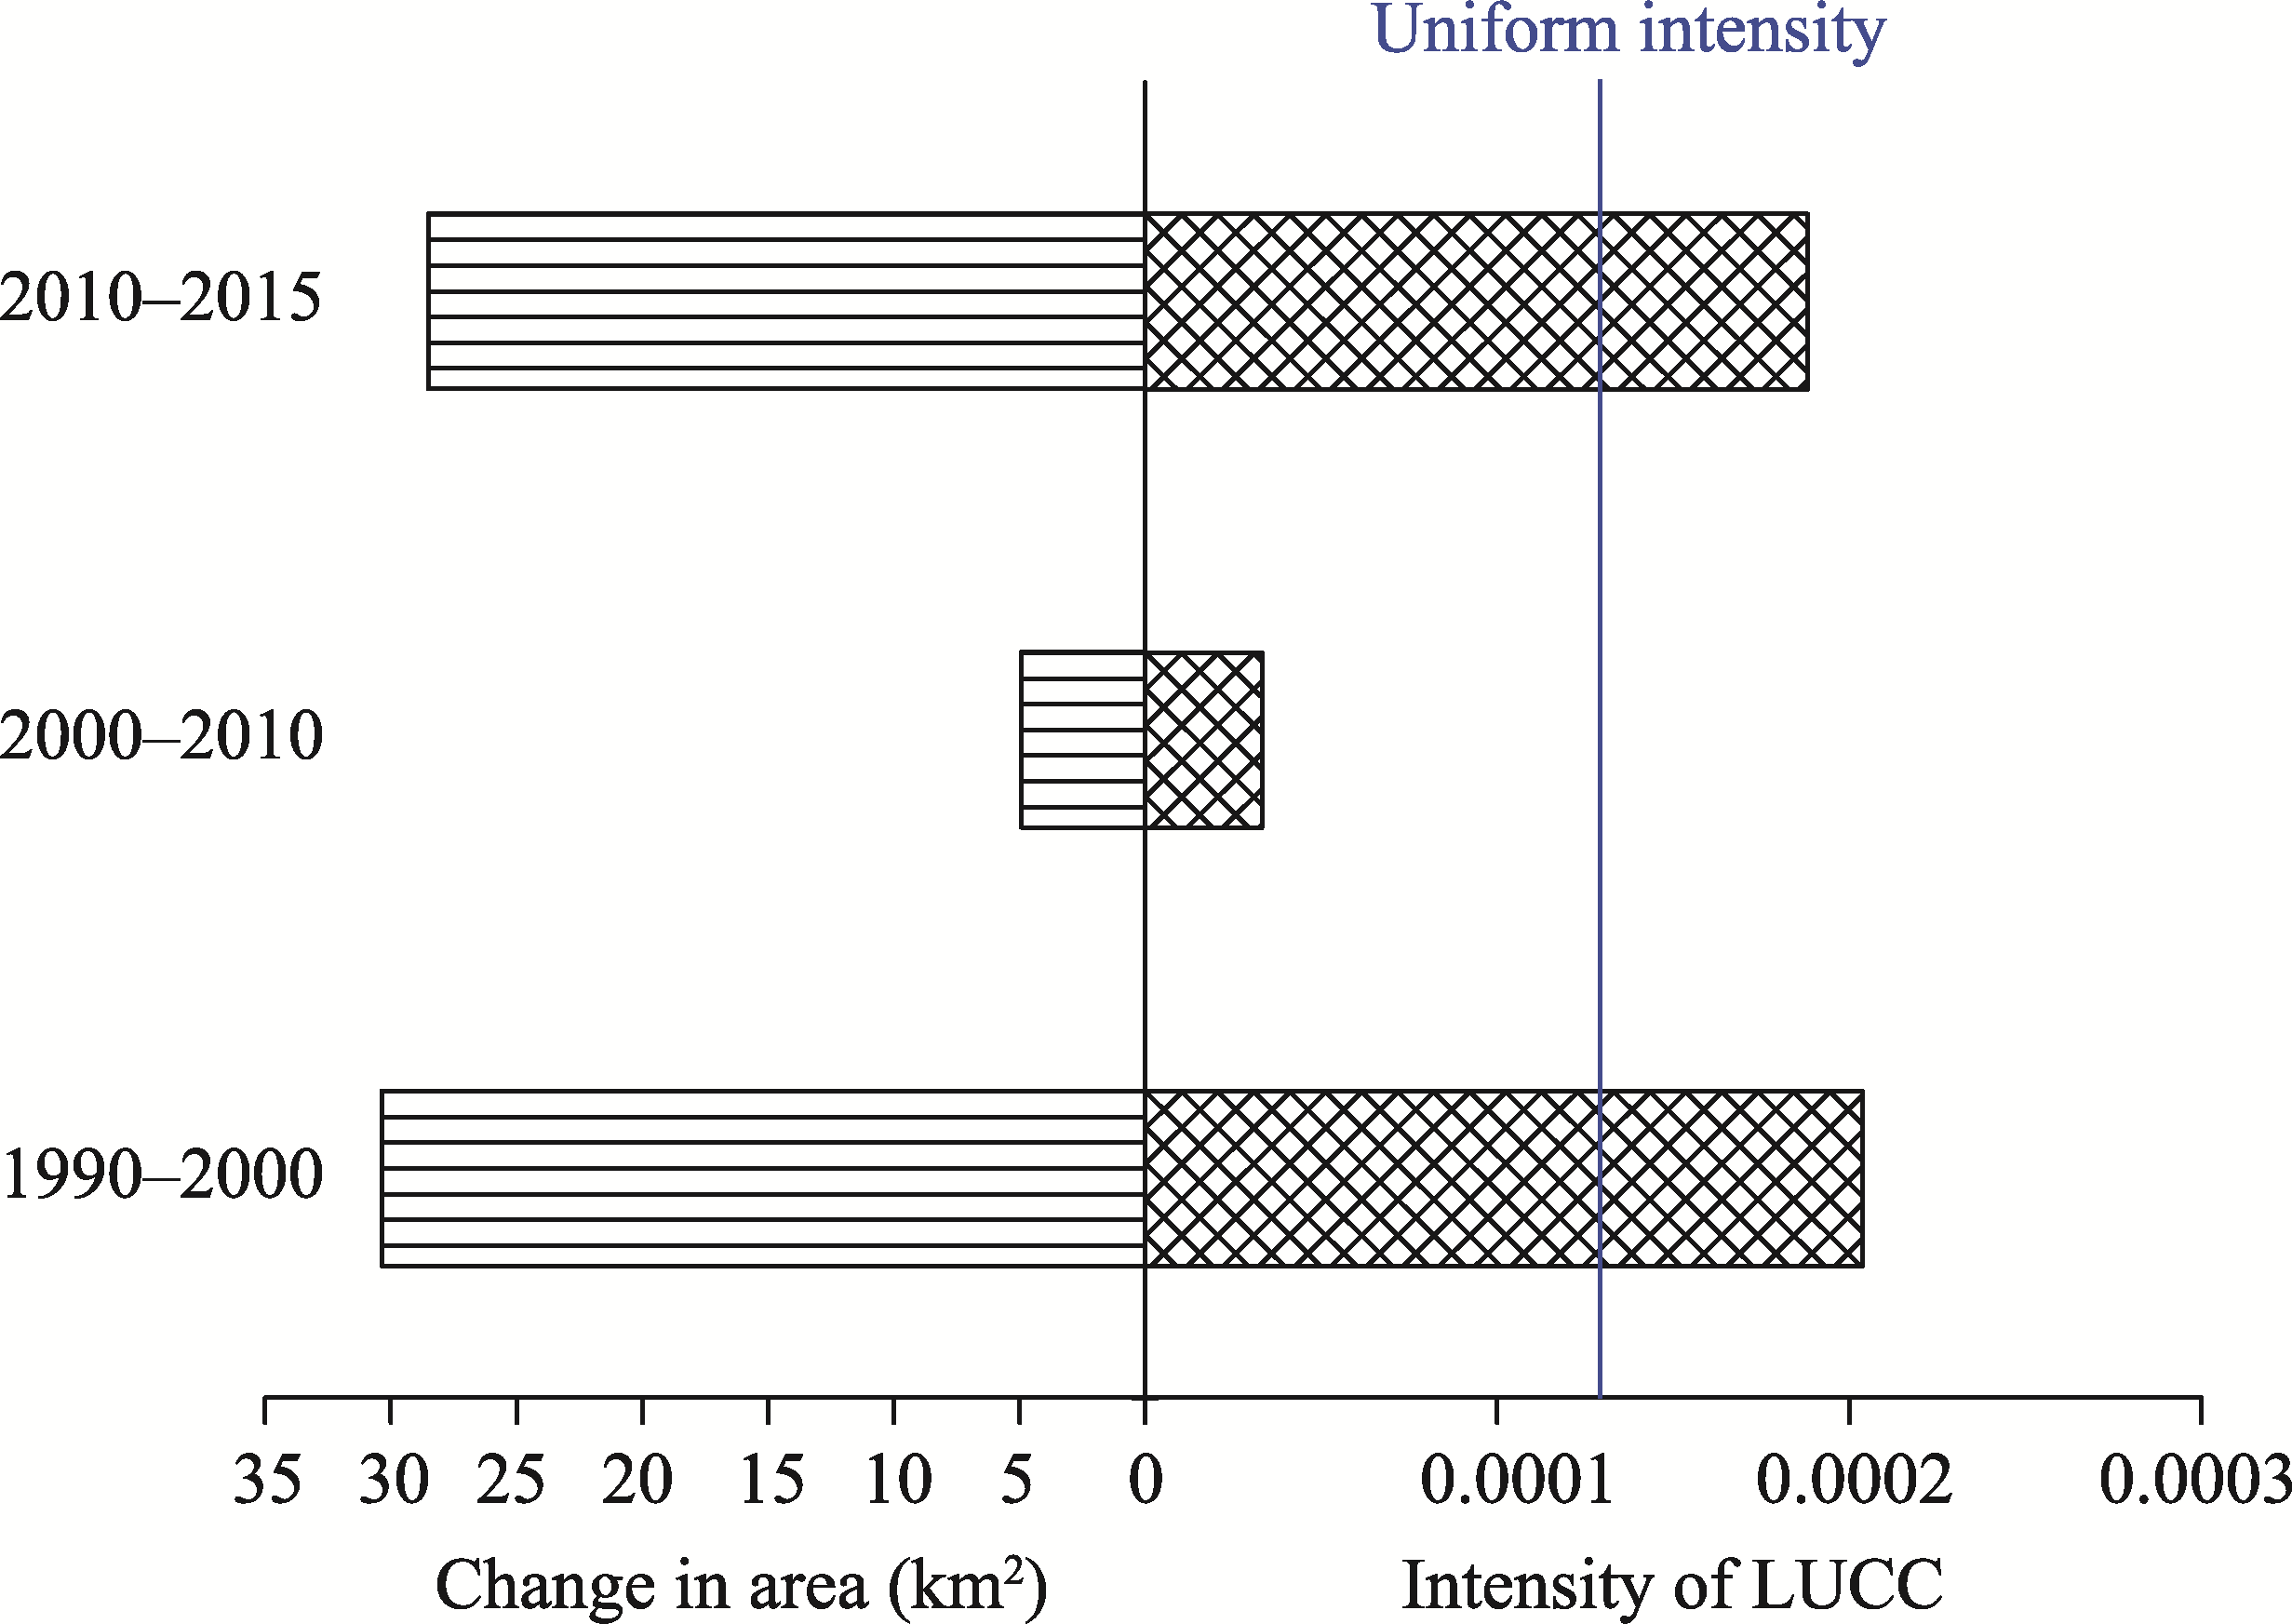
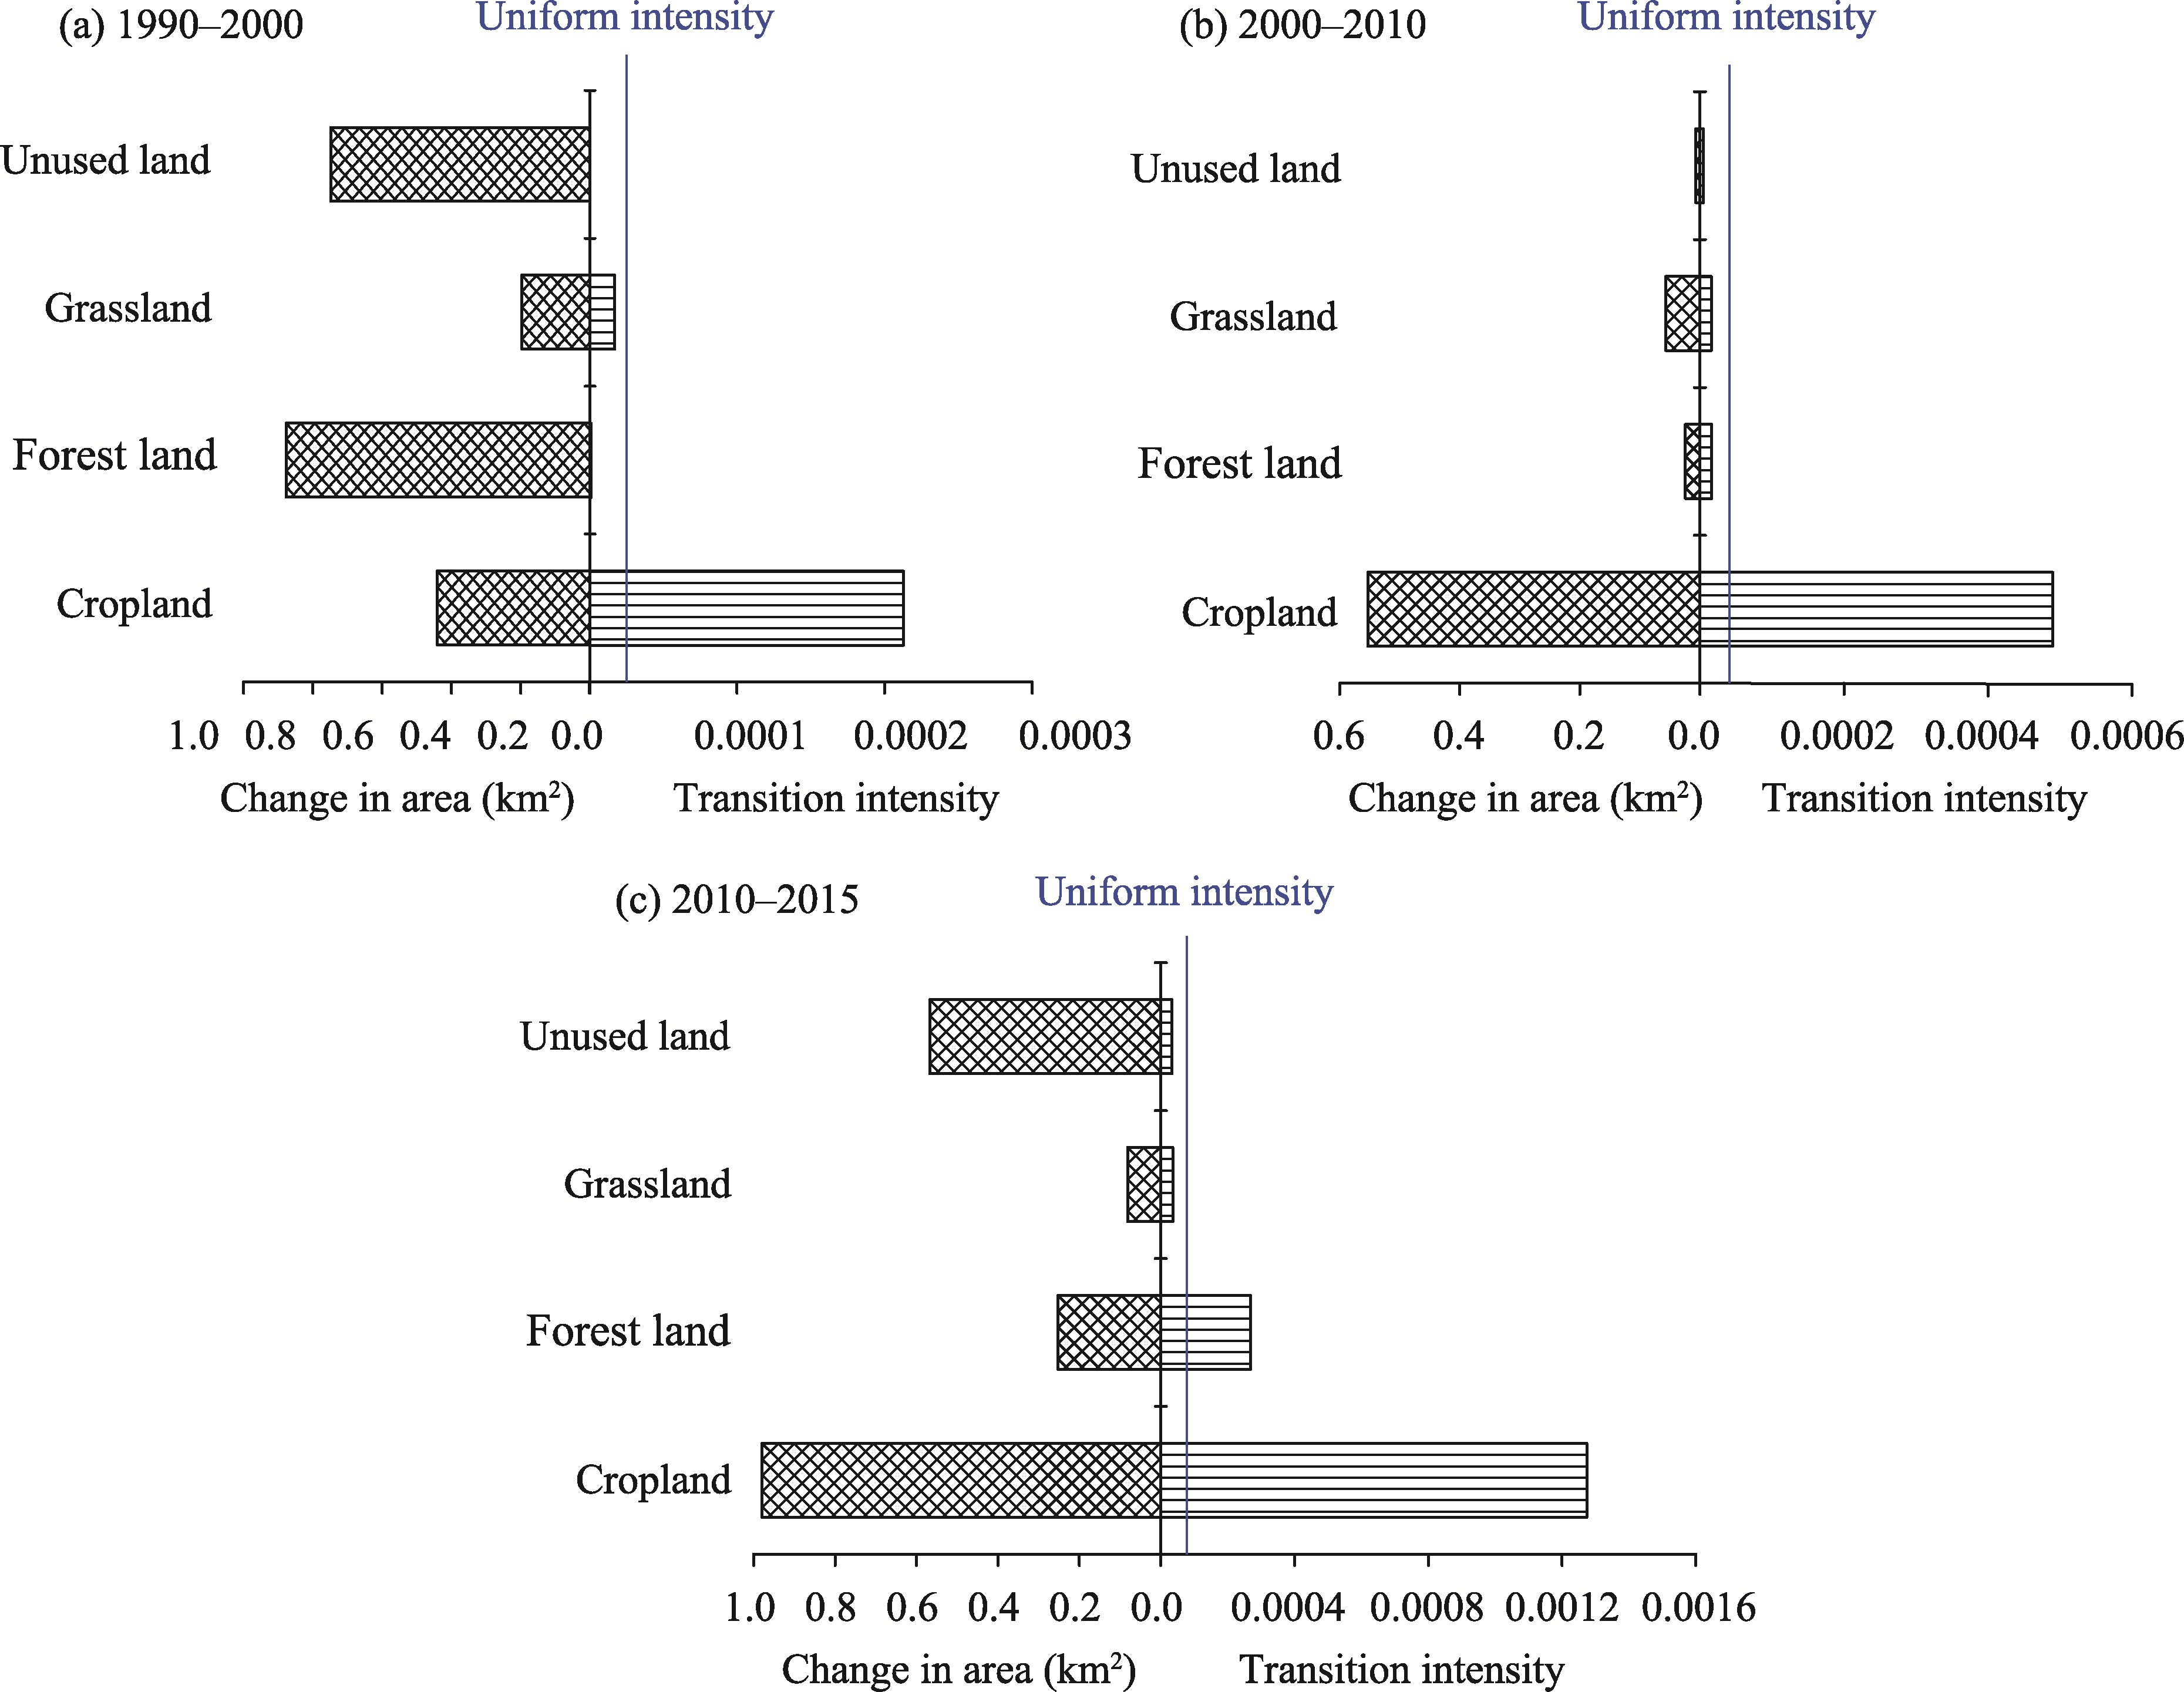
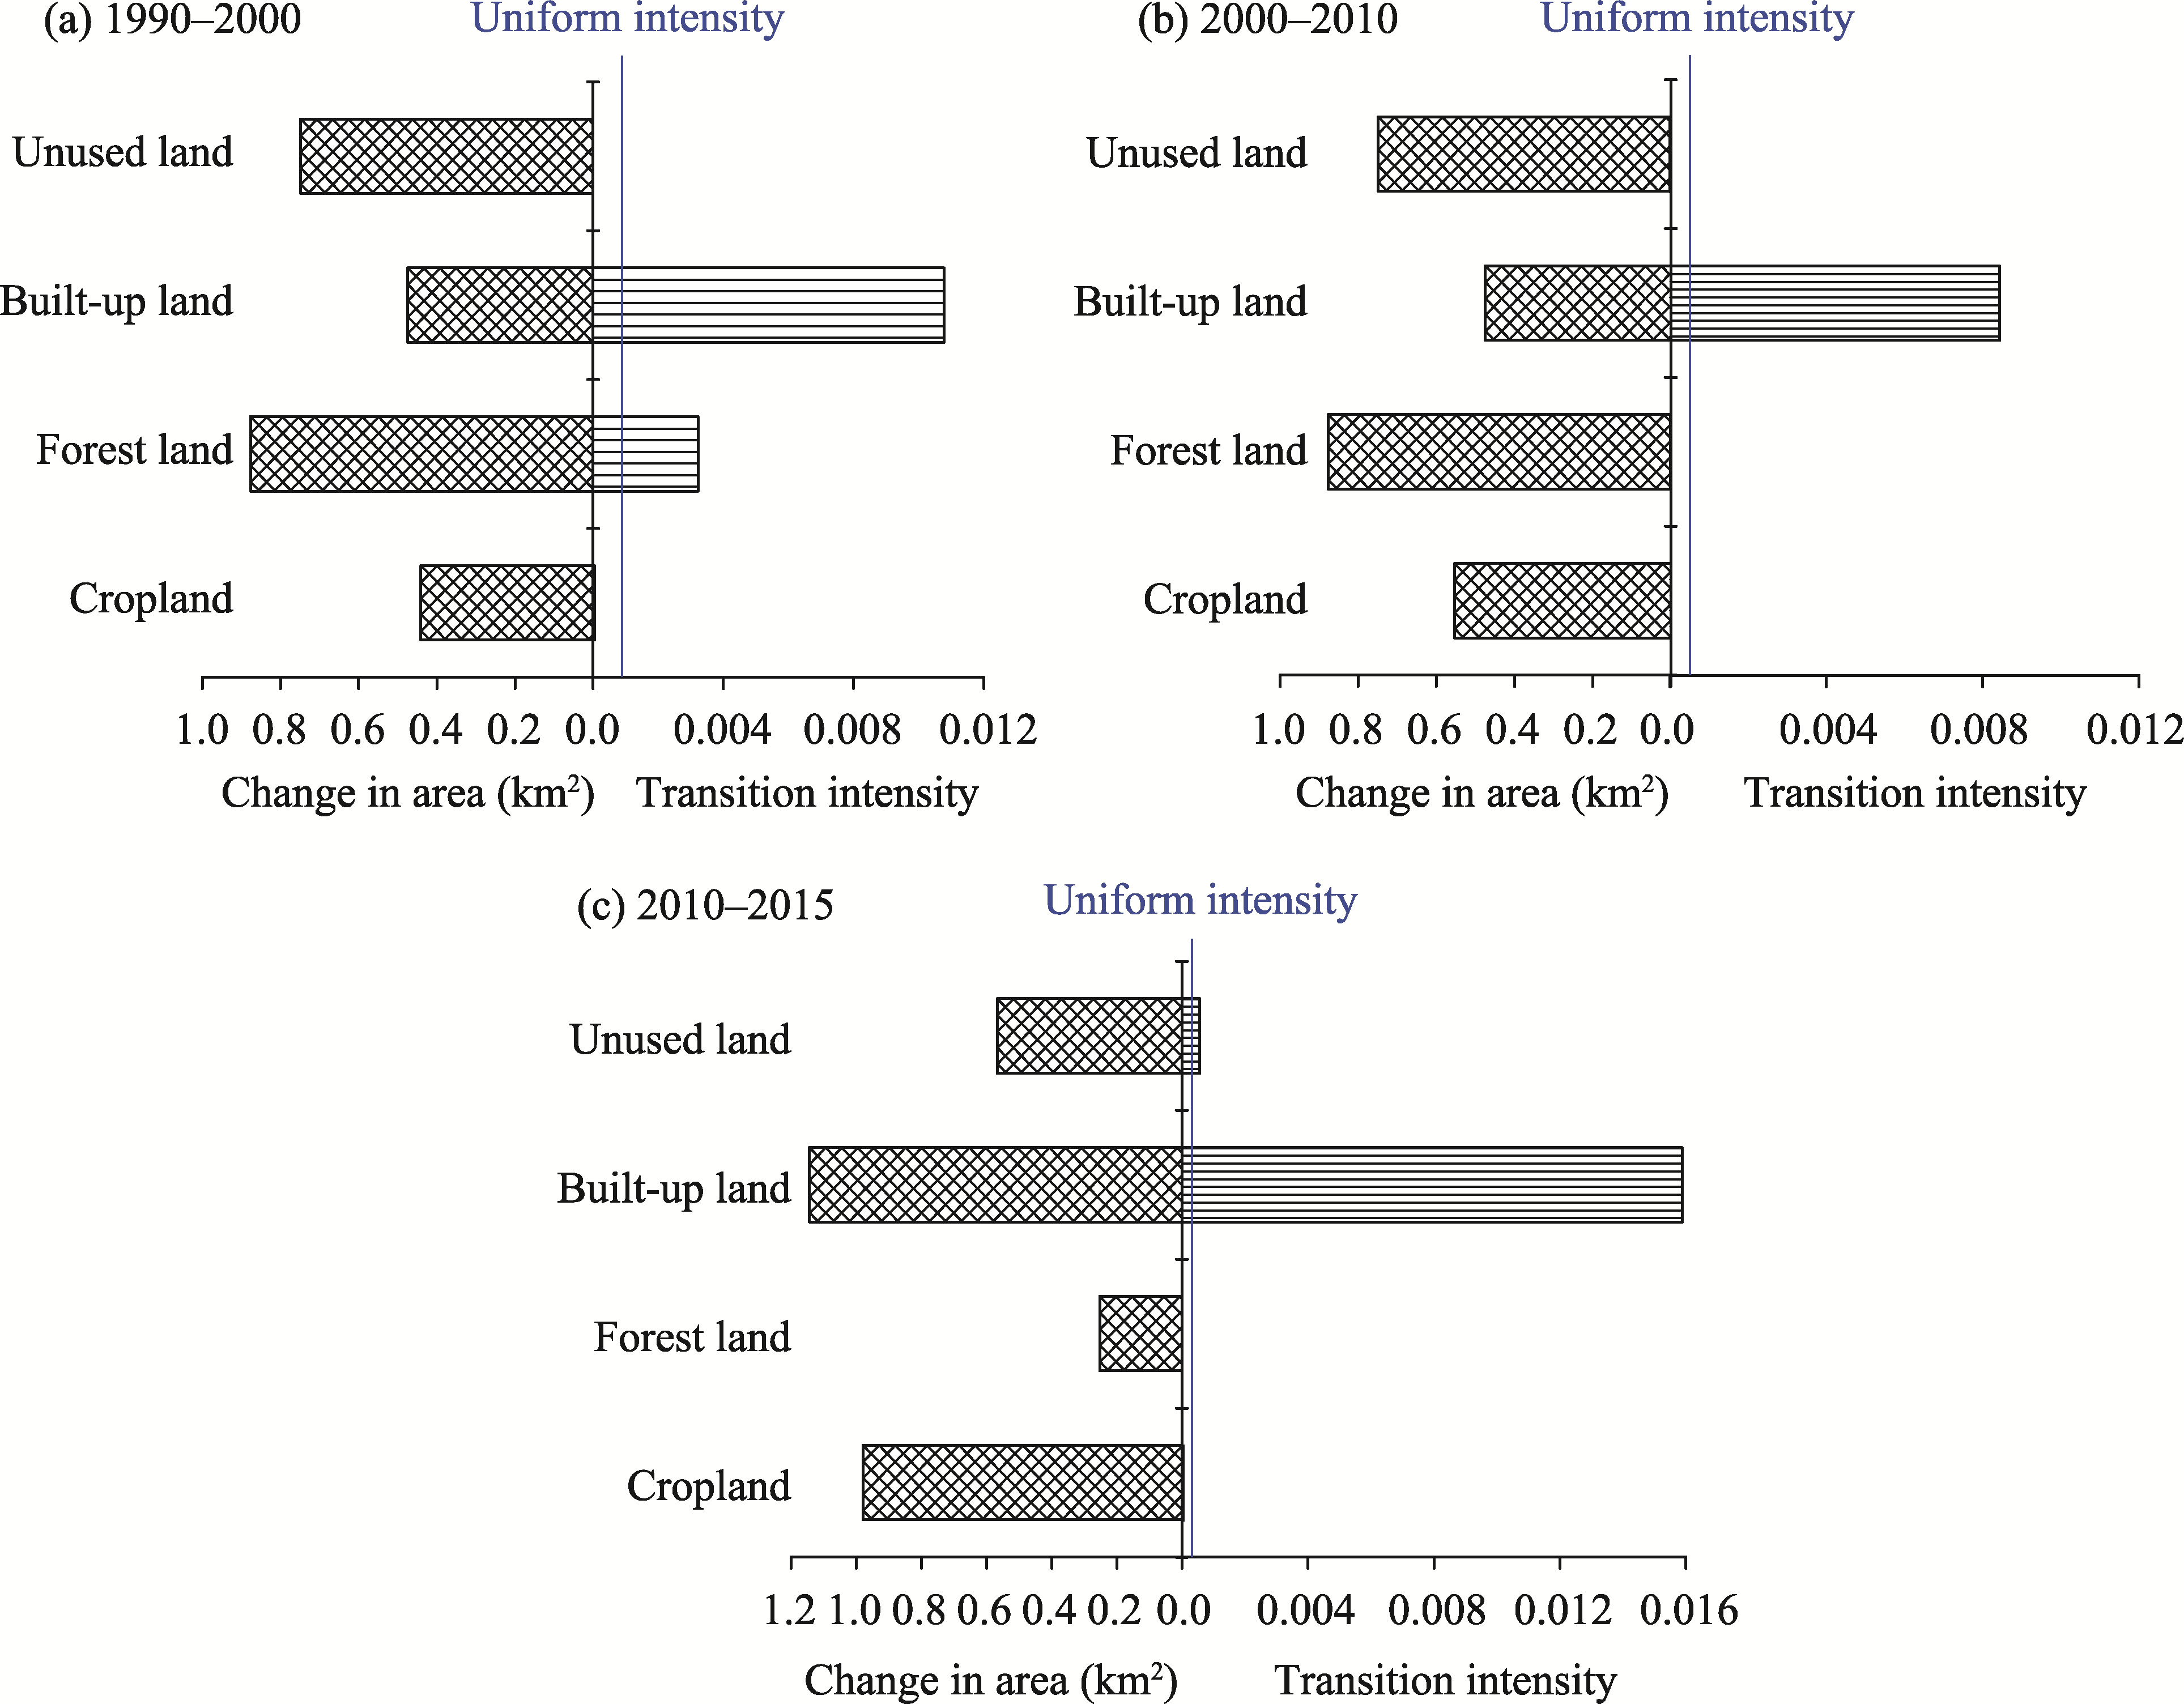
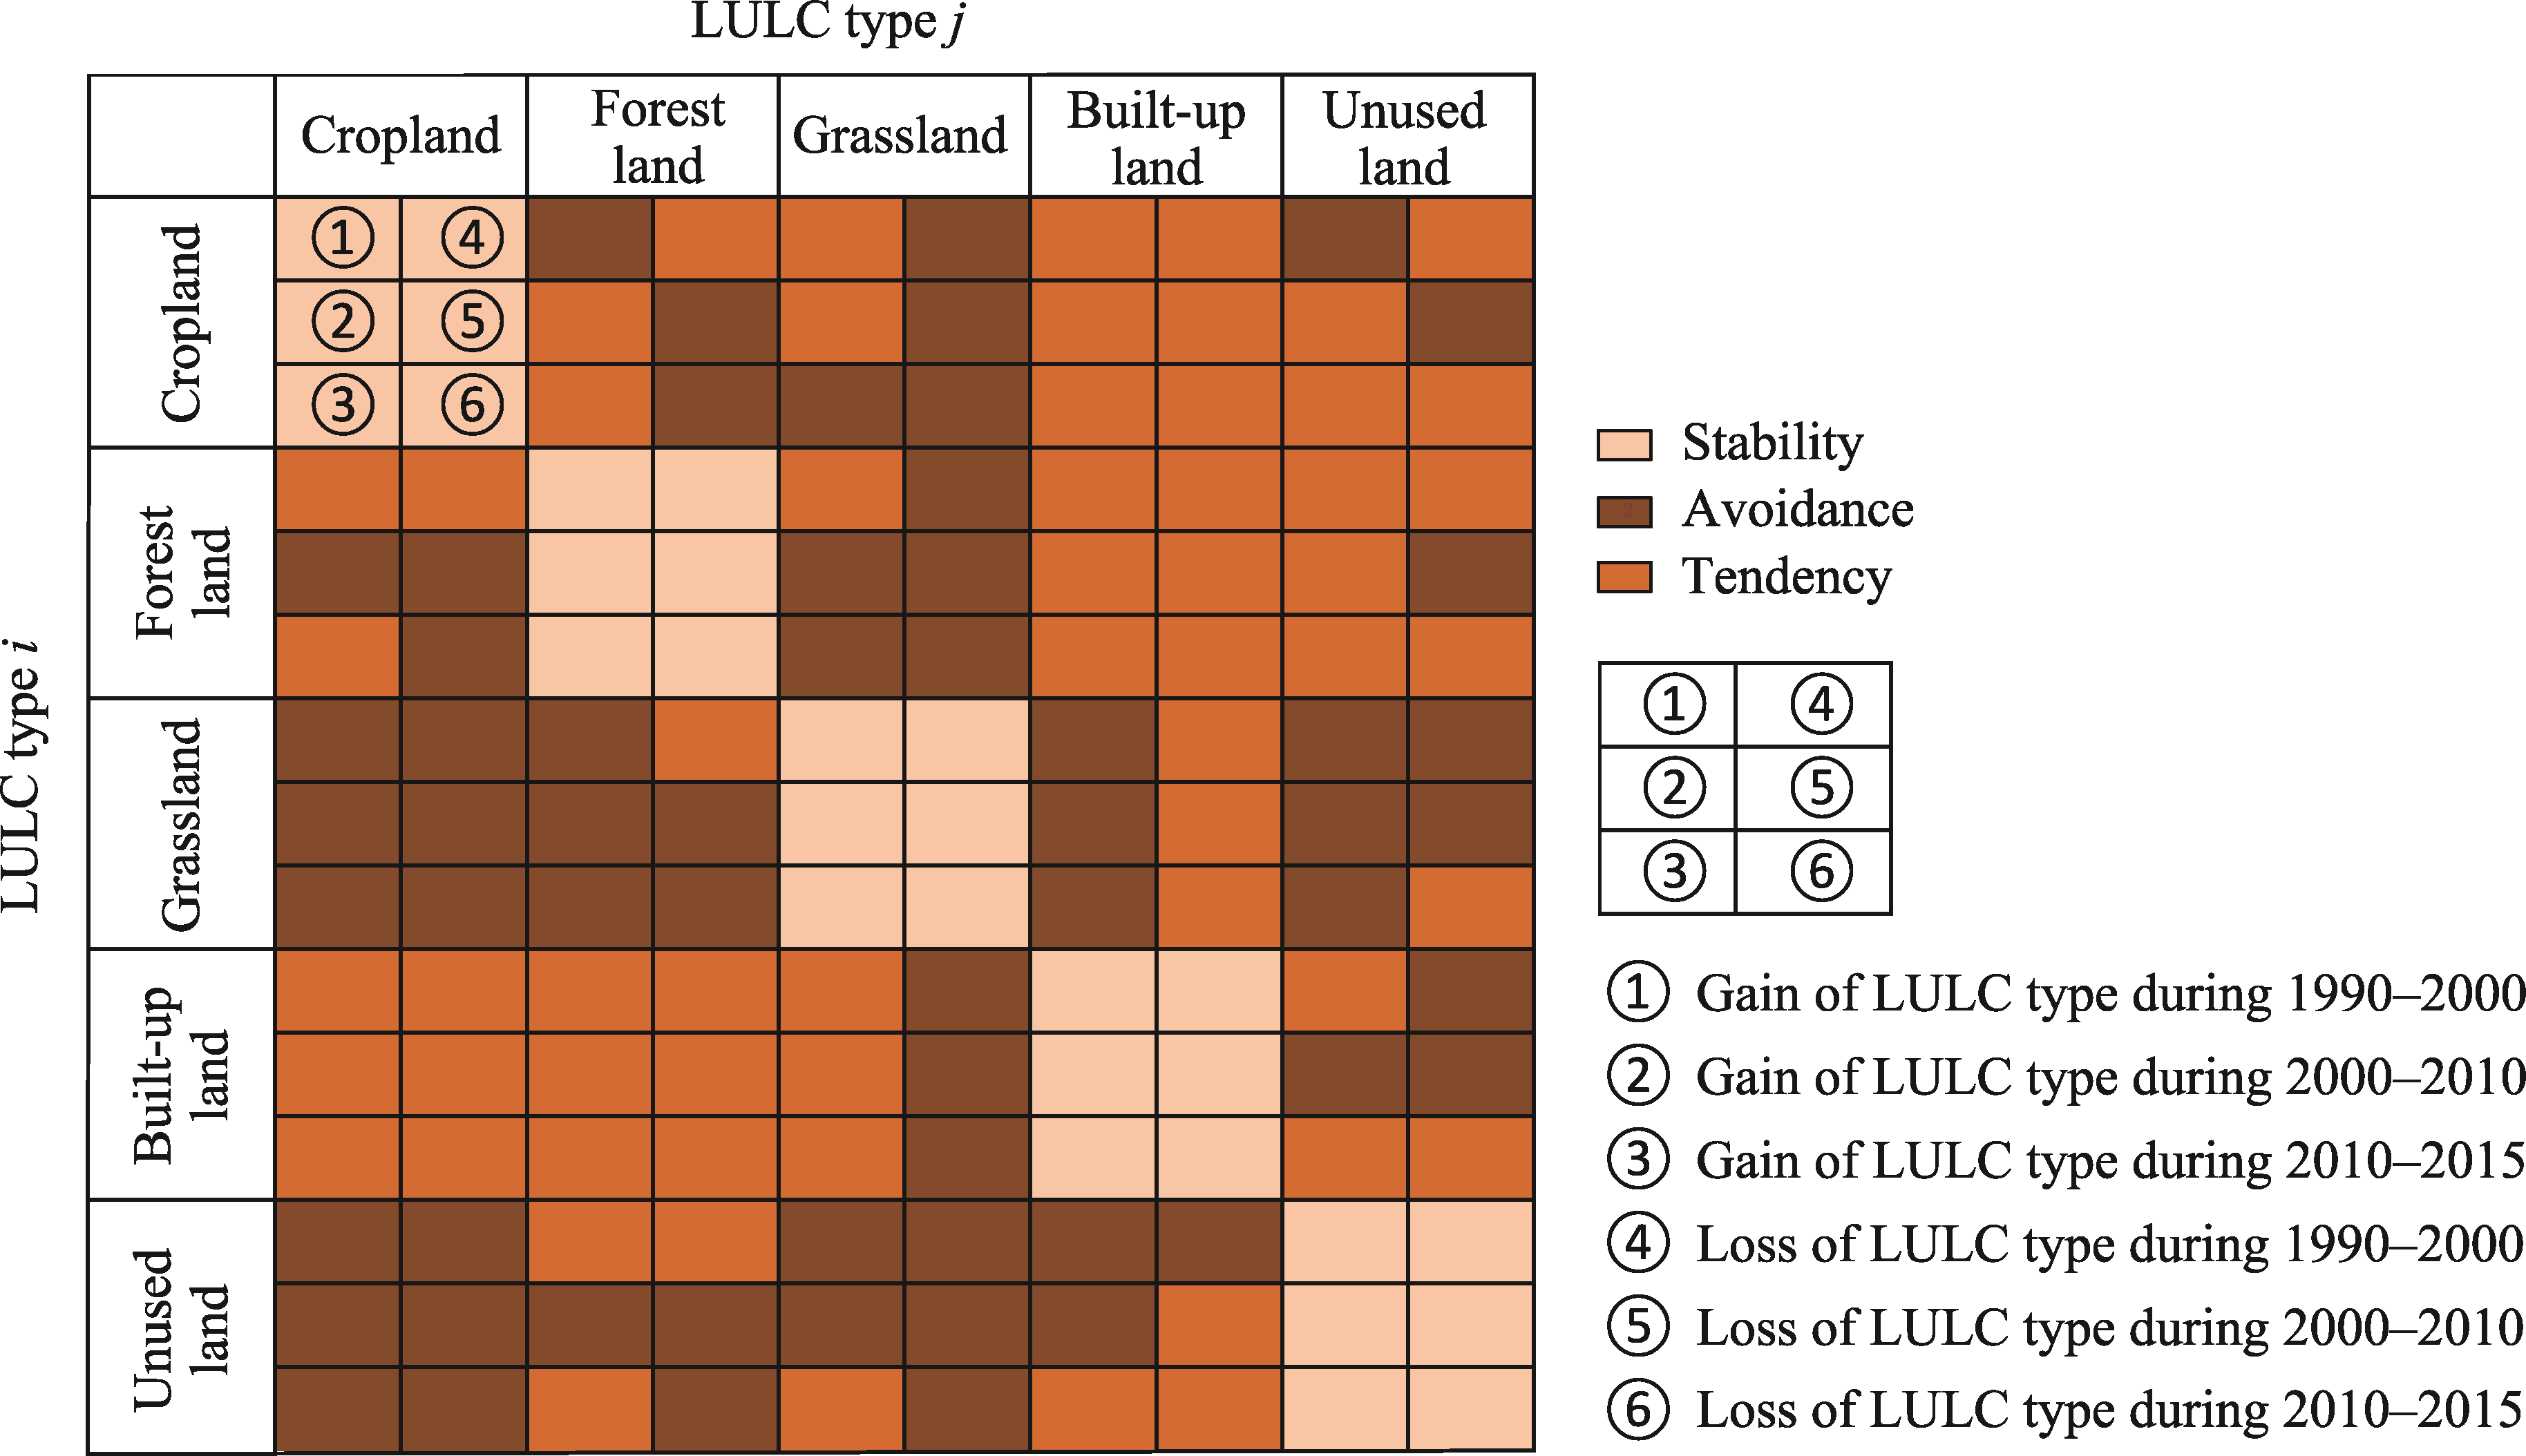
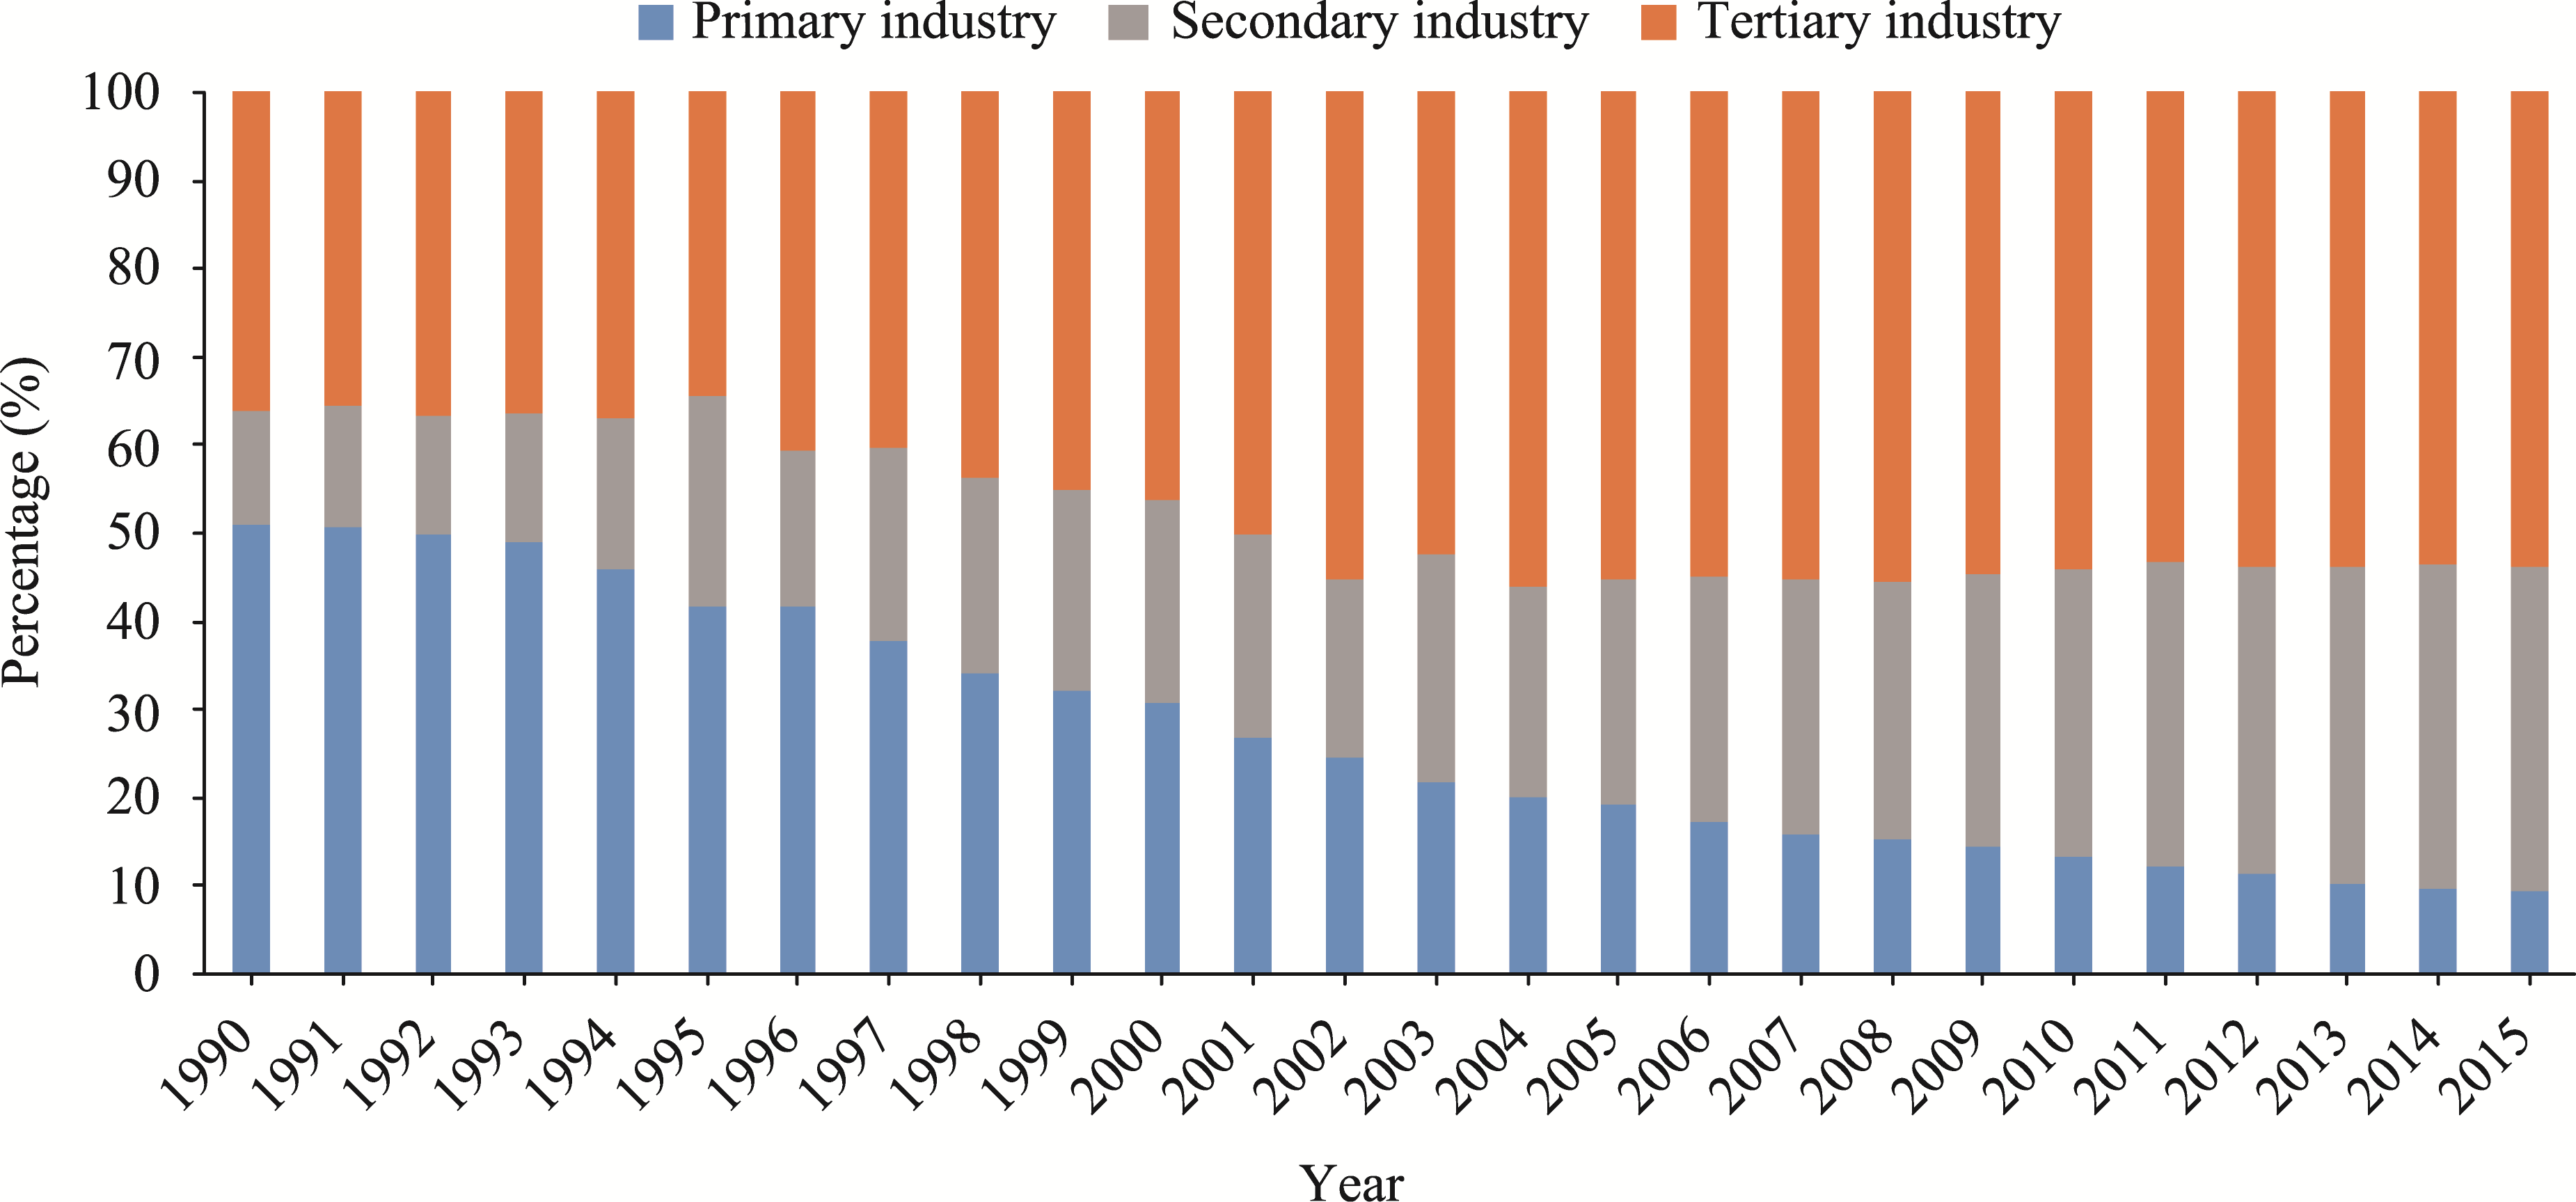
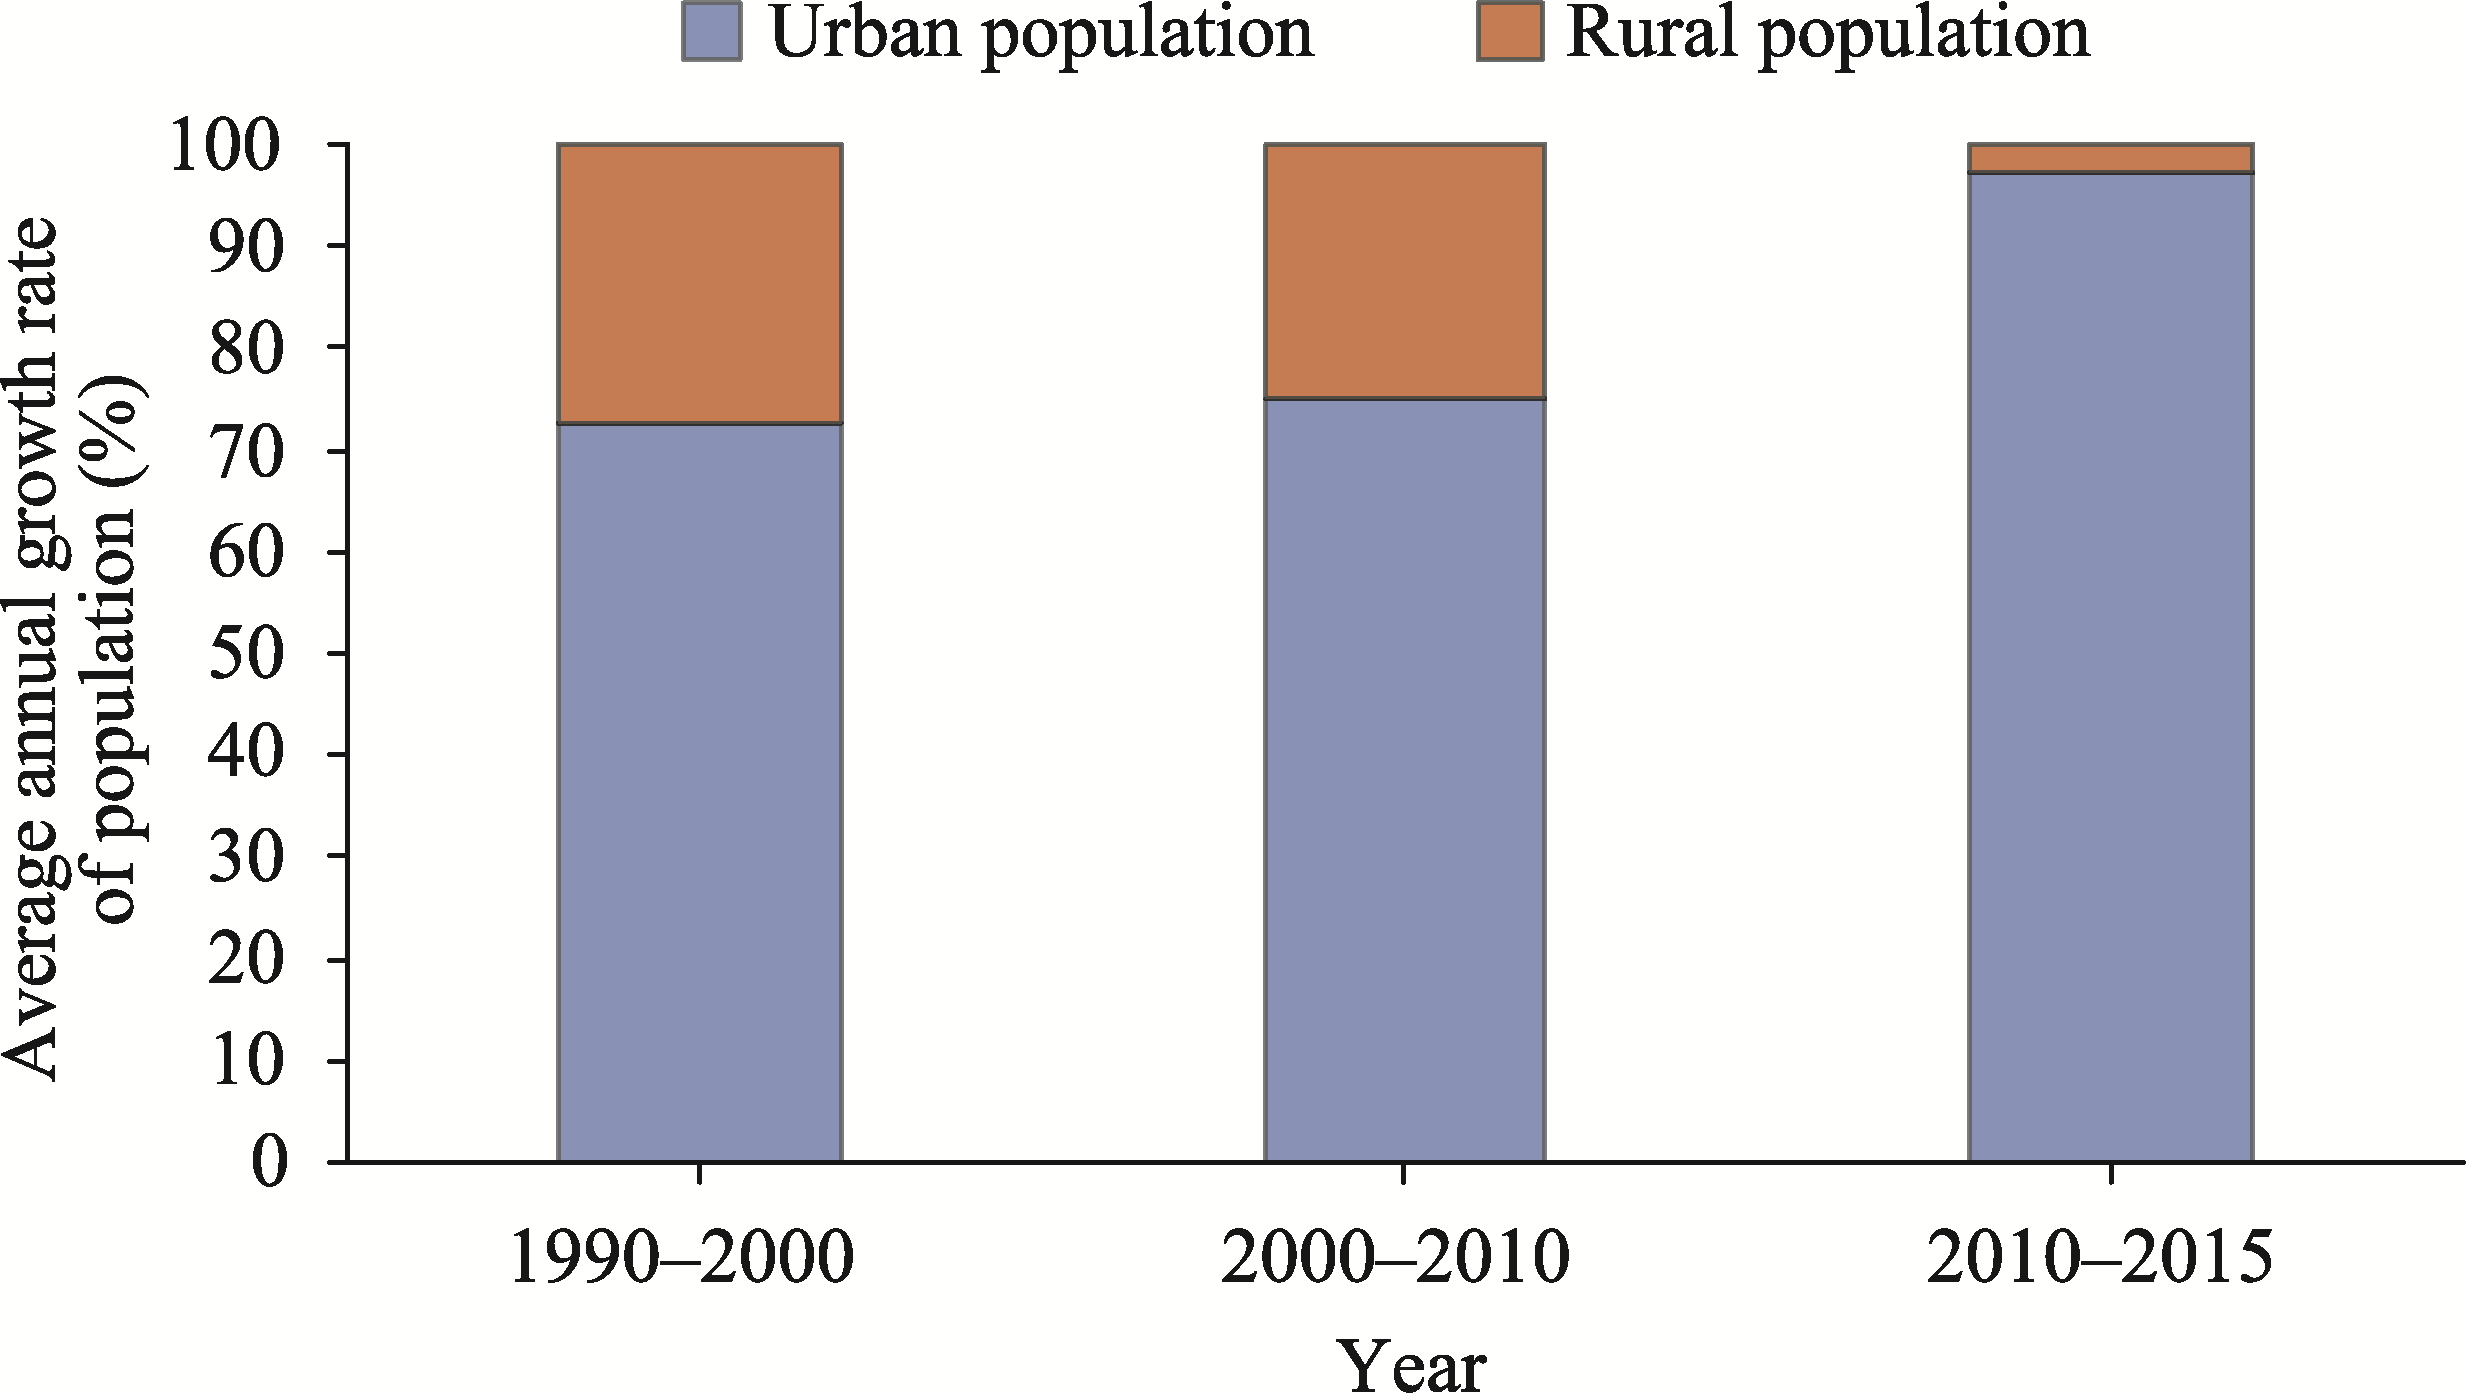
Abstract Land use/land cover (LULC) is an important part of exploring the interaction between natural environment and human activities and achieving regional sustainable development. Based on the data of LULC types (cropland, forest land, grassland, built-up land, and unused land) from 1990 to 2015, we analysed the intensity and driving factors of land use/cover change (LUCC) in the Yarlung Zangbo River, Nyang Qu River, and Lhasa River (YNL) region, Qinghai-Tibet Plateau of China, using intensity analysis method, cross-linking table method, and spatial econometric model. The results showed that LUCC in the YNL region was nonstationary from 1990 to 2015, showing a change pattern with "fast-slow-fast" and "U-shaped". Built-up land showed a steady increase pattern, while cropland showed a steady decrease pattern. The gain of built-up land mainly came from the loss of cropland. The transition pattern of LUCC in the YNL region was relatively single and stable during 1990-2015. The transition pattern from cropland and forest land to built-up land was a systematic change process of tendency and the transition pattern from grassland and unused land to cropland was a systematic change process of avoidance. The transition process of LUCC was the result of the combined effect of natural environment and social economic development in the YNL region. This study reveals the impact of ecological environment problems caused by human activities on the land resource system and provides scientific support for the study of ecological environment change and sustainable development of the Qinghai-Tibet Plateau.
|
|
Received: 30 August 2021
Published: 30 April 2022
|
|
Corresponding Authors:
*XIN Liangjie (E-mail: xinlj@igsnrr.ac.cn);LIU Fenggui (E-mail: lfg_918@163.com)
|
| Cite this article:
LUO Jing, XIN Liangjie, LIU Fenggui, CHEN Qiong, ZHOU Qiang, ZHANG Yili. Study of the intensity and driving factors of land use/cover change in the Yarlung Zangbo River, Nyang Qu River, and Lhasa River region, Qinghai-Tibet Plateau of China. Journal of Arid Land, 2022, 14(4): 411-425.
URL:
http://jal.xjegi.com/10.1007/s40333-022-0093-x OR http://jal.xjegi.com/Y2022/V14/I4/411
|
|
|
| [1] |
Albert C H, Hervé M, Fader M, et al. 2020. What ecologists should know before using land use/cover change projections for biodiversity and ecosystem service assessments. Regional Environmental Change, 20(3): 106, doi: 10.1007/s10113-020-01675-w.
doi: 10.1007/s10113-020-01675-w
|
|
|
| [2] |
Aldwaik S Z, Pontius R G J. 2012. Intensity analysis to unify measurements of size and stationarity of land changes by interval, category, and transition. Landscape and Urban Planning, 106(1): 103-114.
doi: 10.1016/j.landurbplan.2012.02.010
|
|
|
| [3] |
Andoh J, Lee Y. 2018. Forest transition through reforestation policy integration: A comparative study between Ghana and the Republic of Korea. Forest Policy and Economics, 90: 12-21.
doi: 10.1016/j.forpol.2018.01.009
|
|
|
| [4] |
Anselin L. 1988. Lagrange multiplier test diagnostics for spatial dependence and spatial heterogeneity. Geographical Analysis, 20: 1-17.
doi: 10.1111/j.1538-4632.1988.tb00159.x
|
|
|
| [5] |
Anselin L. 2005. Exploring Spatial Data with GeoDa:A Workbook. New York: Center for Spatially Integrated Social Science.
|
|
|
| [6] |
Aytursun S, Alxir Y, Liu X M, et al. 2020. Carbon intensity of land use in Urumqi city based on spatial-temporal evolution. Chinese Journal of Agricultural Resources and Regional Planning, 41(2): 139-146. (in Chinese)
|
|
|
| [7] |
Burridge P. 1980. On the Cliff-Ord Test for spatial correlation. Journal of the Royal Statistical Society: Series B, 42(1): 107-108.
|
|
|
| [8] |
Chen F, Chen G, Bao H S, et al. 2001. Analysis on land use change and human driving force in urban fringe. Journal of Natural Resources, 16(3): 204-210. (in Chinese)
|
|
|
| [9] |
Chen L G, Yang X Y, Chen L Q, et al. 2015. Impact assessment of land use planning driving forces on environment. Environment Impact Assessment Review, 55(8): 126-135.
doi: 10.1016/j.eiar.2015.08.001
|
|
|
| [10] |
Dong G, He L, Wang Y J, et al. 2020. Study on spatial-temporal pattern of land use change in Yi County, Hebei Province from1990 to 2017. Chinese Journal of Agricultural Resources and Regional Planning, 41(1): 242-249. (in Chinese)
|
|
|
| [11] |
Dong J H, Zhang Z B, Da X J, et al. 2021. Eco-environmental effects of land use transformation and its driving forces from the perspective of "production-living-ecological" spaces: a case study of Gansu Province. Acta Ecologica Sinica, 41(15): 5919-5928. (in Chinese)
|
|
|
| [12] |
Fan J, Xu Y D, Shao Y. 2003. The human geography view of land use study and new proposition. Progress in Geography, 22(1): 1-10. (in Chinese)
|
|
|
| [13] |
Fan J, Xu Y, Wang C S, et al. 2015. The effects of human activities on the ecological environment of Tibet over the past half century. Scientific Bulletin, 60(32): 3057-3066. (in Chinese)
|
|
|
| [14] |
Gallo J L, Chasco C. 2015. Spatial econometrics principles and challenges in Jean Paelinck's research. Spatial Economic Analysis, 10(3): 263-269.
doi: 10.1080/17421772.2015.1062602
|
|
|
| [15] |
Gao Q, Miao Y, Song J P. 2021. Research progress on the sustainable development of Qinghai-Tibet Plateau. Geographical Research, 40(1): 1-17. (in Chinese)
doi: 10.11821/dlyj020200614
|
|
|
| [16] |
Geng X L, Zhang J J, Wei C L, et al. 2018. Study on the change of land use intensity in mining cities based on multilevel decision take Wuan city of Hebei province as an example. China Mining Magazine, 27(5): 106-112. (in Chinese)
|
|
|
| [17] |
Ghurah M A, Kamarudin M, Wahab N A, et al. 2018. Temporal change detection of land use/land cover using GIS and remote sensing techniques in South Ghor Regions, Al-Karak, Jordan. Journal of Fundamental and Applied Sciences, 10(2): 95-111.
|
|
|
| [18] |
Gitau M, Bailey N. 2012. Multi-layer assessment of land use and related changes for decision support in a coastal zone watershed. Land, 1(1): 5-27.
doi: 10.3390/land1010005
|
|
|
| [19] |
Han J J, Zou Y L. 2019. Spatial differences and scale determination of regional grain reserves. Journal of Natural Resources, 34(3): 464-472. (in Chinese)
doi: 10.31497/zrzyxb.20190302
|
|
|
| [20] |
Li Q Y, Sun Y W, Yuan W L, et al. 2017. Streamflow responses to climate change and LUCC in a semi-arid watershed of Chinese Loess Plateau. Journal of Arid Land, 9(4): 609-621.
doi: 10.1007/s40333-017-0095-2
|
|
|
| [21] |
Li T T, Long H L, Liu Y Q, et al. 2015. Multi-scale analysis of rural housing land transition under China's rapid urbanization: The case of Bohai Rim. Habitat International, 48(4): 227-238.
doi: 10.1016/j.habitatint.2015.04.002
|
|
|
| [22] |
Li Y, Xiao L M, Hu W M, et al. 2021. Spatio-temporal pattern of land use change in Changsha-Zhuzhou-Xiangtan core areas and its driving forces. Economic Geography, 41(7): 173-182. (in Chinese)
|
|
|
| [23] |
Lu X H, Tang Y F, Yi J L, et al. 2019. Study on the Impact of cultivated land use transition on agricultural economic growth based on spatial econometric model. China Land Science, 33(6): 53-61. (in Chinese)
|
|
|
| [24] |
Niu L L, Zhang B C, Jia T Z. 2021. Analysis on intensity and stability of land use change in Haixi Mongolian and Tibetan Autonomous Prefecture of Qinghai Province. Journal of Soil and Water Conservation, 35(2): 152-159. (in Chinese)
|
|
|
| [25] |
Pontius R G J, Yan G, Nicholas M G, et al. 2013. Design and interpretation of intensity analysis illustrated by land change in central Kalimantan, Indonesia. Land, 2(3): 351-369.
doi: 10.3390/land2030351
|
|
|
| [26] |
Rimal B, Sharma R, Kunwar R M, et al. 2019. Effects of land use and land cover change on ecosystem services in the Koshi River Basin, Eastern Nepal. Ecosystem Services, 38: 100963, doi: 10.1016/j.ecoser.2019.100963.
doi: 10.1016/j.ecoser.2019.100963
|
|
|
| [27] |
Romero-Rui M H, Flantua S G A, Tansey K, et al. 2011. Landscape transformations in savannas of northern South America: Land use/cover changes since 1987 in the Llanos Orientales of Colombia. Applied Geography, 32(2): 766-776.
doi: 10.1016/j.apgeog.2011.08.010
|
|
|
| [28] |
Shoyama K, Braimoh A K, et al. 2010. Analyzing about sixty years of land-cover change and associated landscape fragmentation in Shiretoko Peninsula, Northern Japan. Landscape and Urban Planning, 101(1): 22-29.
doi: 10.1016/j.landurbplan.2010.12.016
|
|
|
| [29] |
Sun Y H, Guo T, Cui X M. 2016. Intensity analysis and stationarity of land use change in Kunming City. Progress in Geography, 35(2): 245-254. (in Chinese)
|
|
|
| [30] |
Tang W, Zhong X H, Zhou W. 2011. Study on the evolution of spatial distribution structure of population in "Three Rivers" area in Tibet. China Population, Resources and Environment, 21(3): 159-164. (in Chinese)
|
|
|
| [31] |
Tao J P, Wang Y K, Liu F G, et al. 2016. Identification and determination of its critical values for influencing factors of cultivated land reclamation strength in region of Brahmaputra River and its two tributaries in Tibet. Transactions of the Chinese Society of Agricultural Engineering, 32(15): 239-246. (in Chinese)
|
|
|
| [32] |
Tian J F, Wang B Y, Cheng L S, et al. 2020. The process and mechanism of regional land use transition guided by policy: A case study of Northeast China. Geographical Research, 39(4): 805-821. (in Chinese)
|
|
|
| [33] |
Tibet Autonomous Region Statistical Bureau, National Bureau of Statistics Tibet Investigation Corps. 1990- 2015. Tibet Statistical Yearbook. Beijing: China Statistics Press. (in Chinese)
|
|
|
| [34] |
Tsai Y, Zia A, Koliba C, et al. 2015. An interactive land use transition agent-based model (ILUTABM): Endogenizing human-environment interactions in the Western Missisquoi Watershed. Land Use Policy, 49(7): 161-176.
doi: 10.1016/j.landusepol.2015.07.008
|
|
|
| [35] |
Wang C, Zhang X Y, Ghadimi P, et al. 2019. The impact of regional financial development on economic growth in Beijing-Tianjin-Hebei region: A spatial econometric analysis. Physica A: Statistical Mechanics and its Applications, 521: 635-648.
doi: 10.1016/j.physa.2019.01.103
|
|
|
| [36] |
Wang J, He T, Lin Y F. 2017. Changes in ecological, agricultural, and urban land space in 1984-2012 in China: Land policies and regional social-economical drivers. Habitat International, 71(10): 1-13.
doi: 10.1016/j.habitatint.2017.10.010
|
|
|
| [37] |
Wang N, Yang G, Han X Y, et al. 2020. Land use change and ecosystem service value in Inner Mongolia from 1990 to 2018. Journal of Soil and Water Conservation, 34(5): 244-250. (in Chinese)
|
|
|
| [38] |
Wei H, Xiong L Y, Tang G A, et al. 2021. Spatial-temporal variation of land use and land cover change in the glacial affected area of the Tianshan Mountains. CATENA, 202(6): 105256, doi: 10.1016/j.catena.2021.105256.
doi: 10.1016/j.catena.2021.105256
|
|
|
| [39] |
Wu D, Chen F H, Li K, et al. 2016. Effects of climate change and human activity on lake shrinkage in Gonghe Basin of northeastern Tibetan Plateau during the past 60 years. Journal of Arid Land, 8(4): 479-491.
doi: 10.1007/s40333-016-0125-5
|
|
|
| [40] |
Xiong J H, Yue W Z, Chen Y, et al. 2021. Multi-scenario urban expansion simulation for SDGs: Taking the Central Asian region along the Belt and Road as an example. Journal of Natural Resources, 36(4): 841-853. (in Chinese)
doi: 10.31497/zrzyxb.20210403
|
|
|
| [41] |
Yang J X, Gong J, Gao J, et al. 2019. Stationary and systematic characteristics of land use and land cover change in the national central cities of China using intensity analysis: A case study of Wuhan City. Resources Science, 41(4): 701-716.
|
|
|
| [42] |
Yu Y, Chen X, Malik I, et al. 2021. Spatiotemporal changes in water, land use, and ecosystem services in Central Asia considering climate changes and human activities. Journal of Arid Land, 13(9): 881-890.
doi: 10.1007/s40333-021-0084-3
|
|
|
| [43] |
Zhang B F, Miao C H. 2020. Spatiotemporal changes and driving forces of land use in the Yellow River Basin. Resources Science, 42(3): 460-473. (in Chinese)
|
|
|
| [44] |
Zhang H G. 2016. Study on ecological environment of Tibet "YLN" agricultural watershed problems in the new period. Tibet Journal of Agricultural Sciences, 38(1): 41-45. (in Chinese)
|
|
|
| [45] |
Zhang J, Wu S H, Liu Y H, et al. 2007. Simulation of distribution of agriculture output value influenced by land use and topographical indices in Tibet. Transactions of the Chinese Society of Agricultural Engineering, 23(4): 59-65. (in Chinese)
|
|
|
| [46] |
Zhang Y L, Li L H, Ding M J, et al. 2017. Greening of the Tibetan Plateau and its drivers since 2000. Chinese Journal of Nature, 39(3): 173-178. (in Chinese)
|
|
|
| [47] |
Zhu X Y, Wang Z M, Xu D W, et al. 2020. Analysis of land use change and driving forces in ecological functional area of Hulunber Grassland. Chinese Journal of Agricultural Resources and Regional Planning, 41(4): 74-82. (in Chinese)
|
|
|
|
Viewed |
|
|
|
Full text
|
|
|
|
|
Abstract
|
|
|
|
|
Cited |
|
|
|
|
| |
Shared |
|
|
|
|
| |
Discussed |
|
|
|
|