| Research article |
|


|
|
|
| Fate of rubber bush (Calotropis procera (Aiton) W. T. Aiton) in adversary environment modulated by microstructural and functional attributes |
Ummar IQBAL1,*( ), Mansoor HAMEED2, Farooq AHMAD2, Muhammad S AAHMAD2, Muhammad ASHRAF2 ), Mansoor HAMEED2, Farooq AHMAD2, Muhammad S AAHMAD2, Muhammad ASHRAF2 |
1Department of Botany, the Islamia University of Bahawalpur, Bahawalpurwala 64200, Pakistan
2Department of Botany, University of Agriculture, Faisalabad 38040, Pakistan |
|
|
|
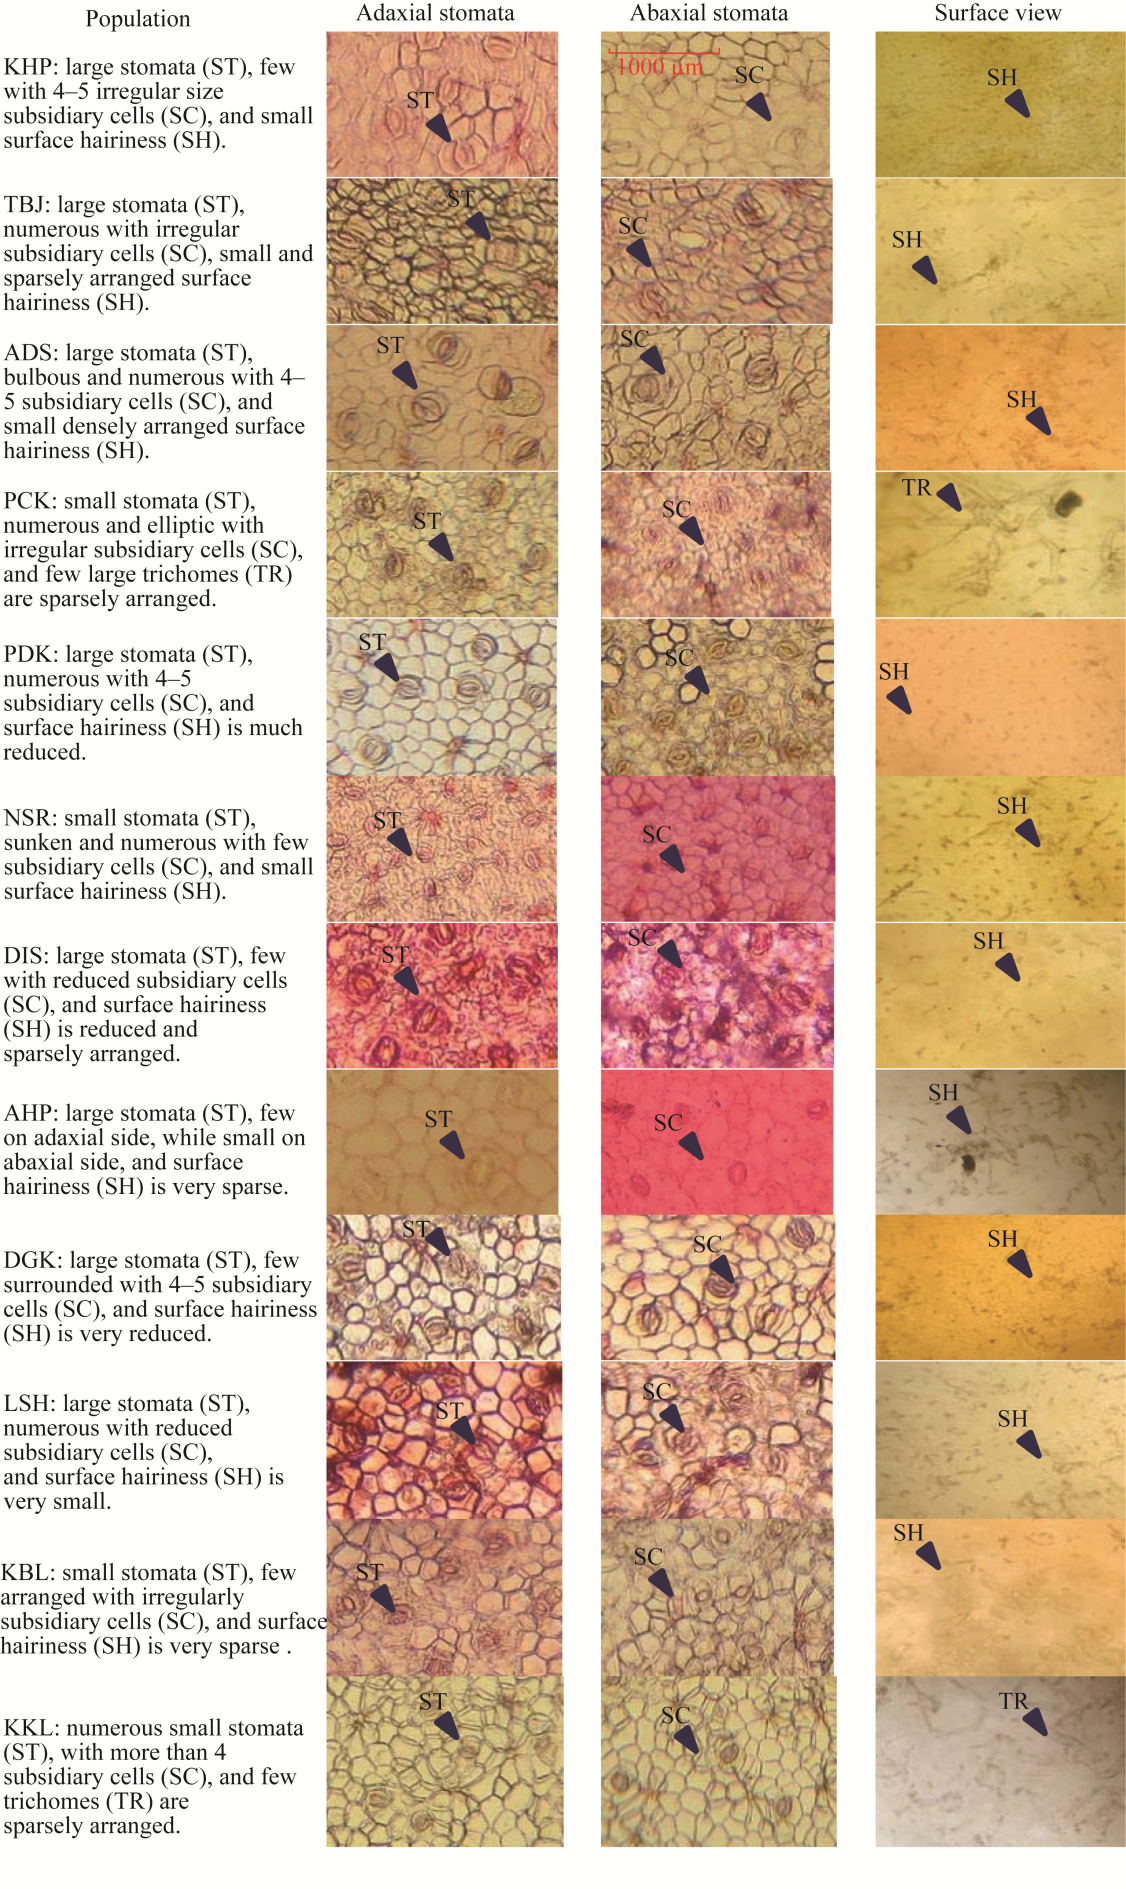
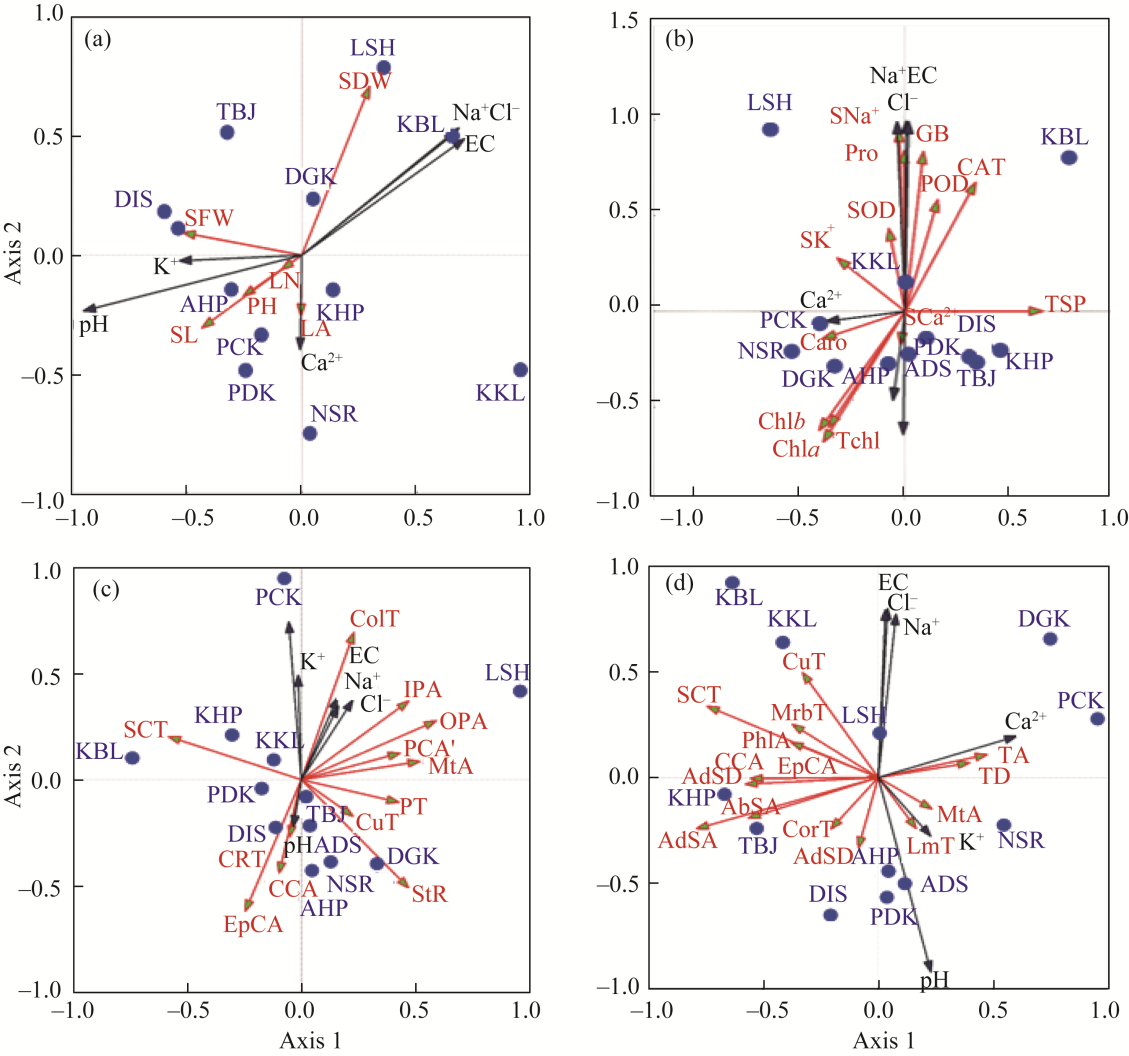
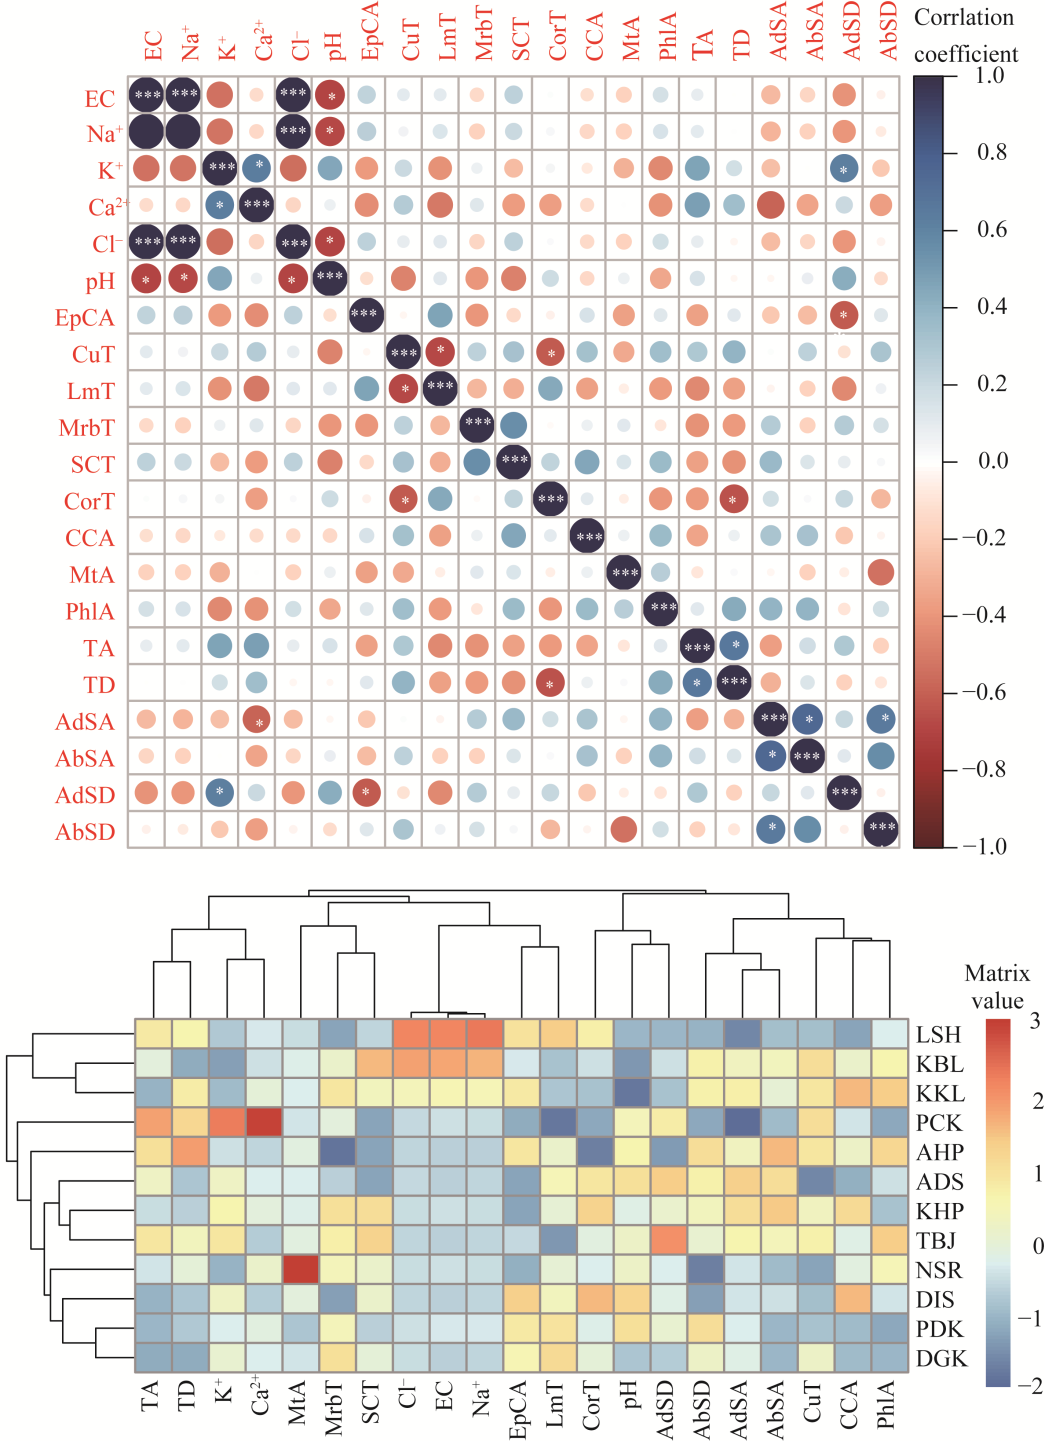
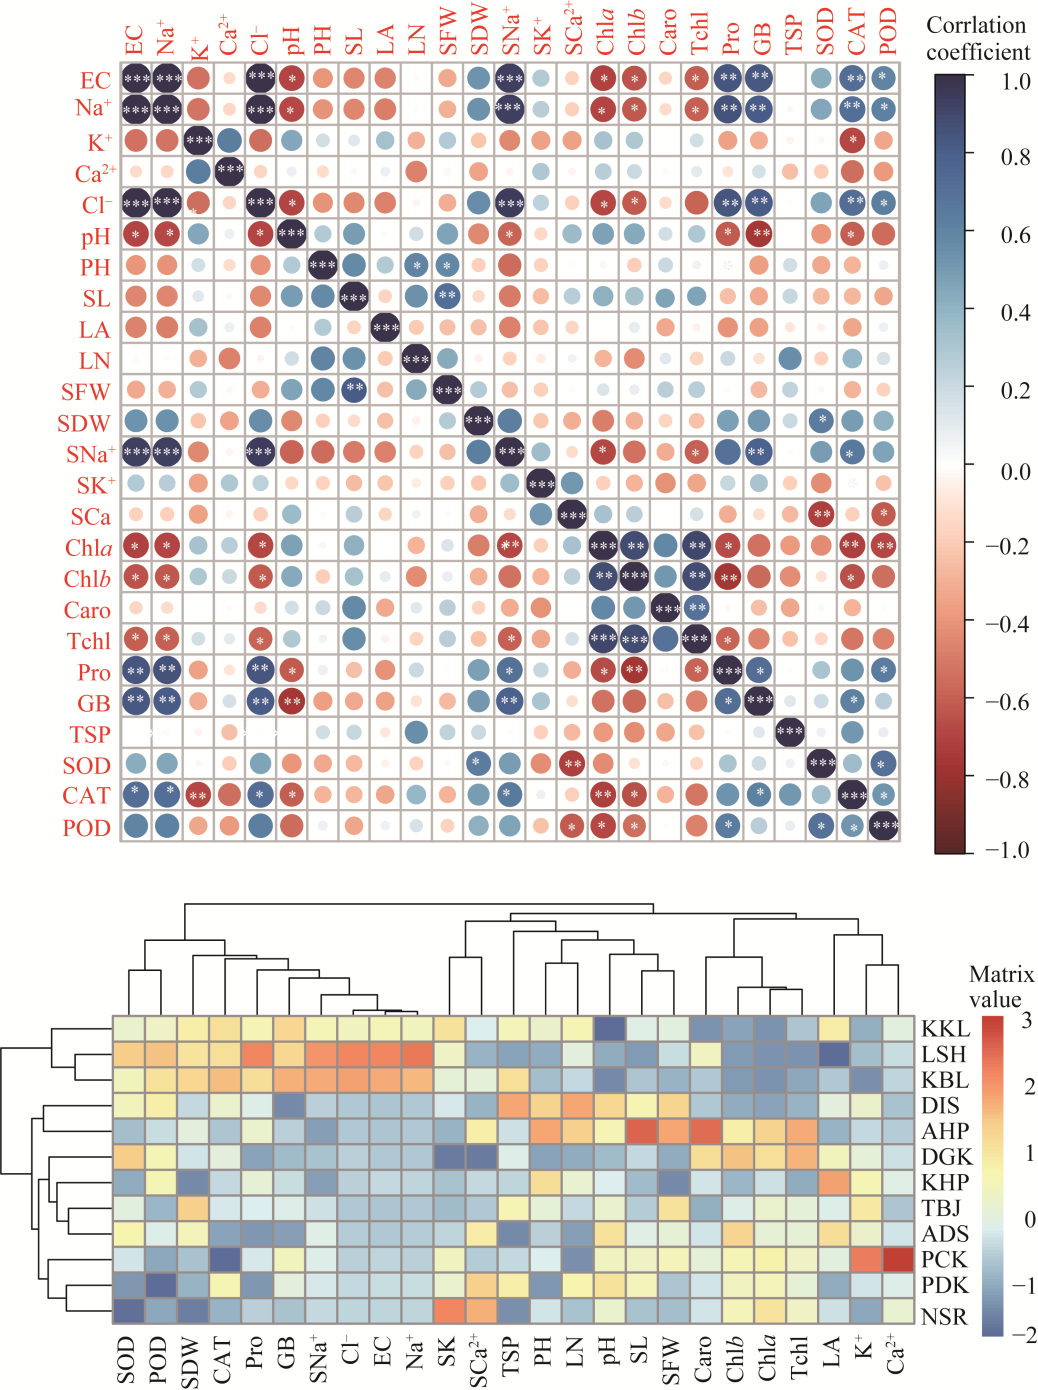
Abstract Calotropis procera (Aiton) W. T. Aiton, belonging to the family Apocynaceae, is C3 evergreen plant species in arid and semi-arid areas of the Punjab Province, Pakistan. It grows in a variety of habitats like salt affected and waterlogged area, desert/semi-desert, roadside, wasteland, graveyard, forest, crop field, coastline, and river/canal bank. A total of 12 populations growing in different ecological regions were sampled to evaluate their growth, physio-biochemical, and anatomical responses to specific environmental condition. Population adapted to desert/semi-desert showed vigorous growth (plant height, shoot length, and number of leaves), enhanced photosynthetic level (chlorophyll a, chlorophyll b, carotenoids, and total chlorophyll), and apparent anatomical modifications such as increased stem radius, cuticle thickness, storage parenchyma tissues (cortex and pith), and vascular bundles in stems, while the maximum of midrib and lamina thickness, epidermal cells, cuticle thickness, cortical proportion, abaxial stomatal density, and its area in leaves. There was high plasticity in structural and functional features of these populations, which enable them to survive and tolerate under such hot and dry desert environment. Population of saline areas exhibited very critical modifications to sustain under salt prone environment. At physiological level, it possesses the maximum amount of organic osmolytes (glycine betaine and proline) and antioxidants (superoxide dismutase (SOD), catalase (CAT), and peroxidase (POD)), while at anatomical level, it showed intensive sclerification, large phloem region (inner and outer), pith parenchyma cells, and metaxylem vessels in stems and leaves. The population of dry mountains showed very distinctive features, such as increased shoot ionic contents (K+ and Ca2+), collenchyma and sclerenchyma thickness in stems, trichomes size, and numerous small stomata on abaxial surface of leaves. It is concluded that no definite or precise single character can be taken as a yardstick for adjudging the biomass production in this rubber bush weed population.
|
|
Received: 24 November 2022
Published: 31 May 2023
|
|
Corresponding Authors:
*Ummar IQBAL (E-mail: ummariqbal@yahoo.com)
|
|
|
| [1] |
Abd Elhalim M E, Abo-Alatta O K, Habib S A, et al. 2016. The anatomical features of the desert halophytes Zygophyllum album L. F. and Nitraria retusa (Forssk.) Asch. Annals of Agricultural Science, 61(1): 97-104.
|
|
|
| [2] |
Ahanger M A, Tomar N S, Tittal M, et al. 2017. Plant growth under water/salt stress: ROS production, antioxidants and significance of added potassium under such conditions. Physiology and Molecular Biology of Plants, 23(4): 731-744.
doi: 10.1007/s12298-017-0462-7
|
|
|
| [3] |
Akcin T A, Akcin A, Yalcin E. 2015. Anatomical adaptations to salinity in Spergularia marina (Caryophyllaceae) from Turkey. Proceedings of the National Academy of Sciences India Section B: Biological Sciences, 85: 625-634.
|
|
|
| [4] |
Alzahrani S M, Alaraidh I A, Migdadi H, et al. 2019. Physiological, biochemical, and antioxidant properties of two genotypes of Vicia faba grown under salinity stress. Pakistan Journal Botany, 51(3): 786-798.
|
|
|
| [5] |
Arnon D I. 1949. Copper enzymes in isolated chloroplasts: Polyphenoloxidase in Beta vulgaris. Plant Physiology, 24(1): 1-15.
doi: 10.1104/pp.24.1.1
pmid: 16654194
|
|
|
| [6] |
Bates L S, Waldren R P, Teare I D. 1973. Rapid determination of free proline for water-stress studies. Plant and Soil, 39: 205-207.
doi: 10.1007/BF00018060
|
|
|
| [7] |
Batool A, Ashraf M, Akram N A, et al. 2013. Salt-induced changes in the growth, key physicochemical and biochemical parameters, enzyme activities, and levels of non-enzymatic anti-oxidants in cauliflower (Brassica oleracea L.). Journal of Horticultural Science and Biotechnology, 88(2): 231-241.
doi: 10.1080/14620316.2013.11512961
|
|
|
| [8] |
Boutraa T. 2010. Growth performance and biomass partitioning of the desert shrub Calotropis procera under water stress conditions. Journal of Horticultural Science and Biotechnology, 6: 20-26.
|
|
|
| [9] |
Bradford M M. 1976. A rapid and sensitive method for the quantitation of microgram quantities of protein utilizing the principle of protein-dye binding. Analytical Biochemistry, 72(1-2): 248-254.
doi: 10.1016/0003-2697(76)90527-3
|
|
|
| [10] |
Buckley T N. 2019. How do stomata respond to water status?. New Phytologist, 224(1): 21-36.
doi: 10.1111/nph.15899
pmid: 31069803
|
|
|
| [11] |
Chance B, Maehly A C. 1955. The assay of catalases and peroxidases. In: David G. Method of Biochemical Analysis. New York: Interscience Publishers Inc., 764-775.
|
|
|
| [12] |
De Faria A P, Marabesi M A, Gaspar M, et al. 2018. The increase of current atmospheric CO2 and temperature can benefit leaf gas exchanges, carbohydrate content and growth in C4 grass invaders of the Cerrado biome. Plant Physiology and Biochemistry, 127: 608-616.
doi: S0981-9428(18)30200-6
pmid: 29738989
|
|
|
| [13] |
Dolatabadian A, Sanavy S A M M, Ghanati F. 2011. Effect of salinity on growth, xylem structure and anatomical characteristics of soybean. Notulae Scientia Biologicae, 3(1): 41-45.
doi: 10.15835/nsb315627
|
|
|
| [14] |
Drake P L, De Boer H J, Schymanski S J, et al. 2019. Two sides to every leaf: water and CO2 transport in hypostomatous and amphistomatous leaves. New Phytologist, 222(3): 1179-1187.
doi: 10.1111/nph.15652
pmid: 30570766
|
|
|
| [15] |
Duan H, Chaszar B, Lewis J D, et al. 2018. CO2 and temperature effects on morphological and physiological traits affecting risk of drought-induced mortality. Tree Physiology, 38(8): 1138-1151.
doi: 10.1093/treephys/tpy037
|
|
|
| [16] |
El-Hendawy S E, Hassan W M, Al-Suhaibani N A, et al. 2017. Comparative performance of multivariable agro-physiological parameters for detecting salt tolerance of wheat cultivars under simulated saline field growing conditions. Frontiers of Plant Science, 435: 1-15.
|
|
|
| [17] |
Fatima S, Hameed M, Naz N, et al. 2021. Survival strategies in Khavi grass (Cymbopogon jwarancusa (Jones) Schult.) colonizing hot hypersaline and arid environments. Water, Air and Soil Pollution, 232: 1-17.
doi: 10.1007/s11270-020-04943-x
|
|
|
| [18] |
Giannopolitis C N, Ries S K. 1977. Superoxide dismutases: I. Occurrence in higher plants. Plant Physiology, 59(2): 309-314.
doi: 10.1104/pp.59.2.309
pmid: 16659839
|
|
|
| [19] |
Grieve C M, Grattan S R. 1983. Rapid assay for determination of water-soluble quaternary ammonium compounds. Plant and Soil, 70: 303-307.
doi: 10.1007/BF02374789
|
|
|
| [20] |
Grubb P J, Marañón T, Pugnaire F I, et al. 2015. Relationships between specific leaf area and leaf composition in succulent and non-succulent species of contrasting semi-desert communities in south-eastern Spain. Jounal of Arid Environment, 118: 69-83.
|
|
|
| [21] |
Hameed M, Batool S, Naz N, et al. 2012. Leaf structural modifications for drought tolerance in some differentially adapted ecotypes of blue panic (Panicum antidotale Retz.). Acta Physiologiae Plantarum, 34: 1479-1491.
doi: 10.1007/s11738-012-0946-6
|
|
|
| [22] |
Hameed M, Fatima S, Shah S M, et al. 2020. Ultrastructural response of wheat (Triticum aestivum L.) lines to potential allelopathy of Alstonia scholaris (L.) R. Br. leaf extract. Turkish Journal of Botany, 44(5): 509-525.
doi: 10.3906/bot-2004-10
|
|
|
| [23] |
Hasanuzzaman M, Bhuyan M H M, Zulfiqar F, et al. 2020. Reactive oxygen species and antioxidant defense in plants under abiotic stress: Revisiting the crucial role of a universal defense regulator. Antioxidants, 9(8): 681, doi: 10.3390/antiox9080681.
doi: 10.3390/antiox9080681
|
|
|
| [24] |
Hassan L M, Galal T M, Farahat E A, et al. 2015. The biology of Calotropis procera (Aiton) W. T. Trees, 29: 311-320.
doi: 10.1007/s00468-015-1158-7
|
|
|
| [25] |
Hussain S, Hussain S, Ali B, et al. 2021. Recent progress in understanding salinity tolerance in plants: Story of Na+/K+ balance and beyond. Plant Physiology and Biochemistry, 160: 239-256.
doi: 10.1016/j.plaphy.2021.01.029
pmid: 33524921
|
|
|
| [26] |
Iqbal U, Hameed M, Ahmad F. 2021. Water conservation strategies through anatomical traits in the endangered arid zone species Salvadora oleoides Decne. Turkish Journal of Botany, 45(2): 140-157.
doi: 10.3906/bot-2010-43
|
|
|
| [27] |
Kaleem M, Hameed M. 2021. Plasticity in structural and functional traits associated with photosynthesis in Fimbristylis complanata (Retz.) Link. under salt stress. Pakistan Journal of Botany, 53(4): 1199-1208.
|
|
|
| [28] |
Khan S A, Ranjha M H, Khan A A, et al. 2019. Insecticidal efficacy of wild medicinal plants, Dhatura alba and Calotropis procera, against Trogoderma granarium (Everts) in wheat store grains. Pakistan Journal of Zoology, 51(1): 289-294.
|
|
|
| [29] |
Koutroulis A G. 2019. Dryland changes under different levels of global warming. Science of the Total Environment, 655: 482-511.
doi: 10.1016/j.scitotenv.2018.11.215
|
|
|
| [30] |
Liu C, Li Y, Zhang J, et al. 2020. Optimal community assembly related to leaf economic-hydraulic-anatomical traits. Frontiers of Plant Science, 11: 341, doi: 10.3389/fpls.2020.00341.
doi: 10.3389/fpls.2020.00341
|
|
|
| [31] |
Maimaitiyiming M, Ghulam A, Bozzolo A, et al. 2017. Early detection of plant physiological responses to different levels of water stress using reflectance spectroscopy. Remote Sensing of Environment, 9(7): 745, doi: 10.3390/rs9070745.
doi: 10.3390/rs9070745
|
|
|
| [32] |
Menge E O, Stobo-Wilson A, Oliveira S L, et al. 2016. The potential distribution of the woody weed Calotropis procera (Aiton) WT Aiton (Asclepiadaceae) in Australia. The Rangeland Journal, 38(1): 35-46.
doi: 10.1071/RJ15081
|
|
|
| [33] |
Muchate N S, Nikalje G C, Rajurkar N S, et al. 2016. Physiological responses of the halophyte Sesuvium portulacastrum to salt stress and their relevance for saline soil bio-reclamation. Flora. 224: 96-105.
doi: 10.1016/j.flora.2016.07.009
|
|
|
| [34] |
Muhammad I, Shalmani A, Ali M, et al. 2021. Mechanisms regulating the dynamics of photosynthesis under abiotic stresses. Frontiers of Plant Science, 11: 615942, doi: 10.3389/fpls.2020.615942.
doi: 10.3389/fpls.2020.615942
|
|
|
| [35] |
Mutwakil M Z, Hajrah N H, Atef A, et al. 2017. Transcriptomic and metabolic responses of Calotropis procera to salt and drought stress. BMC Plant Biology, 17(1): 231, doi: 10.1186/s12870-017-1155-7.
doi: 10.1186/s12870-017-1155-7
|
|
|
| [36] |
Obidiegwu J E, Bryan G J, Jones H G, et al. 2015. Coping with drought: Stress and adaptive responses in potato and perspectives for improvement. Frontiers of Plant Science, 6: 542, doi: 10.3389/fpls.2015.00542.
doi: 10.3389/fpls.2015.00542
|
|
|
| [37] |
Paccard A, Vance M, Willi Y. 2013. Weak impact of fine-scale landscape heterogeneity on evolutionary potential in Arabidopsis lyrata. Journal of Evolutionary Biology 26(11): 2331-2340.
doi: 10.1111/jeb.12220
pmid: 23980569
|
|
|
| [38] |
Peñuelas J, Sardans J, Filella I, et al. 2018. Assessment of the impacts of climate change on Mediterranean terrestrial ecosystems based on data from field experiments and long-term monitored field gradients in Catalonia. Environmental and Experimental Botany, 152: 49-59.
doi: 10.1016/j.envexpbot.2017.05.012
|
|
|
| [39] |
Pompelli M F, Mendes K R, Ramos M V, et al. 2019. Mesophyll thickness and sclerophylly among Calotropis procera morphotypes reveal water-saved adaptation to environments. Journal of Arid Land, 11(6): 795-810.
doi: 10.1007/s40333-019-0016-7
|
|
|
| [40] |
R Development Core Team. 2017. R: A Language and Environment for Statistical Computing R Foundation for Statistical Computing, Vienna, Austria. [2022-01-15]. http://www.R-project.org.
|
|
|
| [41] |
Rivas R, Barros V, Falcão H, et al. 2020. Ecophysiological traits of invasive C3 species Calotropis procera to maintain high photosynthetic performance under high VPD and low soil water balance in semi-arid and seacoast zones. Frontiers of Plant Science, 11: 717, doi: 10.3389/fpls.2020.00717.
doi: 10.3389/fpls.2020.00717
|
|
|
| [42] |
Rouached H, Secco D, Arpat B A. 2010. Regulation of ion homeostasis in plants: Current approaches and future challenges. Plant Signaling and Behavior, 5(5): 501-502.
doi: 10.4161/psb.11027
pmid: 20383067
|
|
|
| [43] |
Rudall P J, Hilton J, Bateman R M. 2013. Several developmental and morphogenetic factors govern the evolution of stomatal patterning in land plants. New Phytologist, 200(3): 598-614.
doi: 10.1111/nph.12406
pmid: 23909825
|
|
|
| [44] |
Ruzin S E. 1999. Plant Microtechnique and Microscopy. New York: Oxford University Press, 198.
|
|
|
| [45] |
Sachdev S, Ansari S A, Ansari M I, et al. 2021. Abiotic stress and reactive oxygen species: Generation, signaling, and defense mechanisms. Antioxidants, 10(2): 277, doi: 10.3390/antiox10020277.
doi: 10.3390/antiox10020277
|
|
|
| [46] |
Sekmen A H, Bor M, Ozdemir F, et al. 2013. Current concepts about salinity and salinity tolerance in plants. Climate Change and Plant Abiotic Stress Tolerance, 28: 163-188.
|
|
|
| [47] |
Sheikh-Mohamadi M H, Etemadi N, Nikbakht A, et al. 2017. Antioxidant defence system and physiological responses of Iranian crested wheatgrass (Agropyron cristatum L.) to drought and salinity stress. Acta Physiologiae Plantarum, 39(11): 245, doi: 10.1007/s11738-017-2543-1.
doi: 10.1007/s11738-017-2543-1
|
|
|
| [48] |
Silva H, Sagardia S, Ortiz M, et al. 2014. Relationships between leaf anatomy, morphology, and water use efficiency in Aloe vera (L) Burm f. as a function of water availability. Revista Chilena de Historia Natural, 87: 13, doi: 10.1186/s40693-014-0013-3.
doi: 10.1186/s40693-014-0013-3
|
|
|
| [49] |
Snedecor G W, Cochran W G. 1980. Statistical Methods (7th ed.). Ames: Iowa State University Press, 68-93.
|
|
|
| [50] |
Steel R G D, Torrie J H, Dicky D A. 1997. Principles and Procedures of Statistics:A Biometrical Approach. New York: McGraw Hill Inc., 25-68.
|
|
|
| [51] |
Su R, Zhou R, Mmadi M A, et al. 2019. Root diversity in sesame (Sesamum indicum L.): Insights into the morphological, anatomical and gene expression profiles. Planta, 250(5): 1461-1474.
doi: 10.1007/s00425-019-03242-y
|
|
|
| [52] |
Tezara W, Colombo R, Coronel I, et al. 2011. Water relations and photosynthetic capacity of two species of Calotropis in a tropical semi-arid ecosystem. Annals of Botany, 107(3): 397-405.
doi: 10.1093/aob/mcq245
|
|
|
| [53] |
Wolf B. 1982. An improved universal extracting solution and its use for diagnosing soil fertility. Communications in Soil Science and Plant Analysis, 13(12): 1005-1033.
doi: 10.1080/00103628209367331
|
|
|
| [54] |
Zhang W, Tian Z, Pan X, et al. 2013. Oxidative stress and non-enzymatic antioxidants in leaves of three edible canna cultivars under drought stress. Horticulture, Environment, and Biotechnology, 54(1): 1-8.
doi: 10.1007/s13580-013-0070-6
|
|
|
| [55] |
Zokaee-Khosroshahi M, Esna-Ashari M, Ershadi A, et al. 2014. Morphological changes in response to drought stress in cultivated and wild almond species. International Journal of Horticultural Science, 1(1): 79-92.
|
|
|
|
Viewed |
|
|
|
Full text
|
|
|
|
|
Abstract
|
|
|
|
|
Cited |
|
|
|
|
| |
Shared |
|
|
|
|
| |
Discussed |
|
|
|
|