| Research article |
|


|
|
|
| Wind regime features and their impacts on the middle reaches of the Yarlung Zangbo River on the Tibetan Plateau, China |
ZHANG Yan1,2, ZHANG Zhengcai3,4,*( ), MA Pengfei5, PAN Kaijia2,3, ZHA Duo6, CHEN Dingmei6, SHEN Caisheng7, LIANG Aimin4 ), MA Pengfei5, PAN Kaijia2,3, ZHA Duo6, CHEN Dingmei6, SHEN Caisheng7, LIANG Aimin4 |
1Institute of Atmosphere Physics, Chinese Academy of Sciences, Beijing 100029, China
2University of Chinese Academy of Sciences, Beijing 100083, China
3Key Laboratory of Desert and Desertification, Northwest Institute of Eco-environment and Resources, Chinese Academy of Sciences, Lanzhou 730000, China
4Shaanxi Normal University, Xi'an 710119, China
5Tibet Climate Center, Lhasa 850000, China
6Shannan Meteorological Bureau, Shannan 856000, China
7Policy Research Office of Party Committee of Tibet Autonomous Region, Lhasa 850000, China |
|
|
|
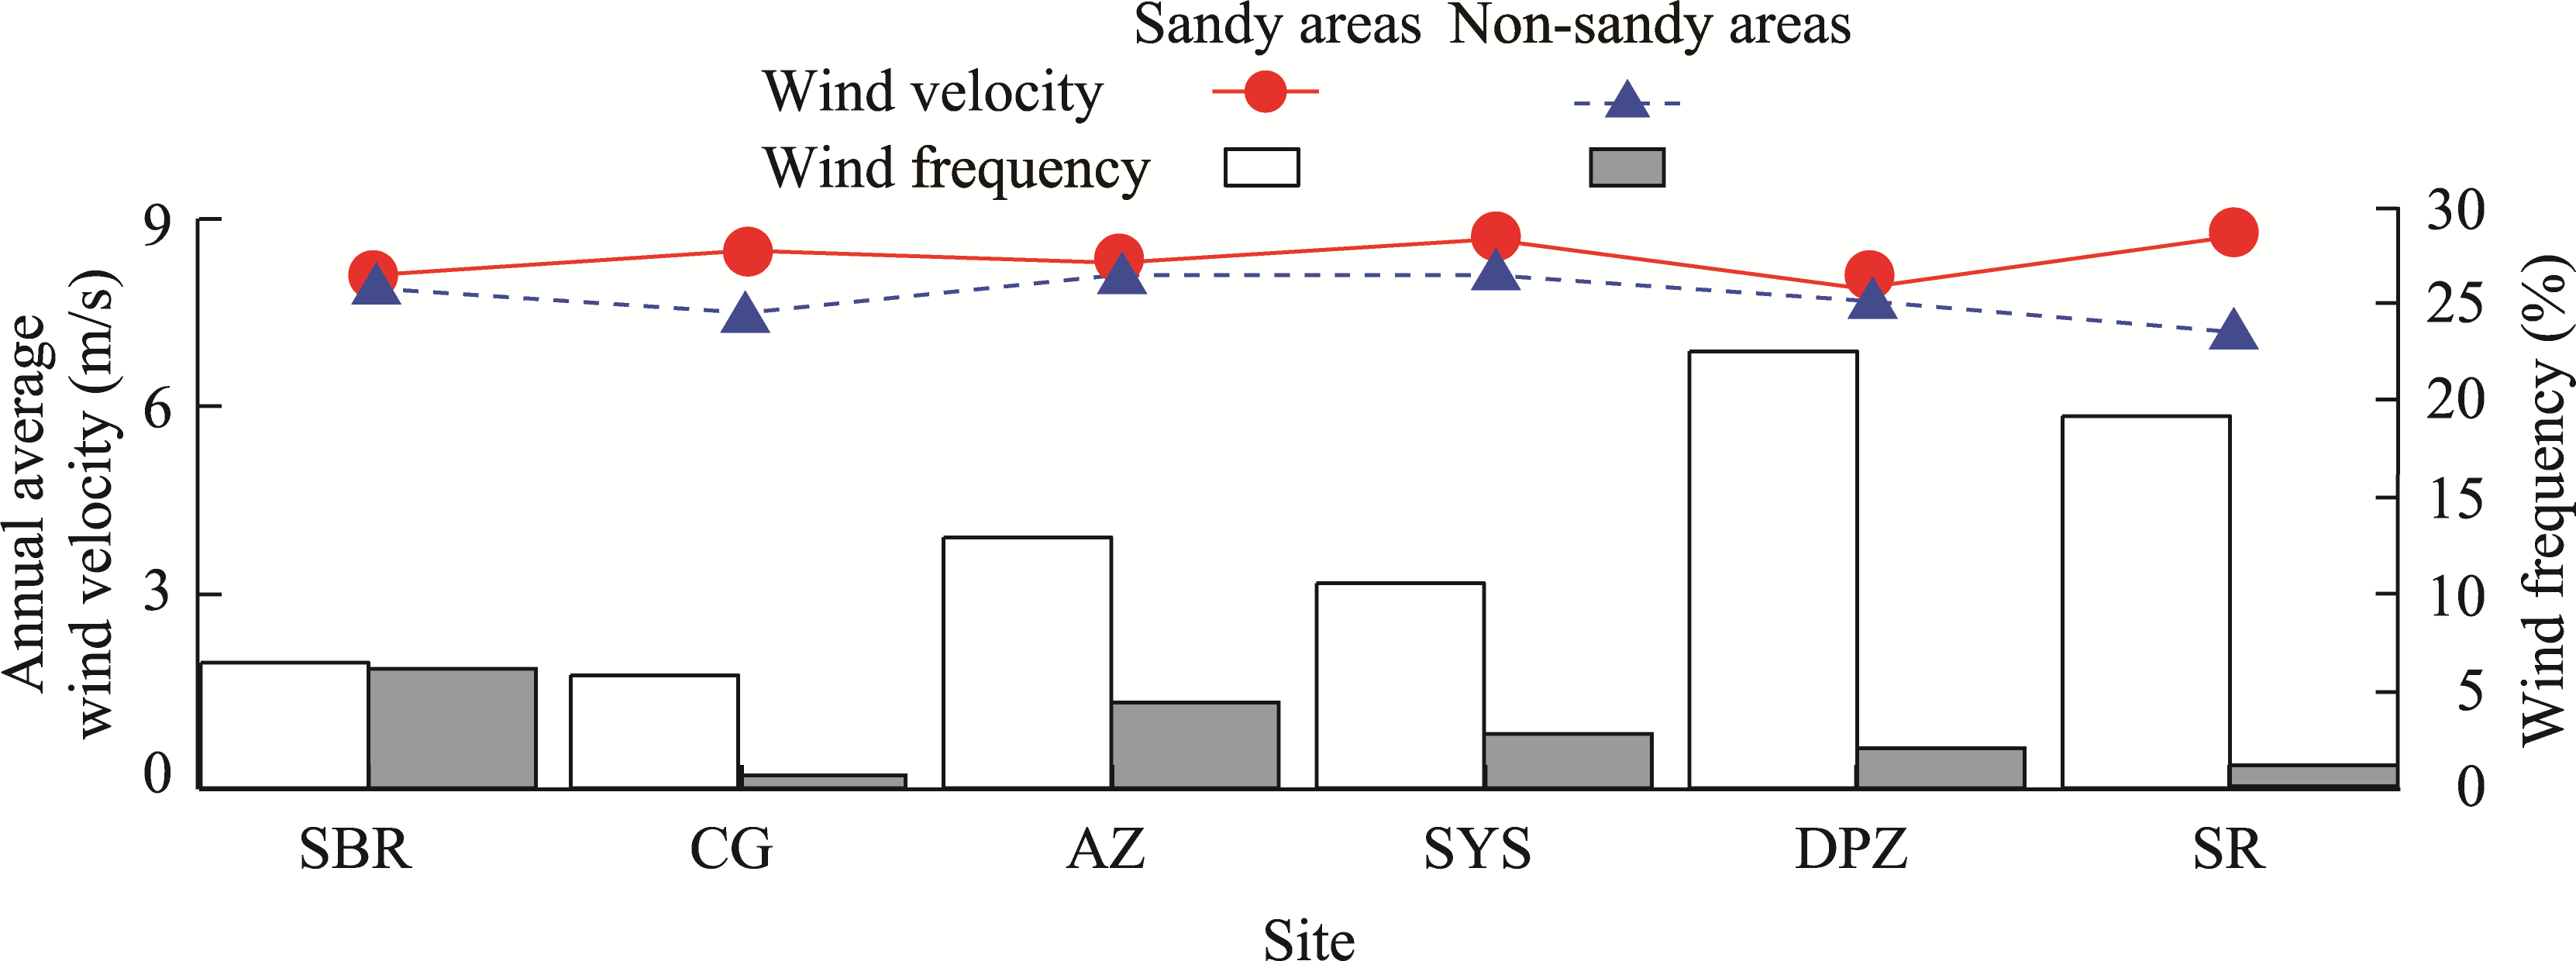
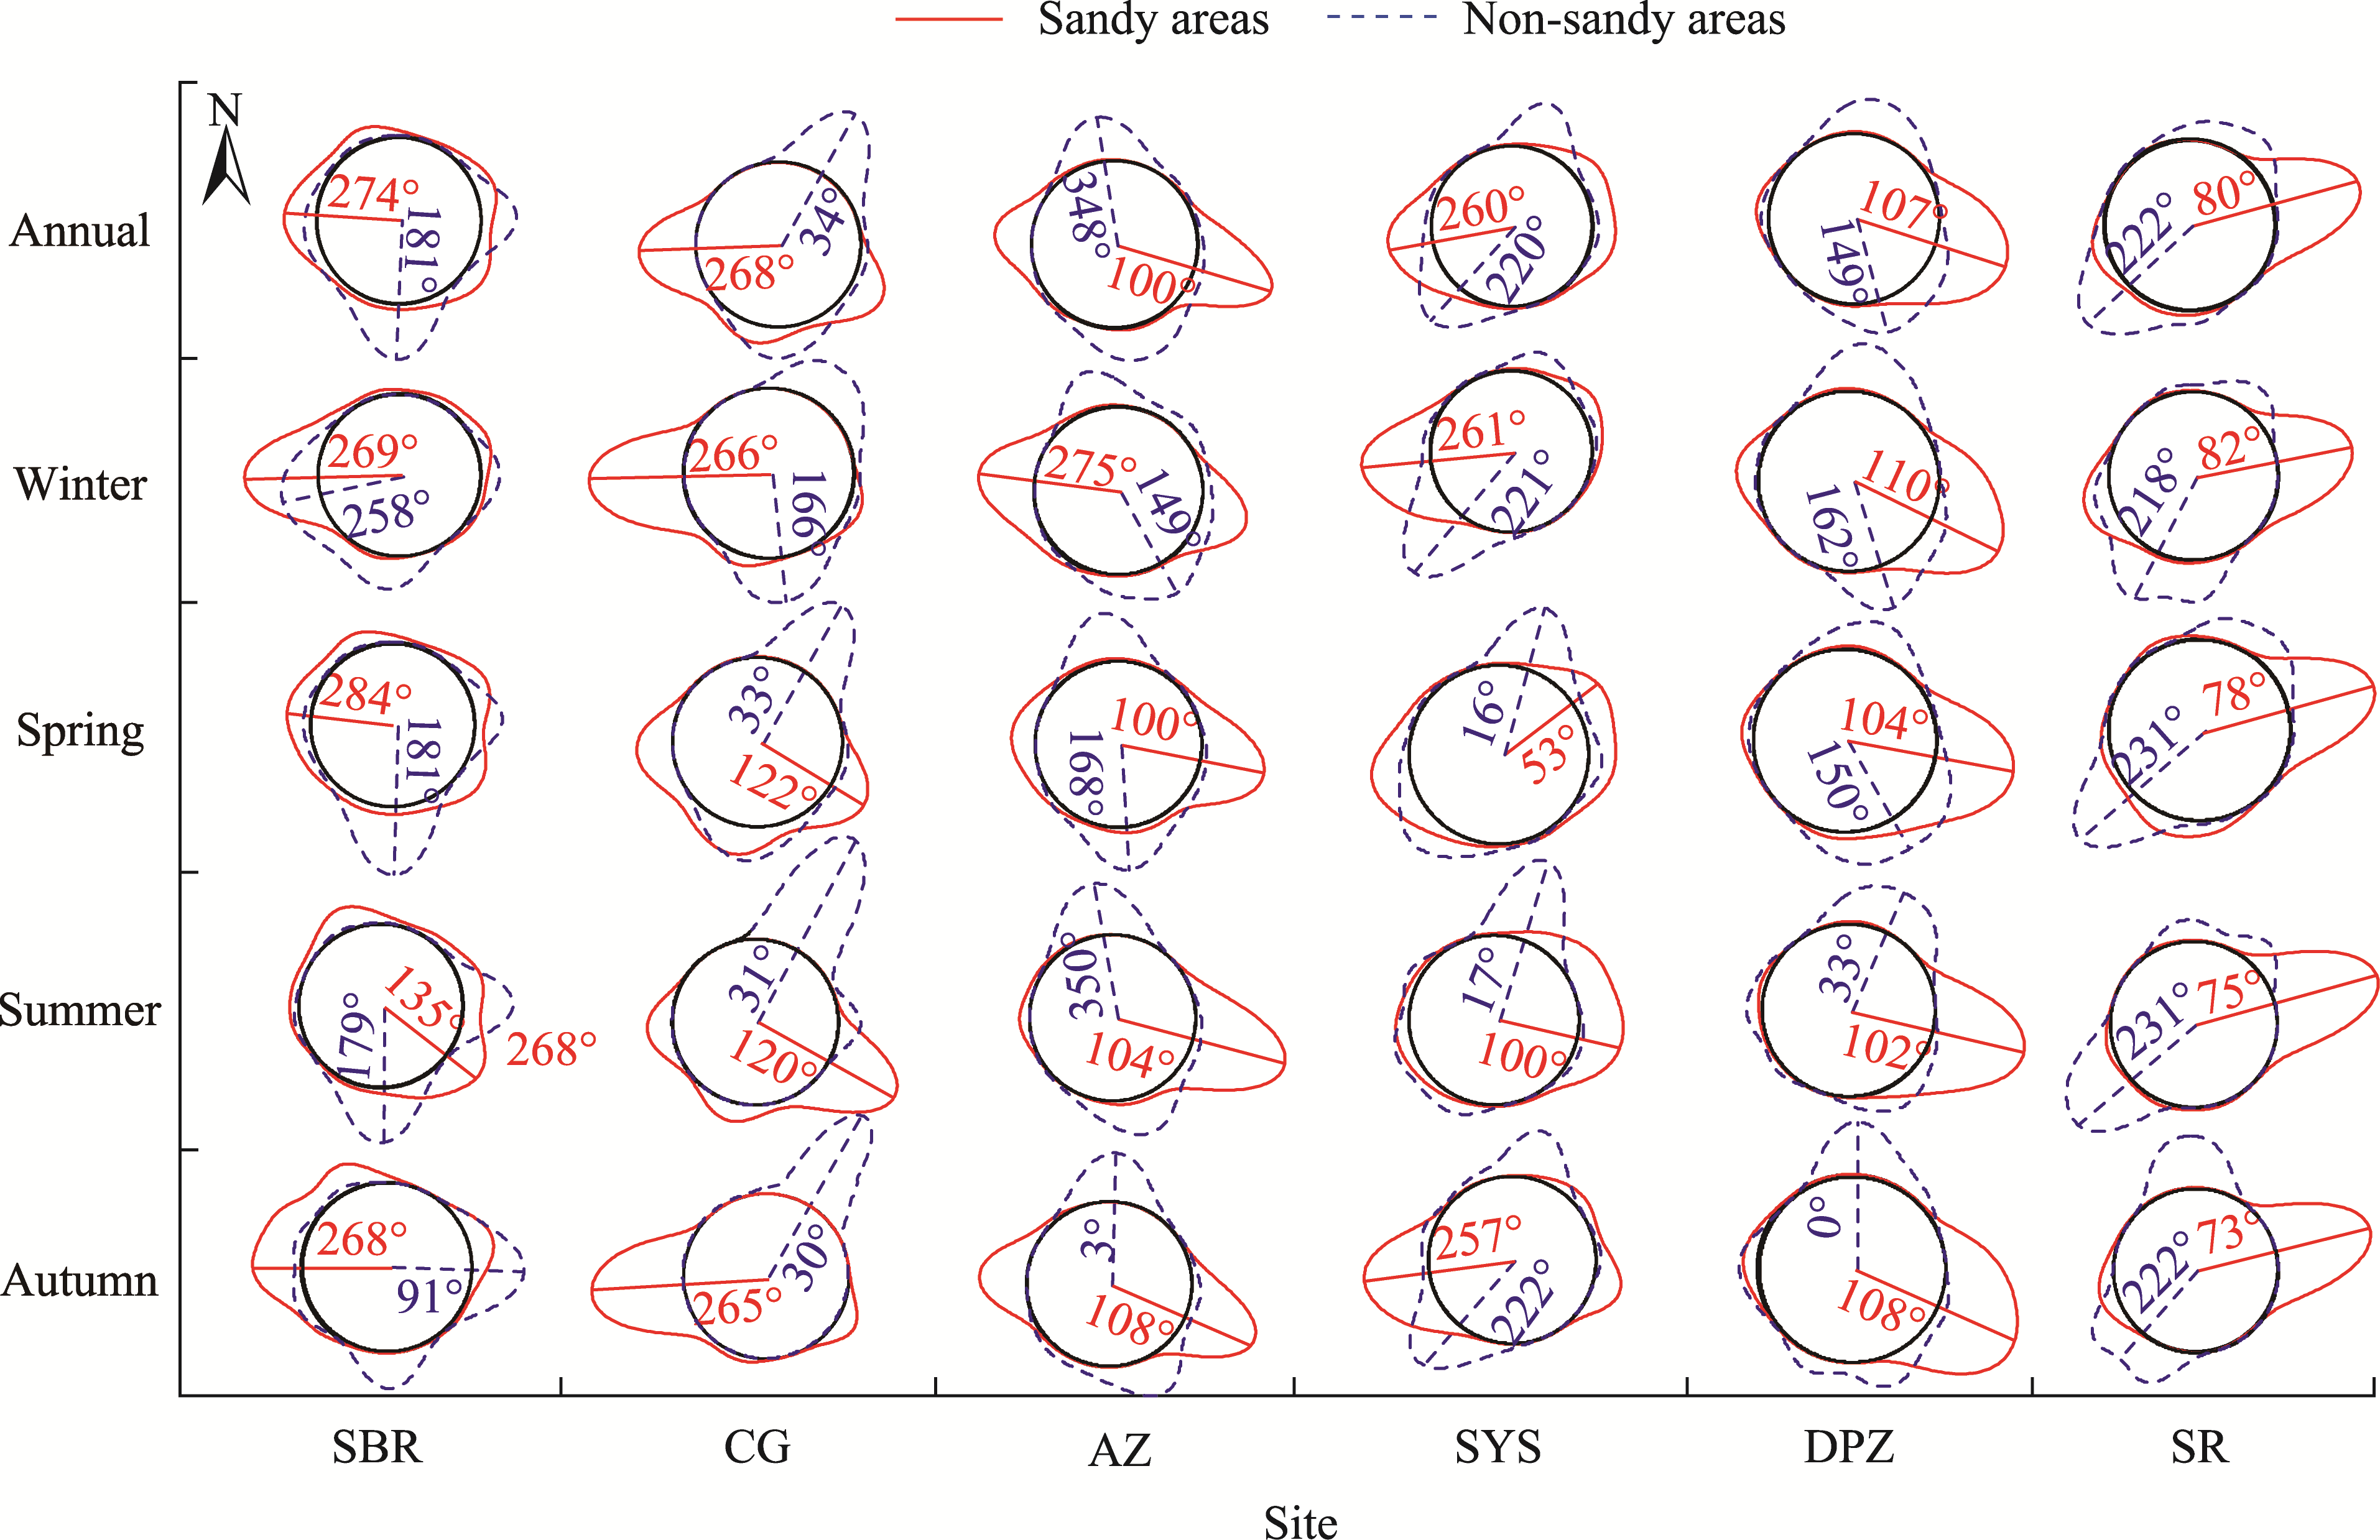
Abstract The wide valley of the Yarlung Zangbo River is one of the most intense areas in terms of aeolian activity on the Tibetan Plateau, China. In the past, the evaluation of the intensity of aeolian activity in the Quxu-Sangri section of the Yarlung Zangbo River Valley was mainly based on data from the old meteorological stations, especially in non-sandy areas. In 2020, six new meteorological stations, which are closest to the new meteorological stations, were built in the wind erosion source regions (i.e., sandy areas) in the Quxu-Sangri section. In this study, based on mathematical statistics and empirical orthogonal function (EOF) decomposition analysis, we compared the difference of the wind regime between new meteorological stations and old meteorological stations from December 2020 to November 2021, and discussed the reasons for the discrepancy. The results showed that sandy and non-sandy areas differed significantly regarding the mean velocity (8.3 (±0.3) versus 7.7 (±0.3) m/s, respectively), frequency (12.9% (±6.2%) versus 2.9% (±1.9%), respectively), and dominant direction (nearly east or west versus nearly north or south, respectively) of sand-driving winds, drift potential (168.1 (±77.3) versus 24.0 (±17.9) VU (where VU is the vector unit), respectively), resultant drift potential (92.3 (±78.5) versus 8.7 (±9.2) VU, respectively), and resultant drift direction (nearly westward or eastward versus nearly southward or northward, respectively). This indicated an obvious spatial variation in the wind regime between sandy and non-sandy areas and suggested that there exist problems when using wind velocity data from non-sandy areas to evaluate the wind regime in sandy areas. The wind regime between sandy and non-sandy areas differed due to the differences in topography, heat flows, and their coupling with underlying surface, thereby affecting the local atmospheric circulation. Affected by large-scale circulations (westerly jet and Indian monsoon systems), both sandy and non-sandy areas showed similar seasonal variations in their respective wind regime. These findings provide a credible reference for re-understanding the wind regime and scientific wind-sand control in the middle reaches of the Yarlung Zangbo River Valley.
|
|
Received: 06 April 2023
Published: 31 October 2023
|
|
Corresponding Authors:
*ZHANG Zhengcai (E-mail: zhangzhengcai@snnu.edu.cn)
|
| Cite this article:
ZHANG Yan, ZHANG Zhengcai, MA Pengfei, PAN Kaijia, ZHA Duo, CHEN Dingmei, SHEN Caisheng, LIANG Aimin. Wind regime features and their impacts on the middle reaches of the Yarlung Zangbo River on the Tibetan Plateau, China. Journal of Arid Land, 2023, 15(10): 1174-1195.
URL:
http://jal.xjegi.com/10.1007/s40333-023-0066-8 OR http://jal.xjegi.com/Y2023/V15/I10/1174
|
|
|
| [1] |
Bagnold R A. 1941. The Physics of Blown Sand and Desert Dunes. London: Methuen, 267-277.
|
|
|
| [2] |
Baumbach G, Vogt U. 1999. Experimental determination of the effect of mountain-valley breeze circulation on air pollution in the vicinity of Freiburg. Atmosphere Environment, 33(24-25): 4019-4027.
doi: 10.1016/S1352-2310(99)00143-0
|
|
|
| [3] |
Bei N F, Zhao L N, Wu J R, et al. 2018. Impacts of sea-land and mountain-valley circulations on the air pollution in Beijing-Tianjin-Hebei (BTH): A case study. Environment Pollution, 234: 429-438.
doi: 10.1016/j.envpol.2017.11.066
|
|
|
| [4] |
Ben Y, Mei Y D, Chen Y M, et al. 2020. Inter- and intra-annual wind speed variabilities in wide valley regions of the middle reaches of the Yarlung Tsangpo River, China. Scientific Report, 10: 12657, doi: 10.1038/s41598-020-69392-2.
|
|
|
| [5] |
Benaglia T, Chauveau D, Hunter D R, et al. 2009. Mixtools: An R package for analyzing finite mixture models. Journal of Statistical Software, 32(6): 1-29.
|
|
|
| [6] |
Dong Z B, Zhang Z C, Qian G Q, et al. 2013. Geomorphology of star dunes in the southern Kumtagh Desert, China: control factors and formation. Environmental Earth Sciences, 69: 267-277.
doi: 10.1007/s12665-012-1954-y
|
|
|
| [7] |
Dong Z B, Hu G Y, Qian G Q, et al. 2017. High-altitude aeolian research on the Tibetan Plateau. Reviews of Geophysics, 55(4): 864-901.
doi: 10.1002/rog.v55.4
|
|
|
| [8] |
Fan W W, Ma W Q, Zheng Y, et al. 2018. Long-term variation of surface heating over the Qinghai-Tibetan Plateau linked to the westerly jet. Plateau Meteorology, 37(3): 591-601. (in Chinese)
doi: 10.7522/j.issn.1000-0534.2017.00062
|
|
|
| [9] |
Fryberger G S, Dean G. 1979. Dune forms and wind regime. In: McKee E D. A Study of Global Sand Seas. Washington: US Government Printing Office, 159-163.
|
|
|
| [10] |
Gao X M, Dong Z B, Duan Z H, et al. 2019. Wind regime for long-ridge yardangs in the Qaidam Basin, Northwest China. Journal of Arid Land, 11(5): 701-712.
doi: 10.1007/s40333-019-0108-4
|
|
|
| [11] |
Gevorgyan A. 2017. Summertime wind climate in Yerevan: valley wind systems. Climate Dynamic, 48: 1827-1840.
doi: 10.1007/s00382-016-3175-7
|
|
|
| [12] |
He P L, Zhang J, Herrmann H J, et al. 2022. Large-eddy simulation of wind-blown sand under unstable atmospheric boundary layer. Science Bulletin, 67(14): 1421-1424.
doi: 10.1016/j.scib.2022.05.011
pmid: 36546183
|
|
|
| [13] |
Hefflin B J, Jalaudin B, McClure E, et al. 1994. Surveillance for dust storms and respiratory diseases in Washington State, 1991. Archives of Environmental Health, 49(3): 170-174.
pmid: 8185387
|
|
|
| [14] |
Huang J P, Yu H P, Guan X D, et al. 2016. Accelerated dryland expansion under climate change. Nature Climate Change, 6: 166-174.
doi: 10.1038/NCLIMATE2837
|
|
|
| [15] |
Kok J F, Parteli E J R, Michaels T I, et al. 2012. The physics of wind-blown sand and dust. Reports on Progress in Physics, 75(10): 106901, doi: 10.1088/0034-4885/75/10/106901.
|
|
|
| [16] |
Li C J, Wang Y D, Lei J Q, et al. 2021a. Damage by wind-blown sand and its control measures along the Taklimakan Desert Highway in China. Journal of Arid land, 13(1): 98-106.
doi: 10.1007/s40333-020-0071-0
|
|
|
| [17] |
Li H D, Shen W S, Zou C X, et al. 2012. Soil nutrients content and grain size fraction of aeolian sandy land in the Shannan Wide Valley of the Yarlung Zangbo River, China. Acta Ecologica Sinica, 32(16): 4981-4992. (in Chinese)
doi: 10.5846/stxb
|
|
|
| [18] |
Li P J, Zuo D P, Xu Z X, et al. 2021b. Dynamic changes of land use/cover and landscape pattern in a typical alpine river basin of the Qinghai-Tibet Plateau, China. Land Degradation and Development, 32(15): 4327-4339.
doi: 10.1002/ldr.v32.15
|
|
|
| [19] |
Li S, Yang P, Dong Y X, et al. 2010. Sandy Desertification and Its Control in Tibet. Beijing: Science Press, 146-156. (in Chinese)
|
|
|
| [20] |
Ling Z Y, Jin J H, Wu D, et al. 2019. Aeolian sediments and their paleoenvironmental implication in the Yarlung Zangbo catchment (southern Tibet, China) since MIS3. Acta Geographica Sinica, 74(11): 2385-2400. (in Chinese)
doi: 10.11821/dlxb201911014
|
|
|
| [21] |
Ling Z Y, Li J S, Jin J H, et al. 2021. Geochemical characteristics and provenance of aeolian sediments in the Yarlung Tsangpo valley, Southern Tibetan Plateau. Environment Earth Sciences, 80: 623, doi: 10.1007/s12665-021-09928-5.
|
|
|
| [22] |
Liu Y, Wang Y S, Shen T. 2019a. Spatial distribution and formation mechanism of aeolian sand in the middle reaches of the Yarlung Zangbo River. Journal of Mountain Science, 16(9): 1987-2000.
doi: 10.1007/s11629-019-5509-5
|
|
|
| [23] |
Liu Z Y, Dong Z B, Zhang Z C, et al. 2019b. Spatial and temporal variation of the near-surface wind regimes in the Taklimakan Desert, Northwest China. Theoretical and Applied Climatology, 138: 433-447.
doi: 10.1007/s00704-019-02824-w
|
|
|
| [24] |
Lü P, Dong Z B. 2008. The dependency of sand transport rate by wind on the atmospheric stability: a numerical simulation. Geomorphology, 99(1-4): 296-301.
doi: 10.1016/j.geomorph.2007.11.007
|
|
|
| [25] |
Lü P, Narteau C, Dong Z B, et al. 2014. Emergence of oblique dunes in a landscape-scale experiment. Nature Geoscience, 7: 99-103.
doi: 10.1038/ngeo2047
|
|
|
| [26] |
Luo J, Xin L J, Liu F G, et al. 2022. Study of the intensity and driving factors of land use/cover change in the Yarlung Zangbo River, Nyang Qu River, and Lhasa River region, Qinghai-Tibet Plateau of China. Journal of Arid Land, 14(4): 411-425.
doi: 10.1007/s40333-022-0093-x
|
|
|
| [27] |
Ma P F, Gao J J, Zha D, et al. 2021a. Analysis of soil nutrients in the aeolian disaster region along middle reaches of Yarlung Zangbo River. Journal of Arid Land Resources and Environment, 35(6): 96-101. (in Chinese)
|
|
|
| [28] |
Ma P F, Lunzhu Q F, Zhang Y, et al. 2021b. Sand supplement characteristics indicated by the area of river inland, flood plain in the riverbed of the Yarlung Zangbo River. Journal of Desert Research, 41(3): 25-33. (in Chinese)
|
|
|
| [29] |
Ma P F, Zhang Z C, Lunzhu Q P, et al. 2021c. Analysis on the sand transport wind power conditions and suggestions on the sand disaster preventions in the middle reaches of Yarlung Zangbo River, China. Journal of Desert Research, 41(1): 10-18. (in Chinese)
|
|
|
| [30] |
Meng N, Wang N A, Zhao L Q, et al. 2022. Wind regimes and associated sand dune types in the hinterland of the Badain Jaran Desert, China. Journal of Arid Land, 14(5): 473-489.
doi: 10.1007/s40333-022-0063-3
|
|
|
| [31] |
Ngo T T, Letchford C W. 2009. Experimental study of topographic effects on gust wind speed. Journal of Wind Engineering and Industrial Aerodynamics, 97(9-10): 426-438.
doi: 10.1016/j.jweia.2009.06.013
|
|
|
| [32] |
Pye K, Tsoar H. 2009. Aeolian Sand and Sand Dunes. London: Unwin Hyman, 56-60.
|
|
|
| [33] |
Shan X, Zhou S W, Wang M R, et al. 2019. Influence of atmospheric heat anomaly over the Tibetan Plateau on the westerly jet. Journal of the Meteorological Sciences, 39(2): 206-213. (in Chinese)
|
|
|
| [34] |
Shao Y P. 2008. Physics and Modelling of Wind Erosion. New York: Springer Science & Business Media, 26-27.
|
|
|
| [35] |
Shen W S, Li H D, Sun M, et al. 2012. Dynamics of aeolian sandy land in the Yarlung Zangbo River basin of Tibet, China from 1975 to 2008. Global and Planetary Change, 86-87: 37-44.
doi: 10.1016/j.gloplacha.2012.01.012
|
|
|
| [36] |
Stout J E. 2015. Diurnal patterns of blowing dust on the Llano Estacado. Journal of Arid Environments, 122: 85-92.
doi: 10.1016/j.jaridenv.2015.06.013
|
|
|
| [37] |
Stull R B. 1988. An Introduction to Boundary Layer Meteorology. Dordrecht: Kluwer Academic Publisher, 26-27.
|
|
|
| [38] |
Walker A S, Olsen J W, Bagen. 1987. The Badain Jaran desert: remote sensing investigations. Geographical Journal, 153(2): 205-210.
|
|
|
| [39] |
Wang R X, Liu B, Li H R, et al. 2017. Variation of strong dust storm events in Northern China during 1978-2007. Atmosphere Research, 183: 166-172.
|
|
|
| [40] |
Wei F Y. 2007. Climatological Statistical Diagnosis and Prediction Technology. Beijing: Meteorological Press, 116-118. (in Chinese)
|
|
|
| [41] |
Yang J H, Xia D S, Wang S Y, et al. 2020. Near-surface wind environment in the Yarlung Zangbo River basin, southern Tibetan Plateau. Journal of Arid Land, 12(6): 917-936.
doi: 10.1007/s40333-020-0104-8
|
|
|
| [42] |
Yang X L, Li Y Y, Chen J, et al. 2022. Transmission of rare strong dust and its weather process continuous characteristics in Hexi Corridor. Arid Land Geography, 45(5): 1415-1425. (in Chinese)
|
|
|
| [43] |
Yao T D, Piao S L, Shen M G, et al. 2017. Chained impacts on modern environment of interaction between westerlies and Indian Monsoon on Tibetan Plateau. Bulletin of Chinese Academy of Sciences, 32(9): 976-984. (in Chinese)
|
|
|
| [44] |
Zhang G F, Azorin-Molia C, Shi P J, et al. 2019. Impact of near-surface wind speed variability on wind erosion in the eastern agro-pastoral transitional zone of Northern China, 1982-2016. Agricultural and Forest Meteorology, 271: 102-115.
doi: 10.1016/j.agrformet.2019.02.039
|
|
|
| [45] |
Zhang H Z, Zhou K S, Duojie S Z, et al. 2018. Analysis of spatiotemporal variation characteristic of wind-sand days in the Yarlung Zangbo River basin during 1981-2016. Journal of Arid Land Resources and Environment, 32(12): 131-136. (in Chinese)
|
|
|
| [46] |
Zhang Y, Ma P F, Zeng L, et al. 2021. Study on silt and clay provenance in the Yarlung Zangbo River middle reaches using sediment physicochemical characteristics. Journal of Desert Research, 41(3): 92-100. (in Chinese)
doi: 10.7522/j.issn.1000-694X.2021.00024
|
|
|
| [47] |
Zhang Z C, Dong Z B, Wen Q, et al. 2014. Wind regimes and aeolian geomorphology in the western and southwestern Tengger Desert, NW China. Geological Journal, 50(6): 707-719.
doi: 10.1002/gj.2586
|
|
|
| [48] |
Zhang Z C, Dong Z B, Li C X. 2015. Wind regime and sand transport in China's Badain Jaran Desert. Aeolian Research, 17: 1-13.
doi: 10.1016/j.aeolia.2015.01.004
|
|
|
| [49] |
Zhang Z C, Zhang Y, Ma P F, et al. 2022a. Aerodynamic parameters of typical underlying surfaces in an aeolian region in the middle reaches of the Yarlung Zangbo River. Arid Zone Research, 39(04): 997-1005. (in Chinese)
|
|
|
| [50] |
Zhang Z C, Zhang Y, Ma P F, et al. 2022b. Aeolian sediment transport rates in the middle reaches of the Yarlung Zangbo River, Tibet Plateau. Science of the Total Environment, 826: 154238, doi: 10.1016/j.scitotenv.2022.154238.
|
|
|
| [51] |
Zhao D, Chen S Y, Chen Y. 2022. Comparative analysis of two typical dust storm processes over East Asia. Journal of Lanzhou University (Natural Science), 58(3): 313-322. (in Chinese)
|
|
|
| [52] |
Zhou C, Yin J Q, Liu Y B. 2019. Effects of wind and rain on the motion of the high-voltage conductor in a simplified valley terrain. Electric Power Systems Research, 173: 153-163.
doi: 10.1016/j.epsr.2019.04.019
|
|
|
|
Viewed |
|
|
|
Full text
|
|
|
|
|
Abstract
|
|
|
|
|
Cited |
|
|
|
|
| |
Shared |
|
|
|
|
| |
Discussed |
|
|
|
|