| Research article |
|


|
|
|
| Spatial distribution and ecological risk of heavy metals and their source apportionment in soils from a typical mining area, Inner Mongolia, China |
XIE Shicheng1,2,3, LAN Tian4, XING An1,2,3, CHEN Chen1,2,3, MENG Chang1,2,3, WANG Shuiping1,2,3, XU Mingming1,2,3, HONG Mei1,2,3,*( ) ) |
1Inner Mongolia Agricultural University, Hohhot 010018, China
2Inner Mongolia Key Laboratory of Soil Quality and Nutrient Resources, Hohhot 010018, China
3Key Laboratory of Agricultural Ecological Security and Green Development at Universities of Inner Mongolia Autonomous Region, Hohhot 010018, China
4School of Environment, Tsinghua University, Beijing 100084, China |
|
|
|
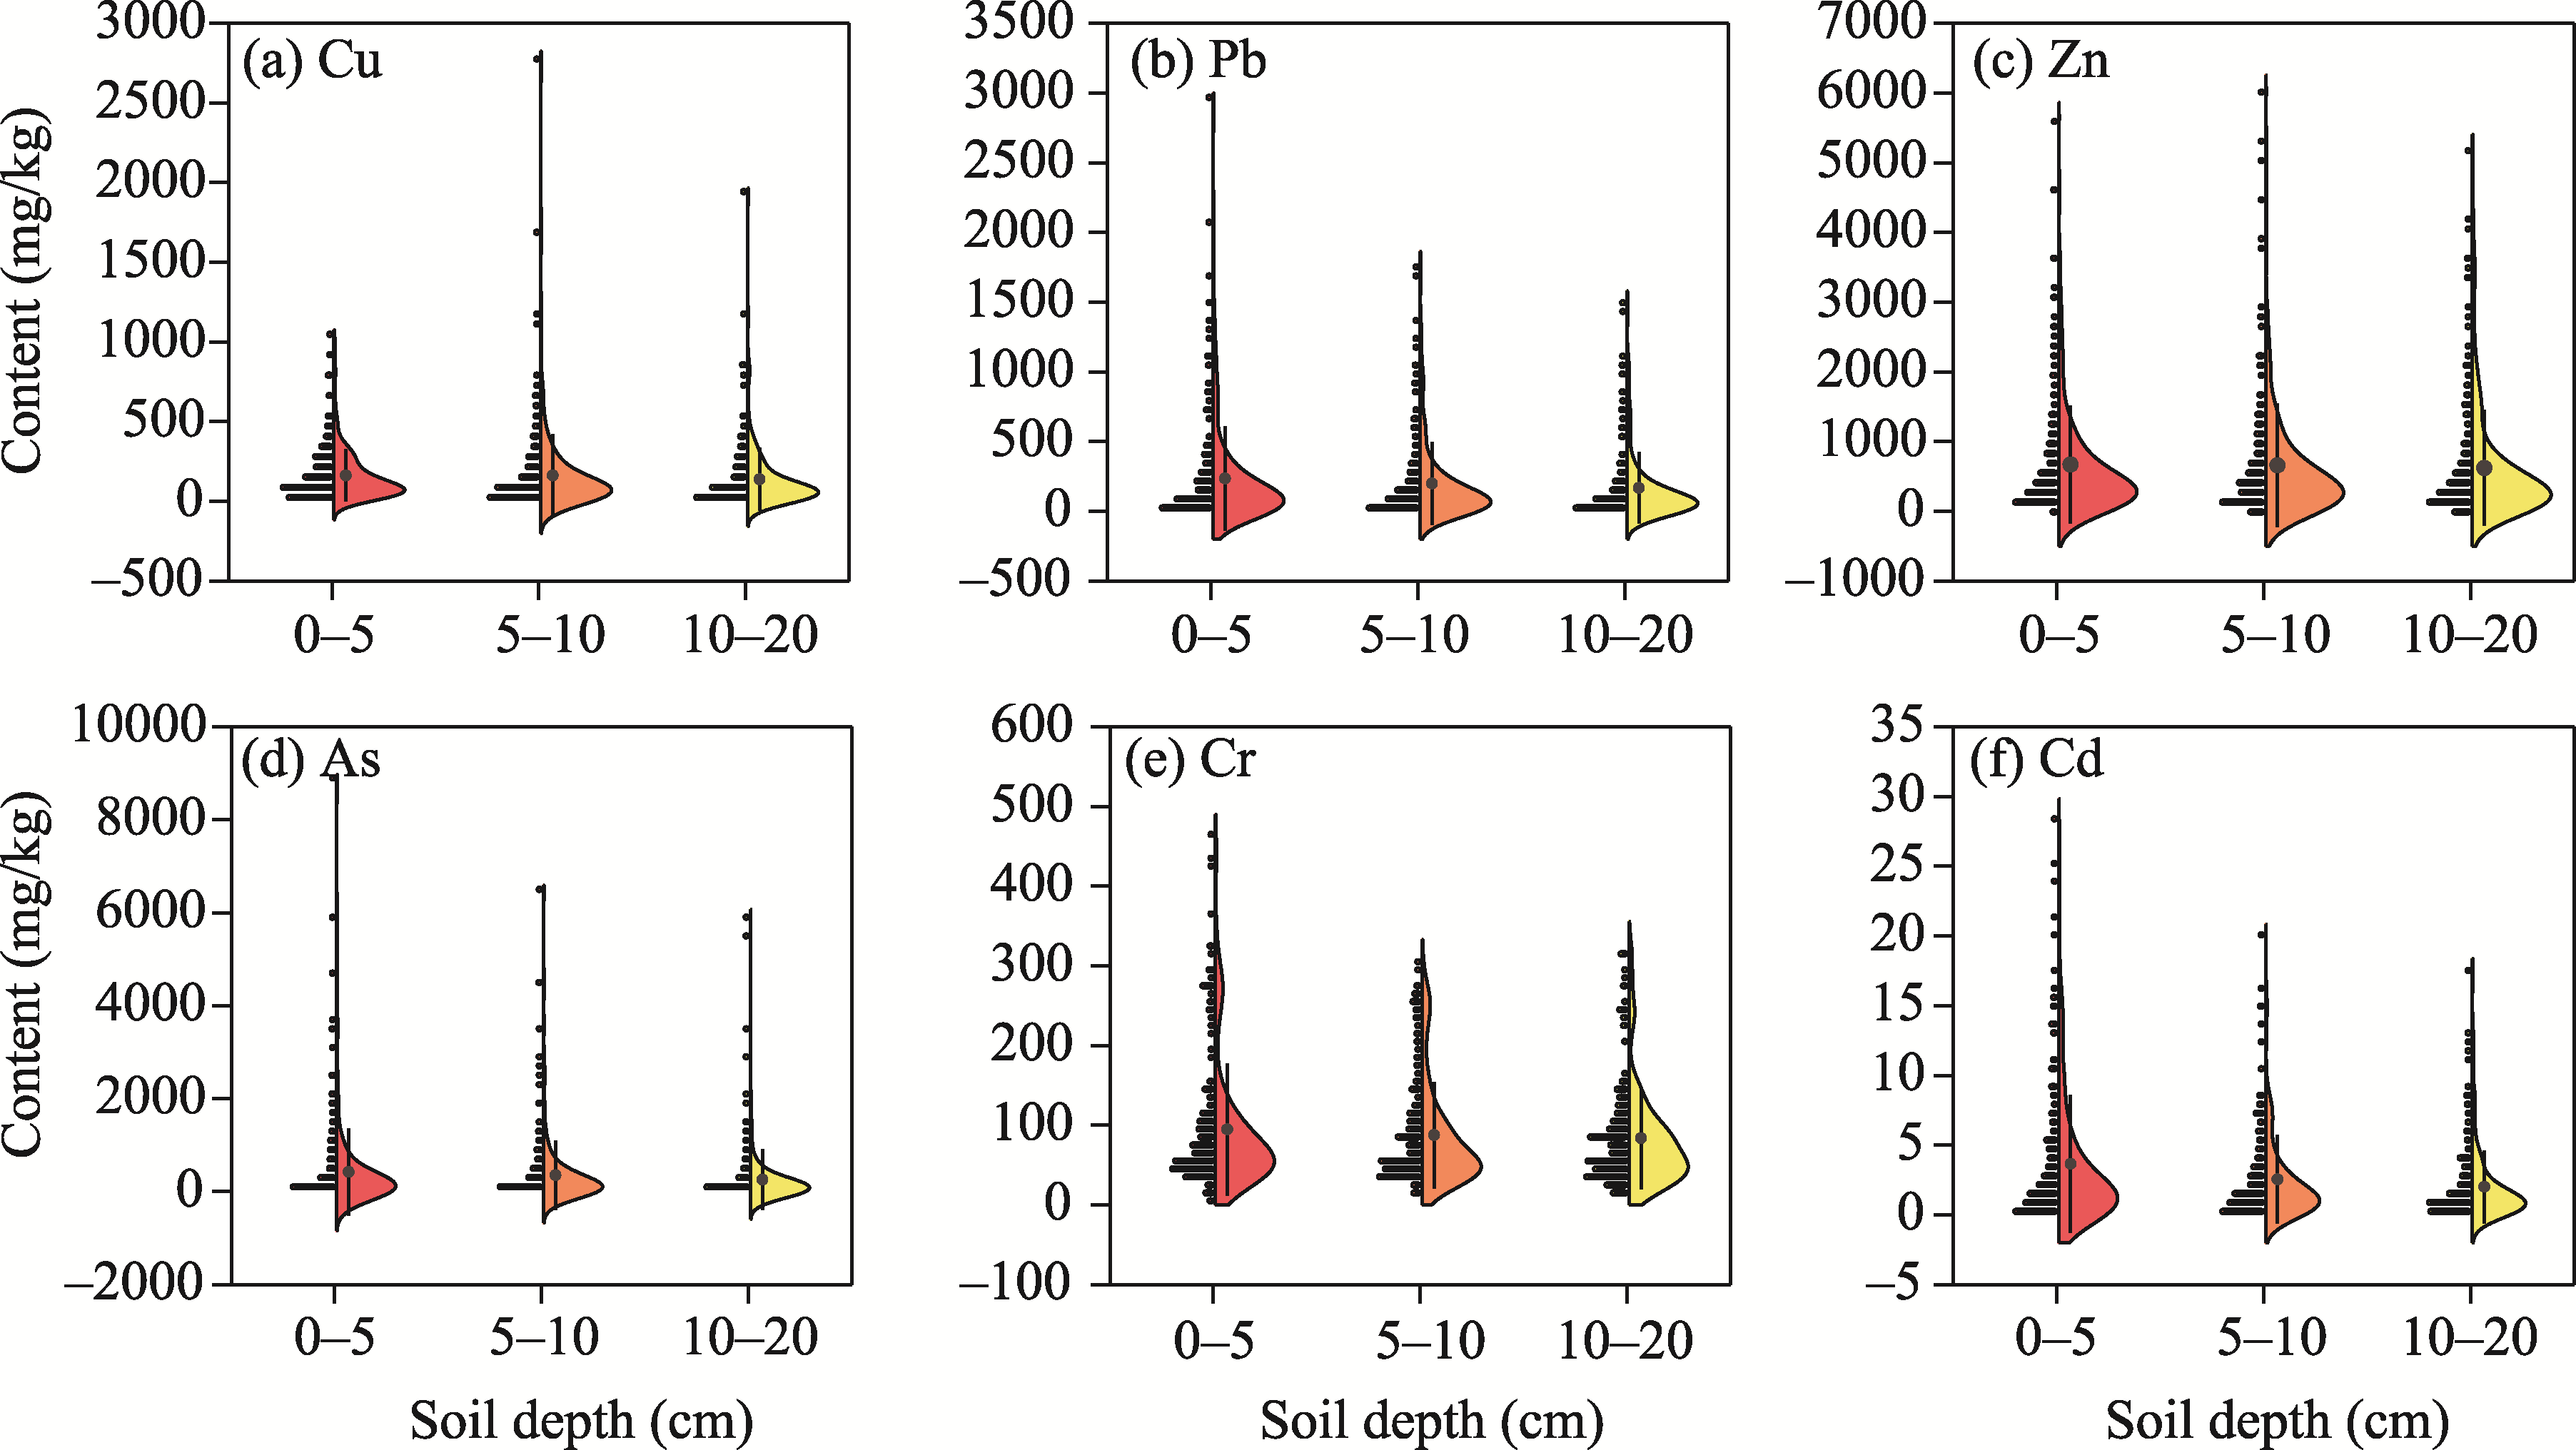
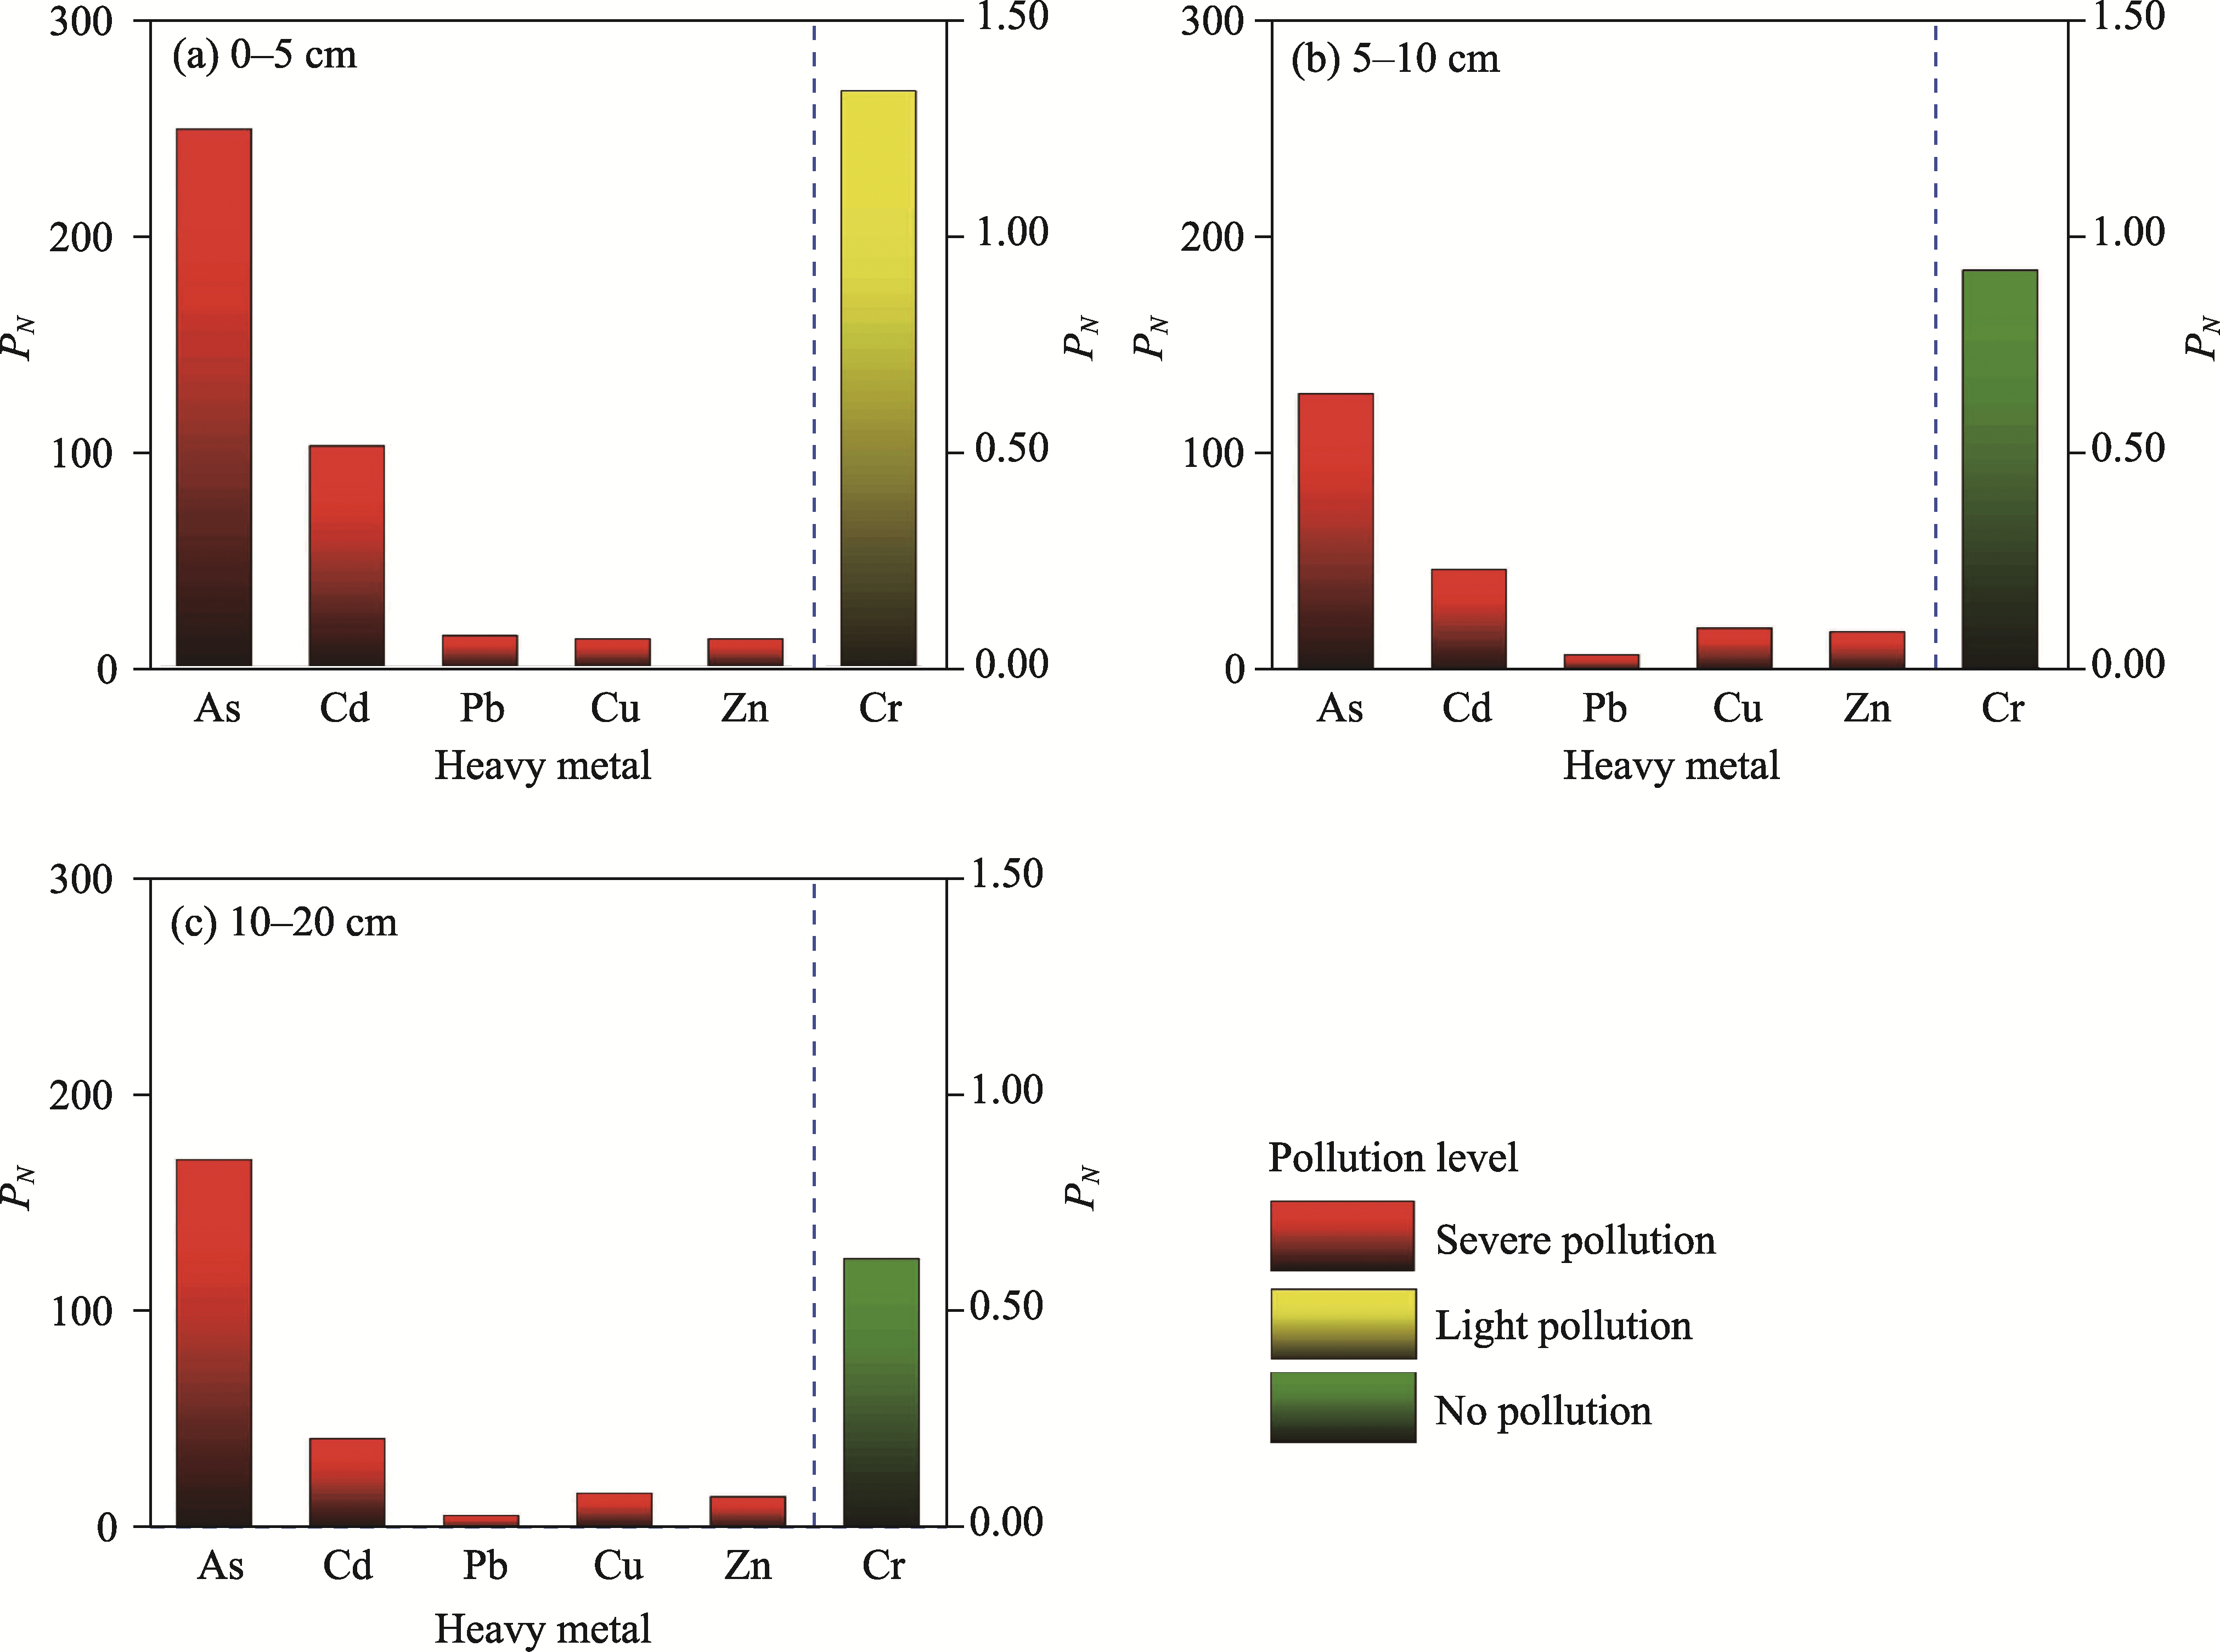
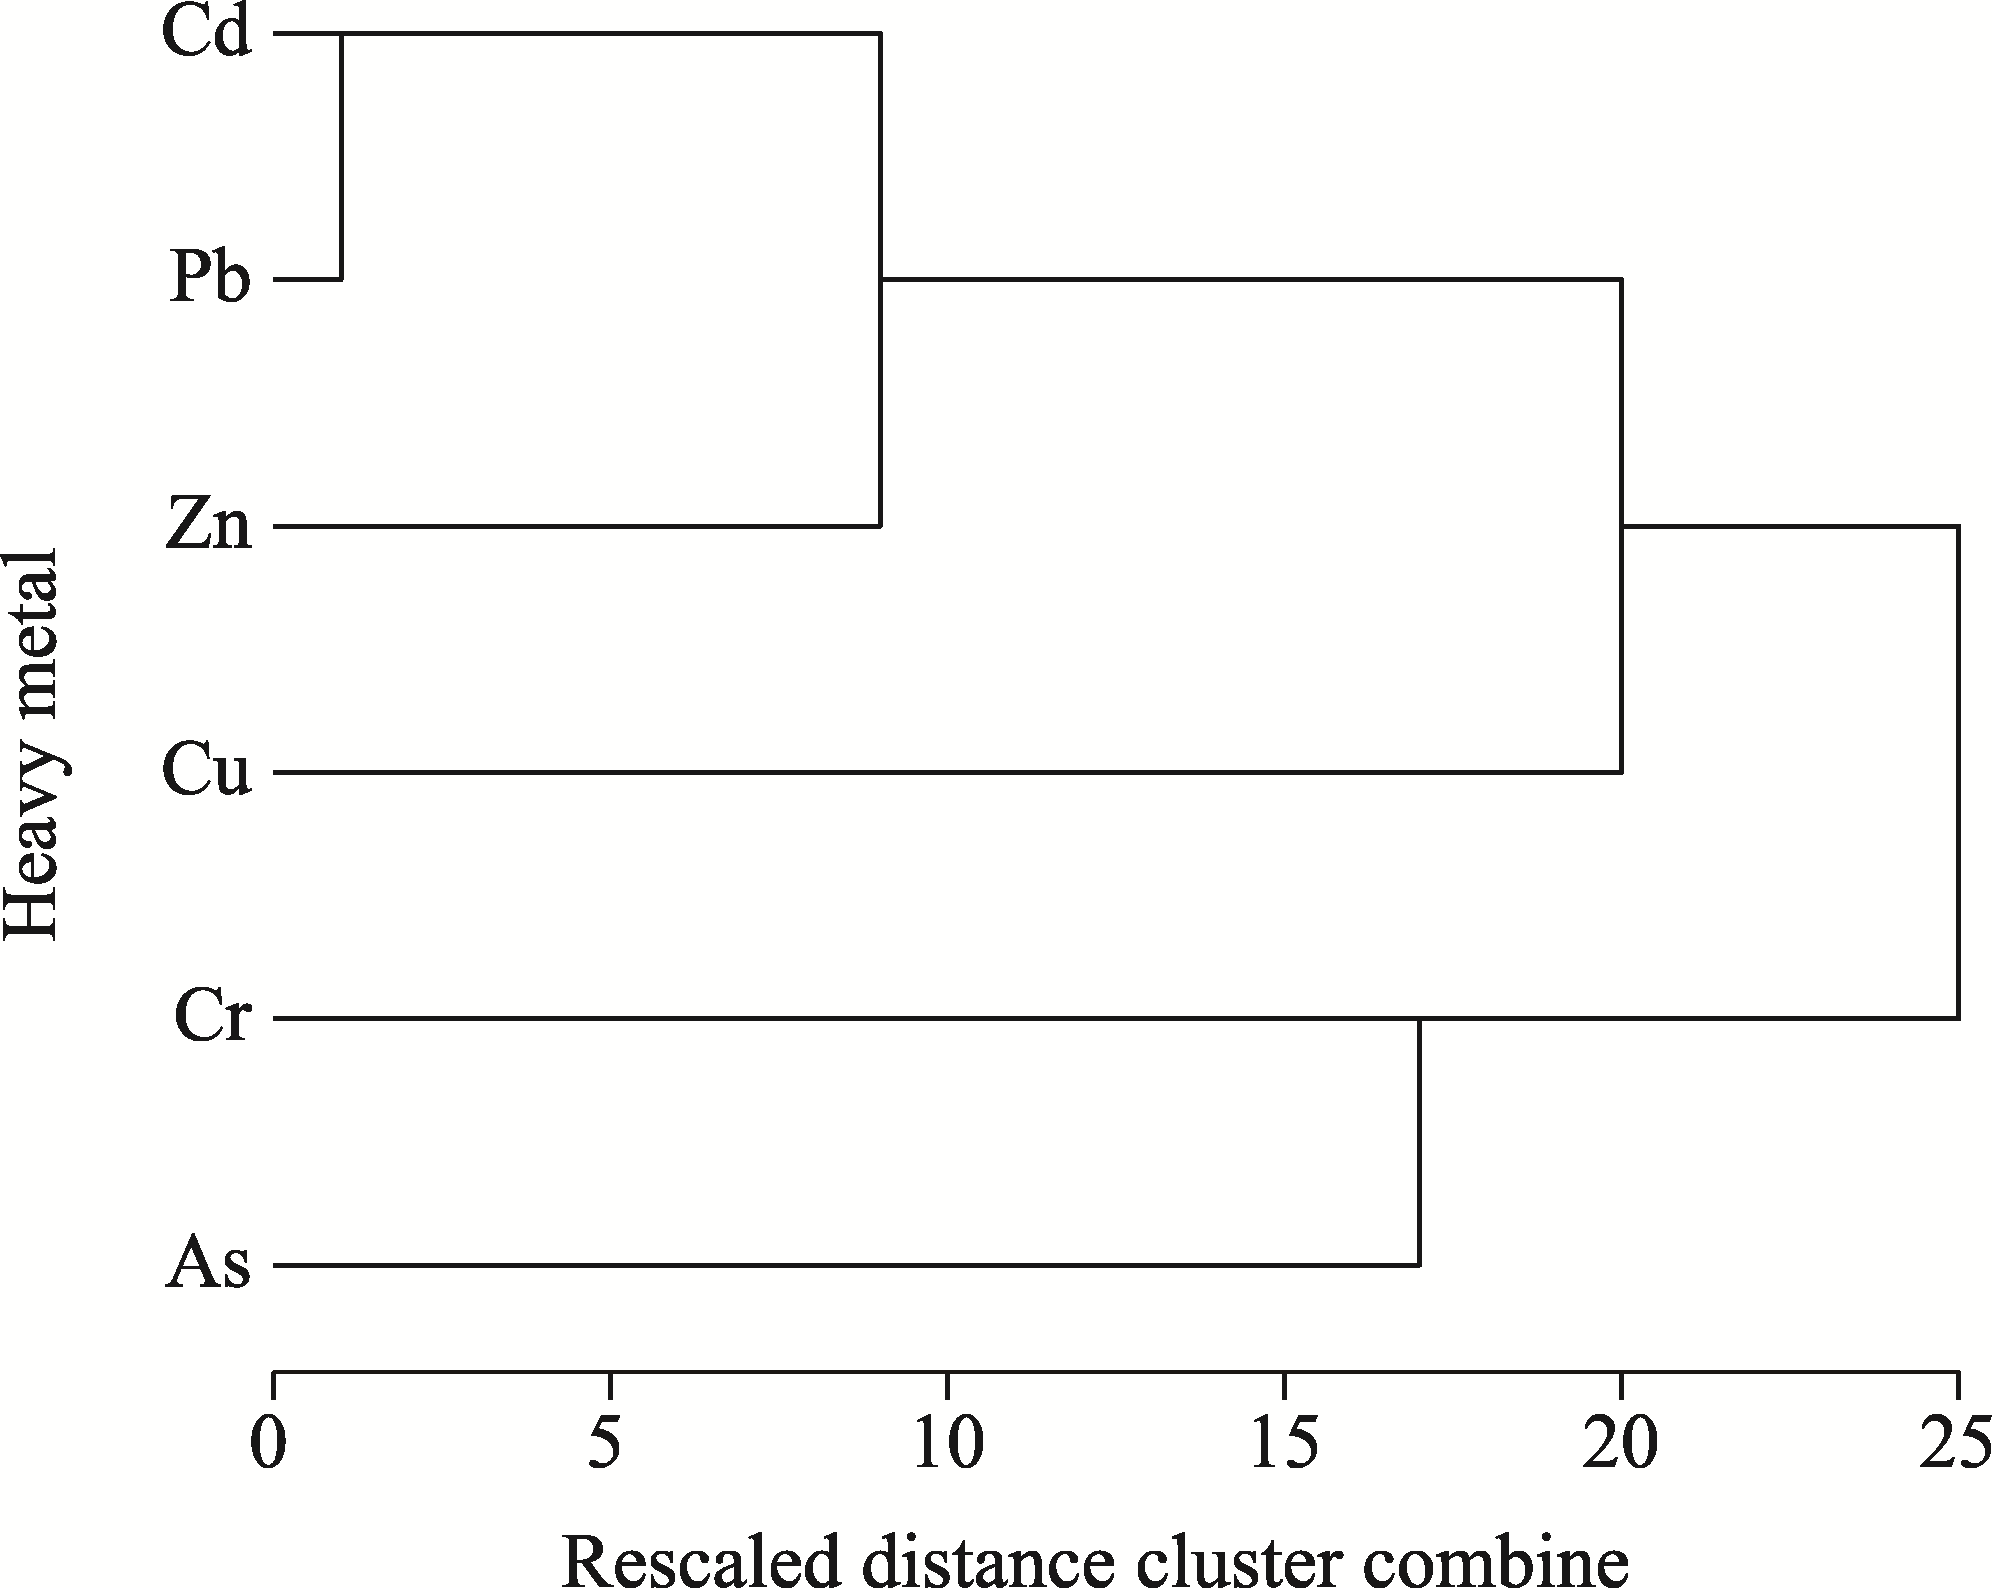
Abstract Determining the distributions and sources of heavy metals in soils and assessing ecological risks are fundamental tasks in the control and management of pollution in mining areas. In this study, we selected 244 sampling sites around a typical lead (Pb) and zinc (Zn) mining area in eastern Inner Mongolia Autonomous Region of China and measured the content of six heavy metals, including cuprum (Cu), Zn, Pb, arsenic (As), cadmium (Cd), and chromium (Cr). The ecological risk of heavy metals was comprehensively evaluated using the Geo-accumulation index, Nemerow general pollution index, and potential ecological risk index. The heavy metals were traced using correlation analysis and principal component analysis. The results showed that the highest content of heavy metals was found in 0-5 cm soil layer in the study area. The average content of Zn, As, Pb, Cu, Cr, and Cd was 670, 424, 235, 162, 94, and 4 mg/kg, respectively, all exceeding the risk screening value of agricultural soil in China. The areas with high content of soil heavy metals were mainly distributed near the tailings pond. The study area was affected by a combination of multiple heavy metals, with Cd and As reaching severe pollution levels. The three pathways of exposure for carcinogenic and noncarcinogenic risks were ranked as inhalation>oral ingestion>dermal absorption. The heavy metals in the study area posed certain hazards to human health. Specifically, oral ingestion of these heavy metals carried carcinogenic risks for both children and adults, as well as noncarcinogenic risks for children. There were differences in the sources of different heavy metals. The tailings pond had a large impact on the accumulation of Cd, Zn, and Pb. The source of Cr was the soil parent material, the source of As was mainly the soil matrix, and the source of Cu was mainly the nearby Cu ore. The purpose of this study is to more accurately understand the extent, scope, and source of heavy metals pollution near a typical mining area, providing effective help to solve the problem of heavy metals pollution.
|
|
Received: 20 March 2023
Published: 31 October 2023
|
|
Corresponding Authors:
*HONG Mei (E-mail: nmczhm1970@126.com)
|
| Cite this article:
XIE Shicheng, LAN Tian, XING An, CHEN Chen, MENG Chang, WANG Shuiping, XU Mingming, HONG Mei. Spatial distribution and ecological risk of heavy metals and their source apportionment in soils from a typical mining area, Inner Mongolia, China. Journal of Arid Land, 2023, 15(10): 1196-1215.
URL:
http://jal.xjegi.com/10.1007/s40333-023-0109-1 OR http://jal.xjegi.com/Y2023/V15/I10/1196
|
|
|
| [1] |
Cheng X F, Danek T, Drozdova J, et al. 2018. Soil heavy metal pollution and risk assessment associated with the Zn-Pb mining region in Yunnan, Southwest China. Environmental Monitoring and Assessment, 190: 194, doi: 10.1007/s10661-018-6574-x.
pmid: 29516193
|
|
|
| [2] |
Chun F, Na R, Zhang W, et al. 2021. Spatial heterogeneity of soil heavy metal content in Baiyinhua mining area, Inner Mongolia, China. The Journal of Applied Ecology, 32(2): 601-608.
|
|
|
| [3] |
Din I U, Muhammad S, Rehman I U. 2022. Heavy metal(loid)s contaminations in soils of Pakistan: A review for the evaluation of human and ecological risks assessment and spatial distribution. Environmental Geochemistry and Health, 45(5): 1991-2012.
doi: 10.1007/s10653-022-01312-x
pmid: 35759076
|
|
|
| [4] |
Dong B, Zhang R Z, Gan Y D, et al. 2019. Multiple methods for the identification of heavy metal sources in cropland soils from a resource-based region. Science of the Total Environment, 651(2): 3127-3138.
doi: 10.1016/j.scitotenv.2018.10.130
|
|
|
| [5] |
Du B Y, Zhou J, Lu B X, et al. 2020. Environmental and human health risks from cadmium exposure near an active lead-zinc mine and a copper smelter, China. Science of the Total Environment, 720, doi: 10.1016/j.scitotenv.2020.137585.
|
|
|
| [6] |
Fei X F, Xiao R, Christakos G, et al. 2019. Comprehensive assessment and source apportionment of heavy metals in Shanghai agricultural soils with different fertility levels. Ecological Indicators, 106, doi: 10.1016/j.ecolind.2019.105508.
|
|
|
| [7] |
Gao C Y, Lin Q X, Bao K S, et al. 2014. Historical variation and recent ecological risk of heavy metals in wetland sediments along Wusuli River, Northeast China. Environmental Earth Sciences, 72(11): 4345-4355.
doi: 10.1007/s12665-014-3334-2
|
|
|
| [8] |
Gao Y F, Liu H L, Liu G X. 2017. The spatial distribution and accumulation characteristics of heavy metals in steppe soils around three mining areas in Xilinhot in Inner Mongolia, China. Environmental Science and Pollution Research, 24(32): 25416-25430.
doi: 10.1007/s11356-017-0113-0
|
|
|
| [9] |
Hakanson L. 1980. An ecological risk index for aquatic pollution control. A sedimentological approach. Water Research, 14(8): 975-1001.
doi: 10.1016/0043-1354(80)90143-8
|
|
|
| [10] |
Hu Z G, Wang C S, Li K Q, et al. 2018. Distribution characteristics and pollution assessment of soil heavy metals over a typical nonferrous metal mine area in Chifeng, Inner Mongolia, China. Environmental Earth Sciences, 77(18): 1, doi: 10.1007/s12665-018-7771-1.
|
|
|
| [11] |
Inka R, Helinä H. 2016. Oxidation mechanisms and chemical bioavailability of chromium in agricultural soil-pH as the master variable. Applied Geochemistry, 74: 84-93.
doi: 10.1016/j.apgeochem.2016.08.017
|
|
|
| [12] |
Li L M, Wu J, Lu J, et al. 2018. Distribution, pollution, bioaccumulation, and ecological risks of trace elements in soils of the northeastern Qinghai-Tibet Plateau. Ecotoxicology and Environmental Safety, 166(1): 345-353.
doi: 10.1016/j.ecoenv.2018.09.110
|
|
|
| [13] |
Li X L, Yang J X, Fan Y F, et al. 2021. Rapid monitoring of heavy metal pollution in lake water using nitrogen and phosphorus nutrients and physicochemical indicators by support vector machine. Chemosphere, 280: 130599, doi: 10.1016/j.chemosphere.2021.130599.
|
|
|
| [14] |
Li Y J, Li P J, Yang G F, et al. 2003. Diagnosis of heavy metal contaminated soil toxicity by the daphnia magna method. Journal of Agricultural Environmental Science, 22(2): 159-162. (in Chinese)
|
|
|
| [15] |
Liang J, Feng C T, Zeng G M, et al. 2017. Spatial distribution and source identification of heavy metals in surface soils in a typical coal mine city, Lianyuan, China. Environmental Pollution, 225(17): 681-690.
doi: 10.1016/j.envpol.2017.03.057
|
|
|
| [16] |
Liu F, Yang Z, Yang R H, et al. 2022. Migration characteristics and potential ecological environment evaluation of metal elements in surface soil. KSCE Journal of Civil Engineering, 26(5): 2068-2076.
doi: 10.1007/s12205-022-1422-5
|
|
|
| [17] |
Liu H W, Zhang Y, Yang J S, et al. 2021. Quantitative source apportionment, risk assessment and distribution of heavy metals in agricultural soils from southern Shandong Peninsula of China. Science of The Total Environment, 767: 144879, doi: 10.1016/j.scitotenv.2020.144879.
|
|
|
| [18] |
Liu R P, Xu Y N, Zhang J H, et al. 2020. Effects of heavy metal pollution on farmland soils and crops: A case study of the Xiaoqinling Gold Belt, China. China Geology, 3(3): 402-410.
|
|
|
| [19] |
Liu S Y, Tian S H, Li K X, et al. 2018. Heavy metal bioaccessibility and health risks in the contaminated soil of an abandoned, small-scale lead and zinc mine. Environmental Science & Pollution Research, 25(15): 15044-15056.
|
|
|
| [20] |
Liu Y X, Wu L B, Dong H J. 2019. Analysis of heavy metal pollution in urban surface soil based on the optimized N. L. Nemerow model. International Journal of Economics, Business and Management Research, 3(6): 126-141.
|
|
|
| [21] |
Loska K, Wiechuła D, Korus I. 2004. Metal contamination of farming soils affected by industry. Environment International, 30(2): 159-165.
pmid: 14749104
|
|
|
| [22] |
Ma L, Sun J, Yang Z G, et al. 2015. Heavy metal contamination of agricultural soils affected by mining activities around the Ganxi River in Chenzhou, Southern China. Environmental Monitoring and Assessment, 187(12): 1-23.
doi: 10.1007/s10661-014-4167-x
|
|
|
| [23] |
Ministry of Ecology and Environment of the People's Republic of China, 2018. Soil environmental quality—risk control standard for soil contamination of agricultural land (GB 15618-2018). [2023-01-10]. http://s.dic.cool/S/6M2ZGrGf.
|
|
|
| [24] |
Muhammad H S, Shafaqat A, Muzammal R, et al. 2020. Influence of phosphorus on copper phytoextraction via modulating cellular organelles in two jute (Corchorus capsularis L.) varieties grown in a copper mining soil of Hubei Province, China. Chemosphere, 248: 126032, doi: 10.1016/j.chemosphere.2020.126032.
|
|
|
| [25] |
Muhammad S, Usman Q A. 2021. Heavy metal contamination in water of Indus River and its tributaries, Northern Pakistan: Evaluation for potential risk and source apportionment. Toxin Reviews, doi: 10.1080/15569543.2021.1882499.
|
|
|
| [26] |
Muhammad S. 2022. Evaluation of heavy metals in water and sediments, pollution, and risk indices of Naltar Lakes, Pakistan. Environmental Science and Pollution Research, 30(10): 28217-28226.
doi: 10.1007/s11356-022-24160-9
|
|
|
| [27] |
Müller G. 1969. Index of geoaccumulation in sediments of the Rhine River. GeoJournal, 2: 108-118.
|
|
|
| [28] |
Nezat C A, Hatch S A, Uecker T. 2017. Heavy metal content in urban residential and park soils: A case study in Spokane, Washington, USA. Applied Geochemistry, 78(1): 186-193.
|
|
|
| [29] |
Sehrish A, Muhammad S, Fatima H. 2021. Evaluation and risks assessment of potentially toxic elements in water and sediment of the Dor River and its tributaries, Northern Pakistan. Environmental Technology & Innovation, 21: 101333, doi: 10.1016/j.eti.2020.101333.
|
|
|
| [30] |
Shi T R, Zhang Y Y, Gong Y W, et al. 2019. Status of cadmium accumulation in agricultural soils across China (1975-2016): From temporal and spatial variations to risk assessment. Chemosphere, 230: 136-143.
doi: S0045-6535(19)30871-9
pmid: 31103859
|
|
|
| [31] |
Song S, Li Y J, Li L, et al. 2018. Arsenic and heavy metal accumulation and risk assessment in soils around mining areas: The Urad Houqi area in arid Northwest China as an example. International Journal of Environmental Research and Public Health, 15(11): 2410, doi: 10.3390/ijerph15112410.
|
|
|
| [32] |
Sun L, Guo D K, Liu K, et al. 2019. Levels, sources, and spatial distribution of heavy metals in soils from a typical coal industrial city of Tangshan, China. CATENA, 175: 101-109.
doi: 10.1016/j.catena.2018.12.014
|
|
|
| [33] |
Sun Y Y, Zhao Z G, Liu X, et al. 2017. Environmental risk assessment of heavy metal contaminated soil in a concentrated nonferrous metal mining area in western Inner Mongolia. Journal of Inner Mongolia Normal University, 46(6): 853-860. (in Chinese)
|
|
|
| [34] |
U.S. Environmental Protection Agency. 2011. Exposure Factors Handbook. [2023-01-10]. http://refhub.elsevier.com/S0045-6535(23)01415-7/sref90.
|
|
|
| [35] |
Wang C, Yang Z F, Zhong C, et al. 2016. Temporal-spatial variation and source apportionment of soil heavy metals in the representative river-alluviation depositional system. Environmental Pollution, 216(16): 18-26.
doi: 10.1016/j.envpol.2016.05.037
|
|
|
| [36] |
Wang D L, Wang L, Liu J S, et al. 2018. Grassland ecology in China: Perspectives and challenges. Frontiers of Agricultural Science and Engineering, 5(1): 24-43.
doi: 10.15302/J-FASE-2018205
|
|
|
| [37] |
Wei X D, Zhou Y T, Jiang Y J, et al. 2020. Health risks of metal(loid)s in maize (Zea mays L.) in an artisanal zinc smelting zone and source fingerprinting by lead isotope. Science of The Total Environment, 742: 140321, doi: 10.1016/j.scitotenv.2020.140321.
|
|
|
| [38] |
Xu L, Cui H B, Zheng X B, et al. 2017. Changes in the heavy metal distributions in whole soil and aggregates affected by the application of alkaline materials and phytoremediation. RSC Advances, 7(65): 41033-41042.
doi: 10.1039/C7RA05670B
|
|
|
| [39] |
Young B, Ingwersen W W, Bergmann M, et al. 2022. A system for standardizing and combining U.S. environmental protection agency emissions and waste inventory data. Applied Sciences, 12(7): 1-16.
doi: 10.3390/app12010001
|
|
|
| [40] |
Yang F, Xie S Y, Hao Z H, et al. 2022. Geochemical quantitative assessment of mineral resource potential in the Da Hinggan Mountains in Inner Mongolia, China. Minerals, 12(4): 434, doi: 10.3390/min12040434.
|
|
|
| [41] |
Zhao X Q, Huang J, Zhu X Y, et al. 2021. Ecological effects of heavy metal pollution on soil microbial community structure and diversity on both sides of a river around a mining area. International Journal of Environmental Research and Public Health, 17(16): 5680, doi: 10.3390/ijerph17165680.
|
|
|
| [42] |
Zhou Y Z, Wang Y, Zeng H, et al. 2015. Spatial heterogeneity and pollution characteristics of heavy metals in Inner Mongolian soils. Journal of Ecology and Environment, 24(8): 1381-1387. (in Chinese)
|
|
|
|
Viewed |
|
|
|
Full text
|
|
|
|
|
Abstract
|
|
|
|
|
Cited |
|
|
|
|
| |
Shared |
|
|
|
|
| |
Discussed |
|
|
|
|