| Research article |
|


|
|
|
| Spatiotemporal variation of surface albedo and its influencing factors in northern Xinjiang, China |
YUAN Shuai1,2, LIU Yongqiang1,2,*( ), QIN Yan1,2, ZHANG Kun1,2 ), QIN Yan1,2, ZHANG Kun1,2 |
1College of Geography and Remote Sensing Sciences, Xinjiang University, Urumqi 830046, China
2Xinjiang Key Laboratory of Oasis Ecology, Xinjiang University, Urumqi 830046, China |
|
|
|
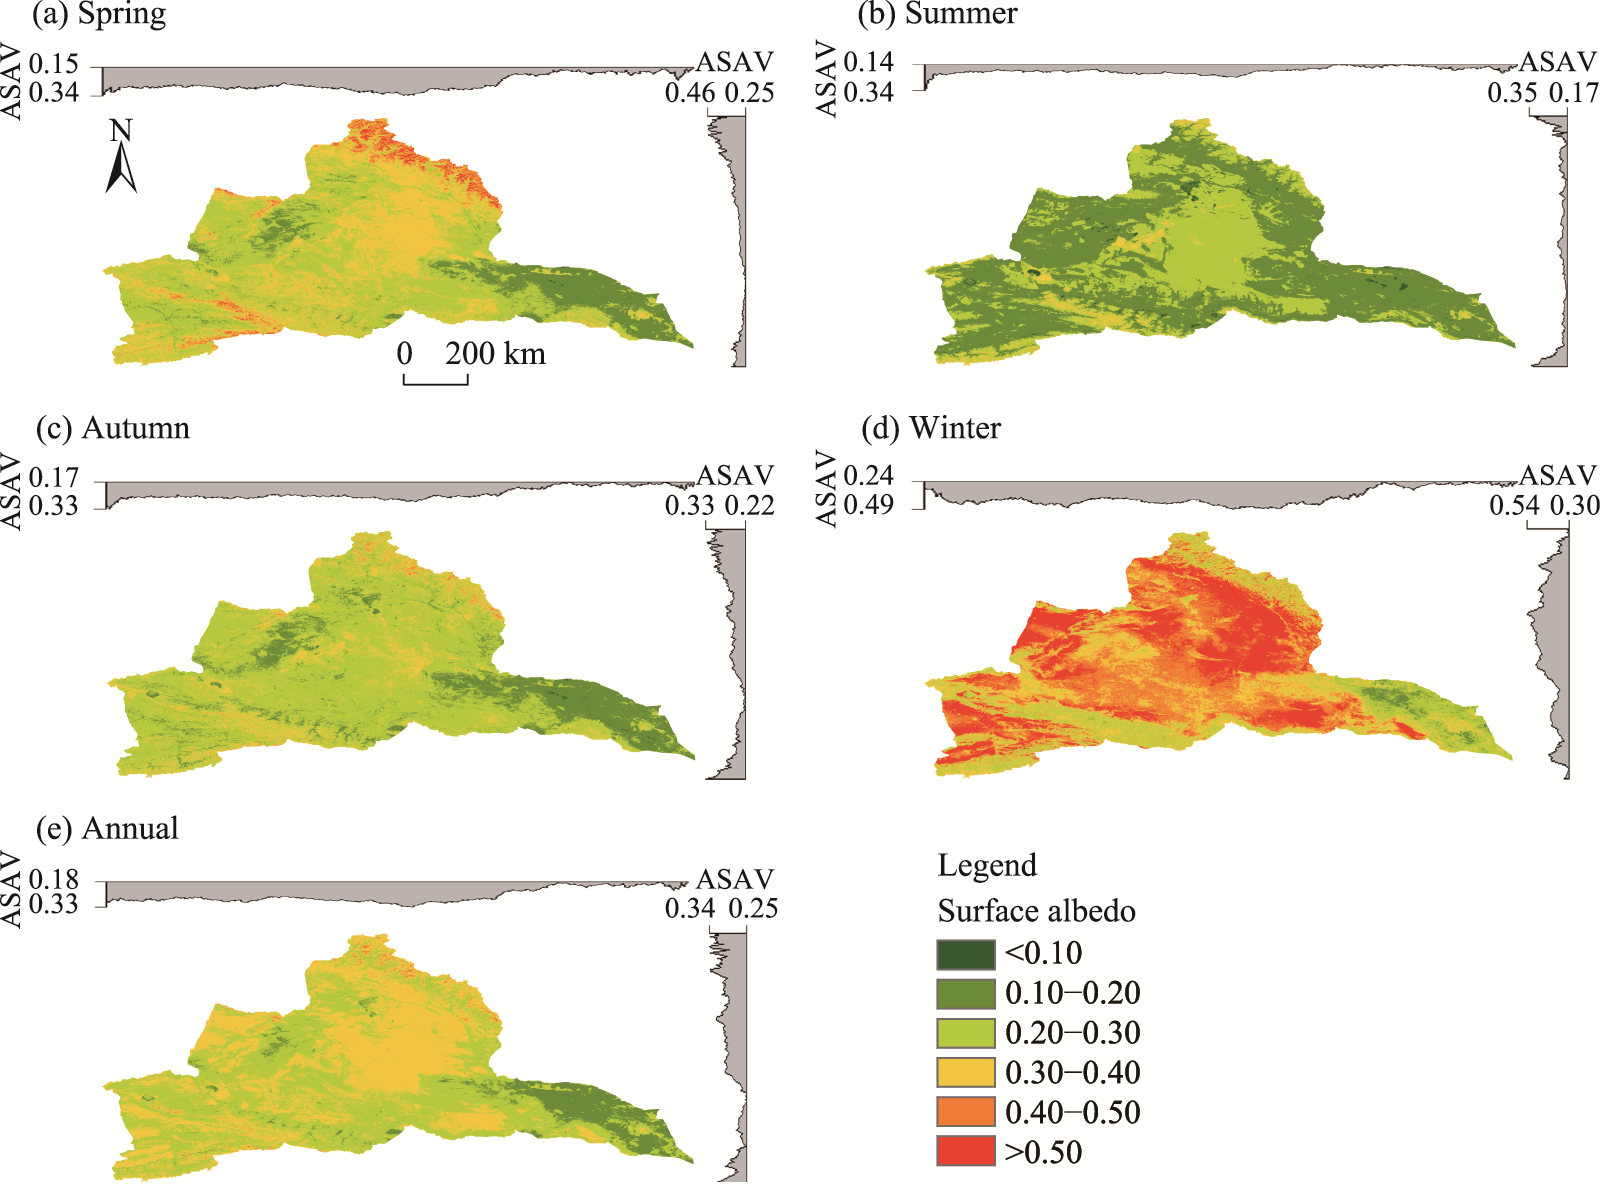
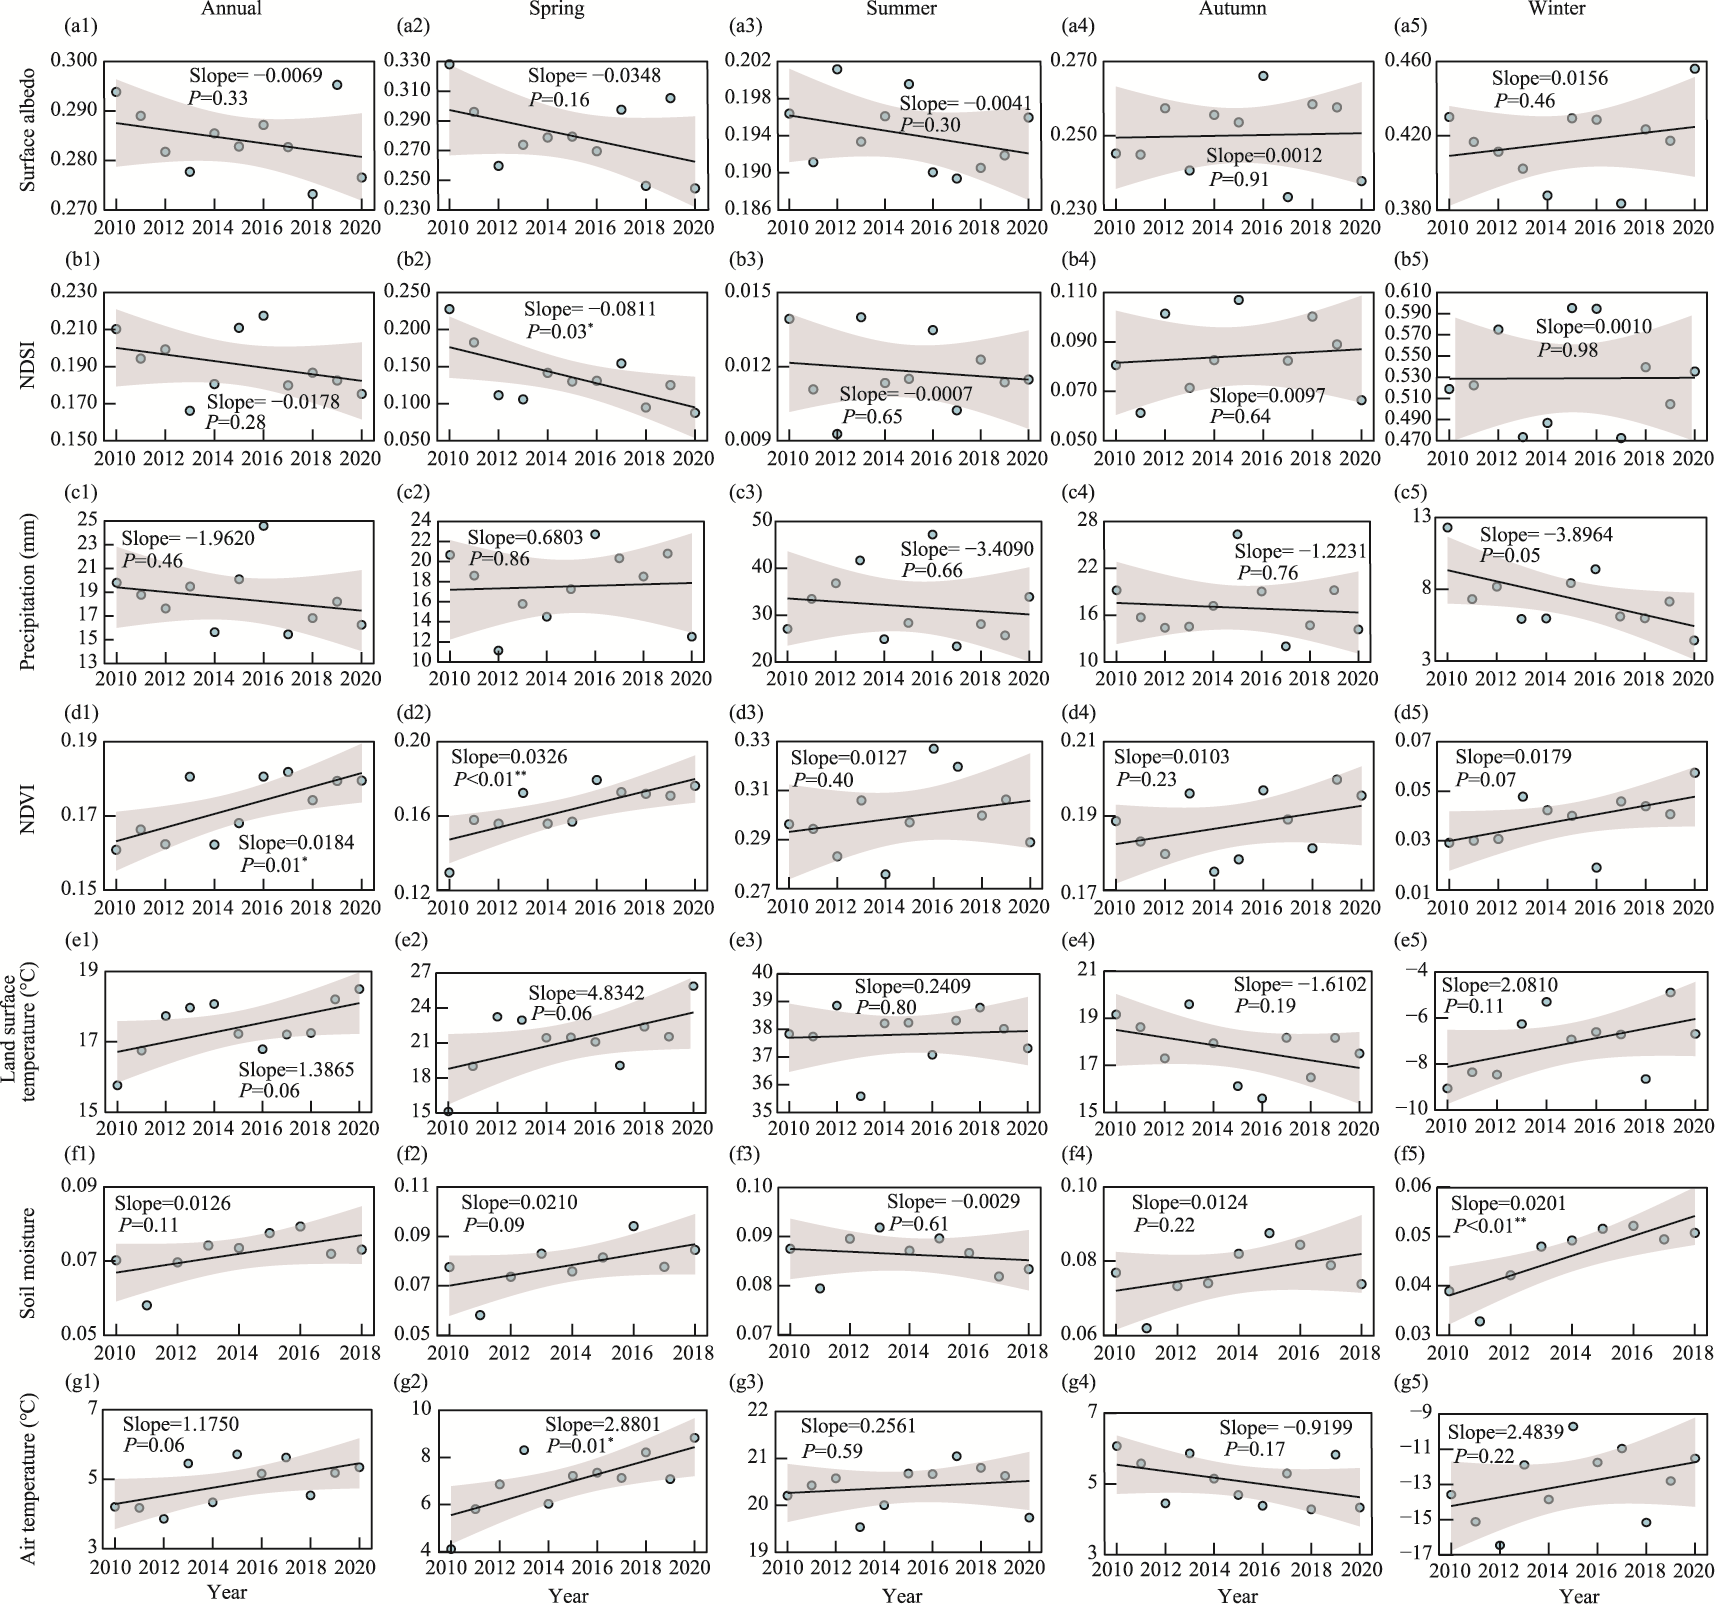
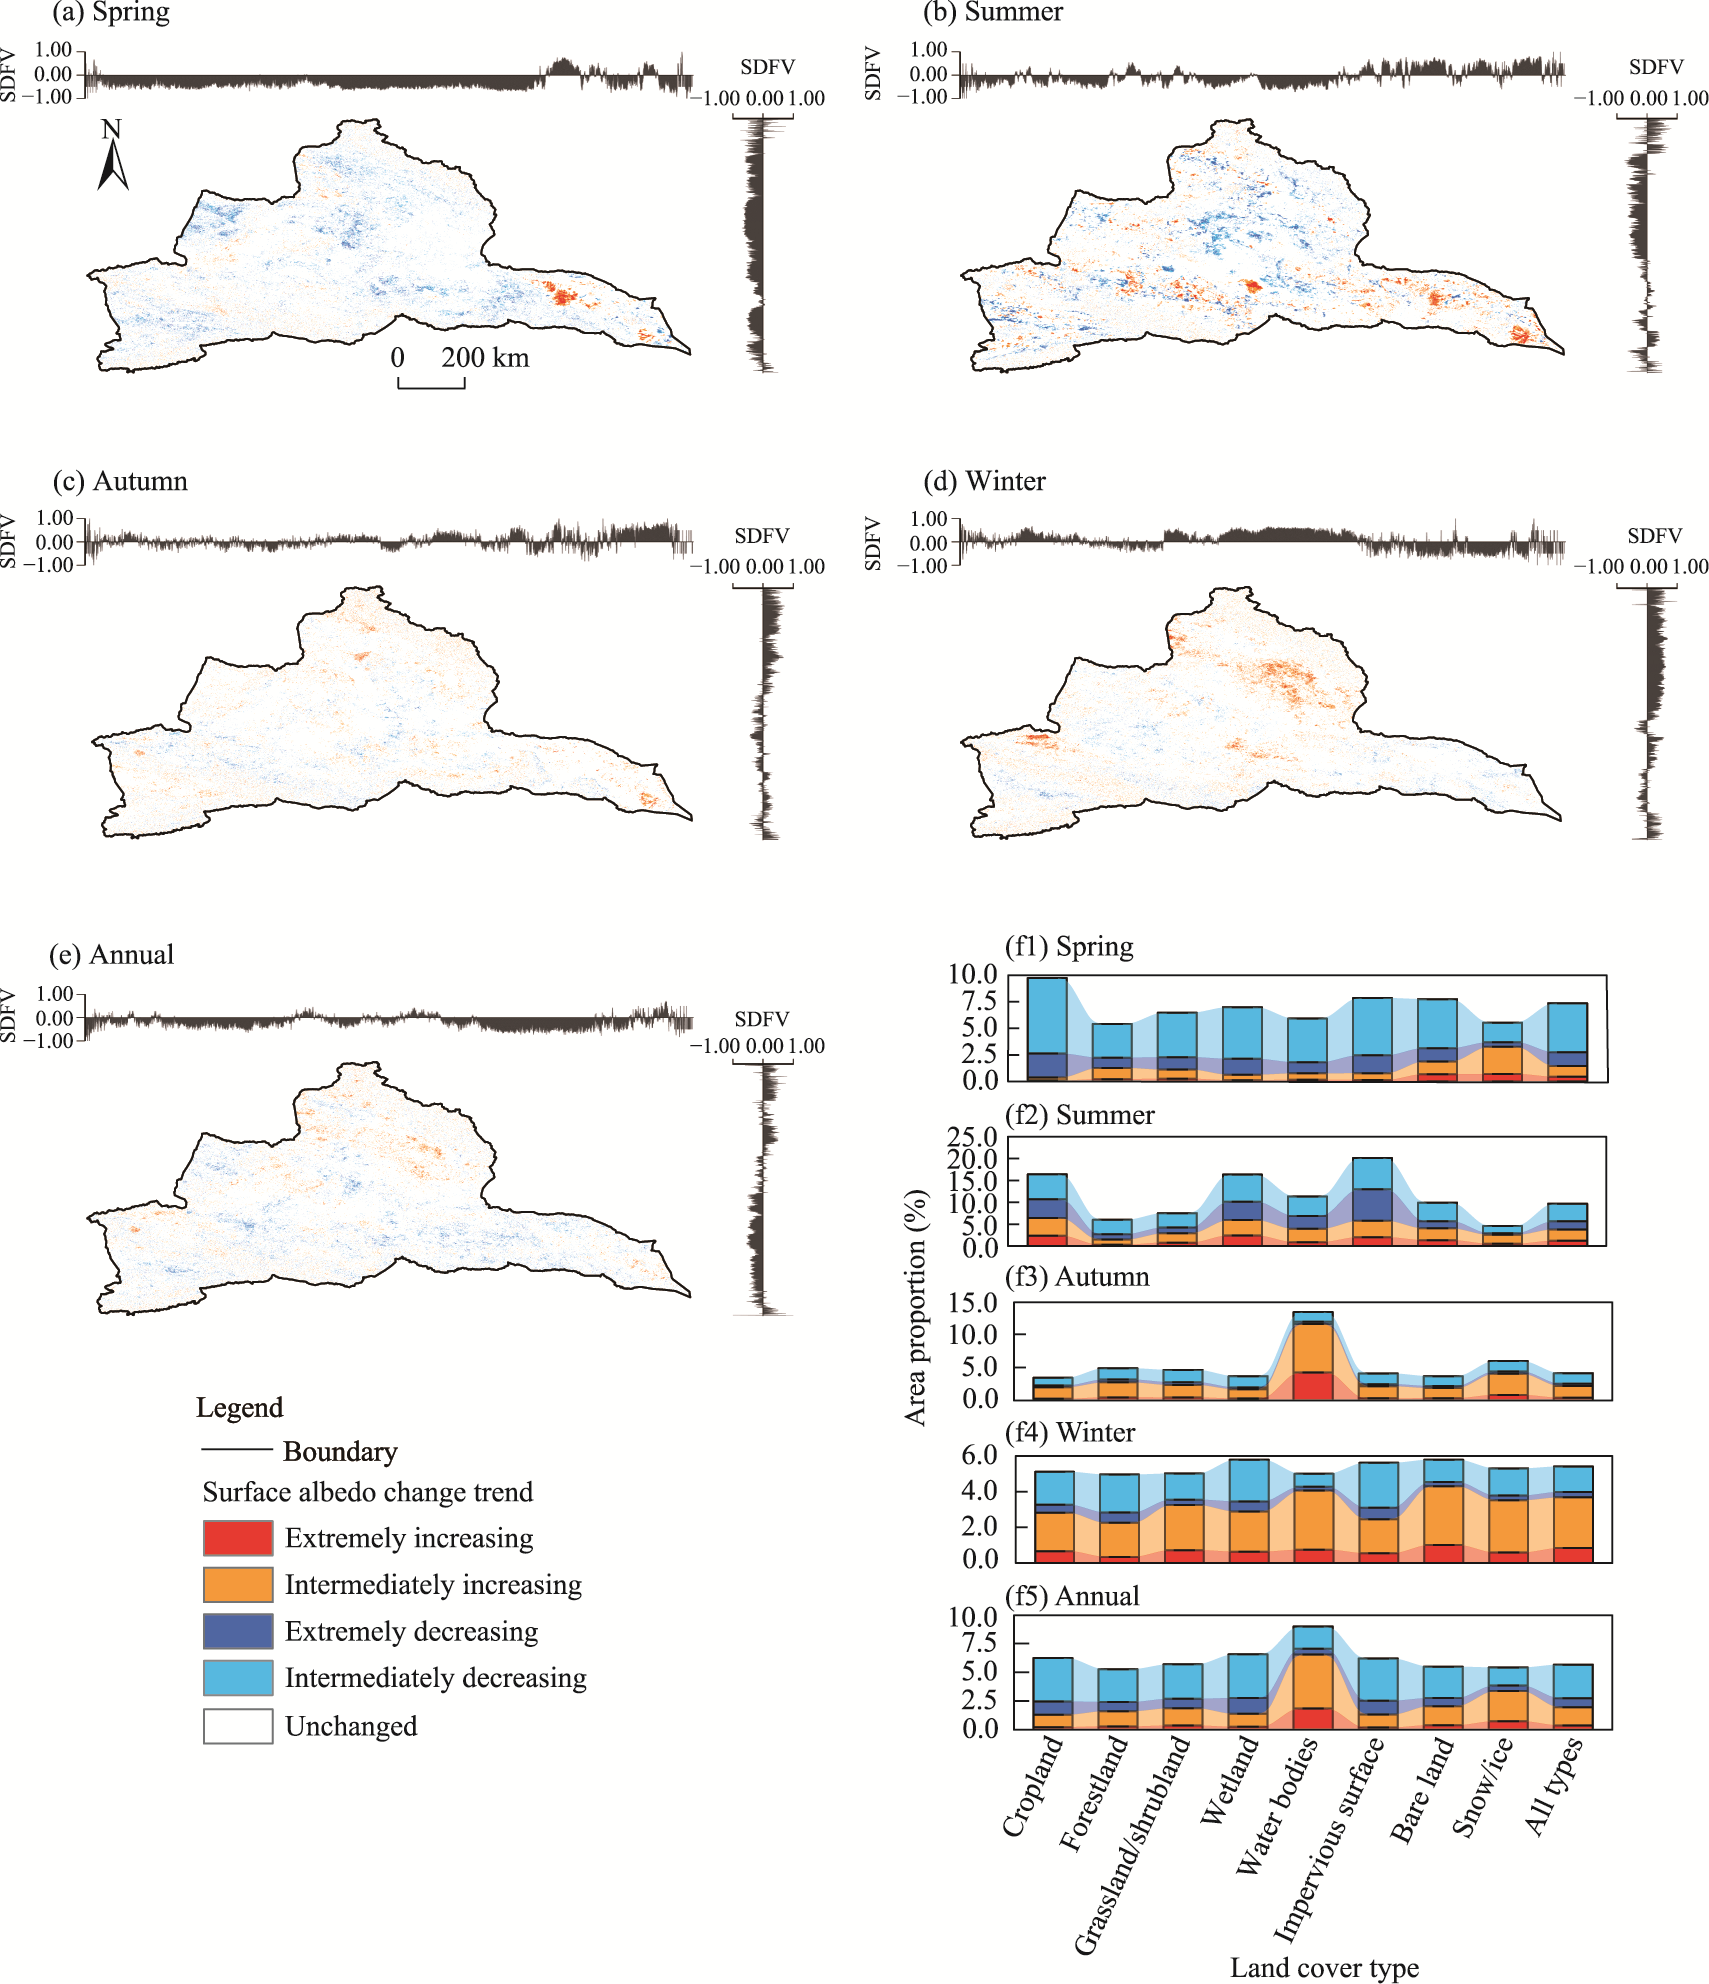
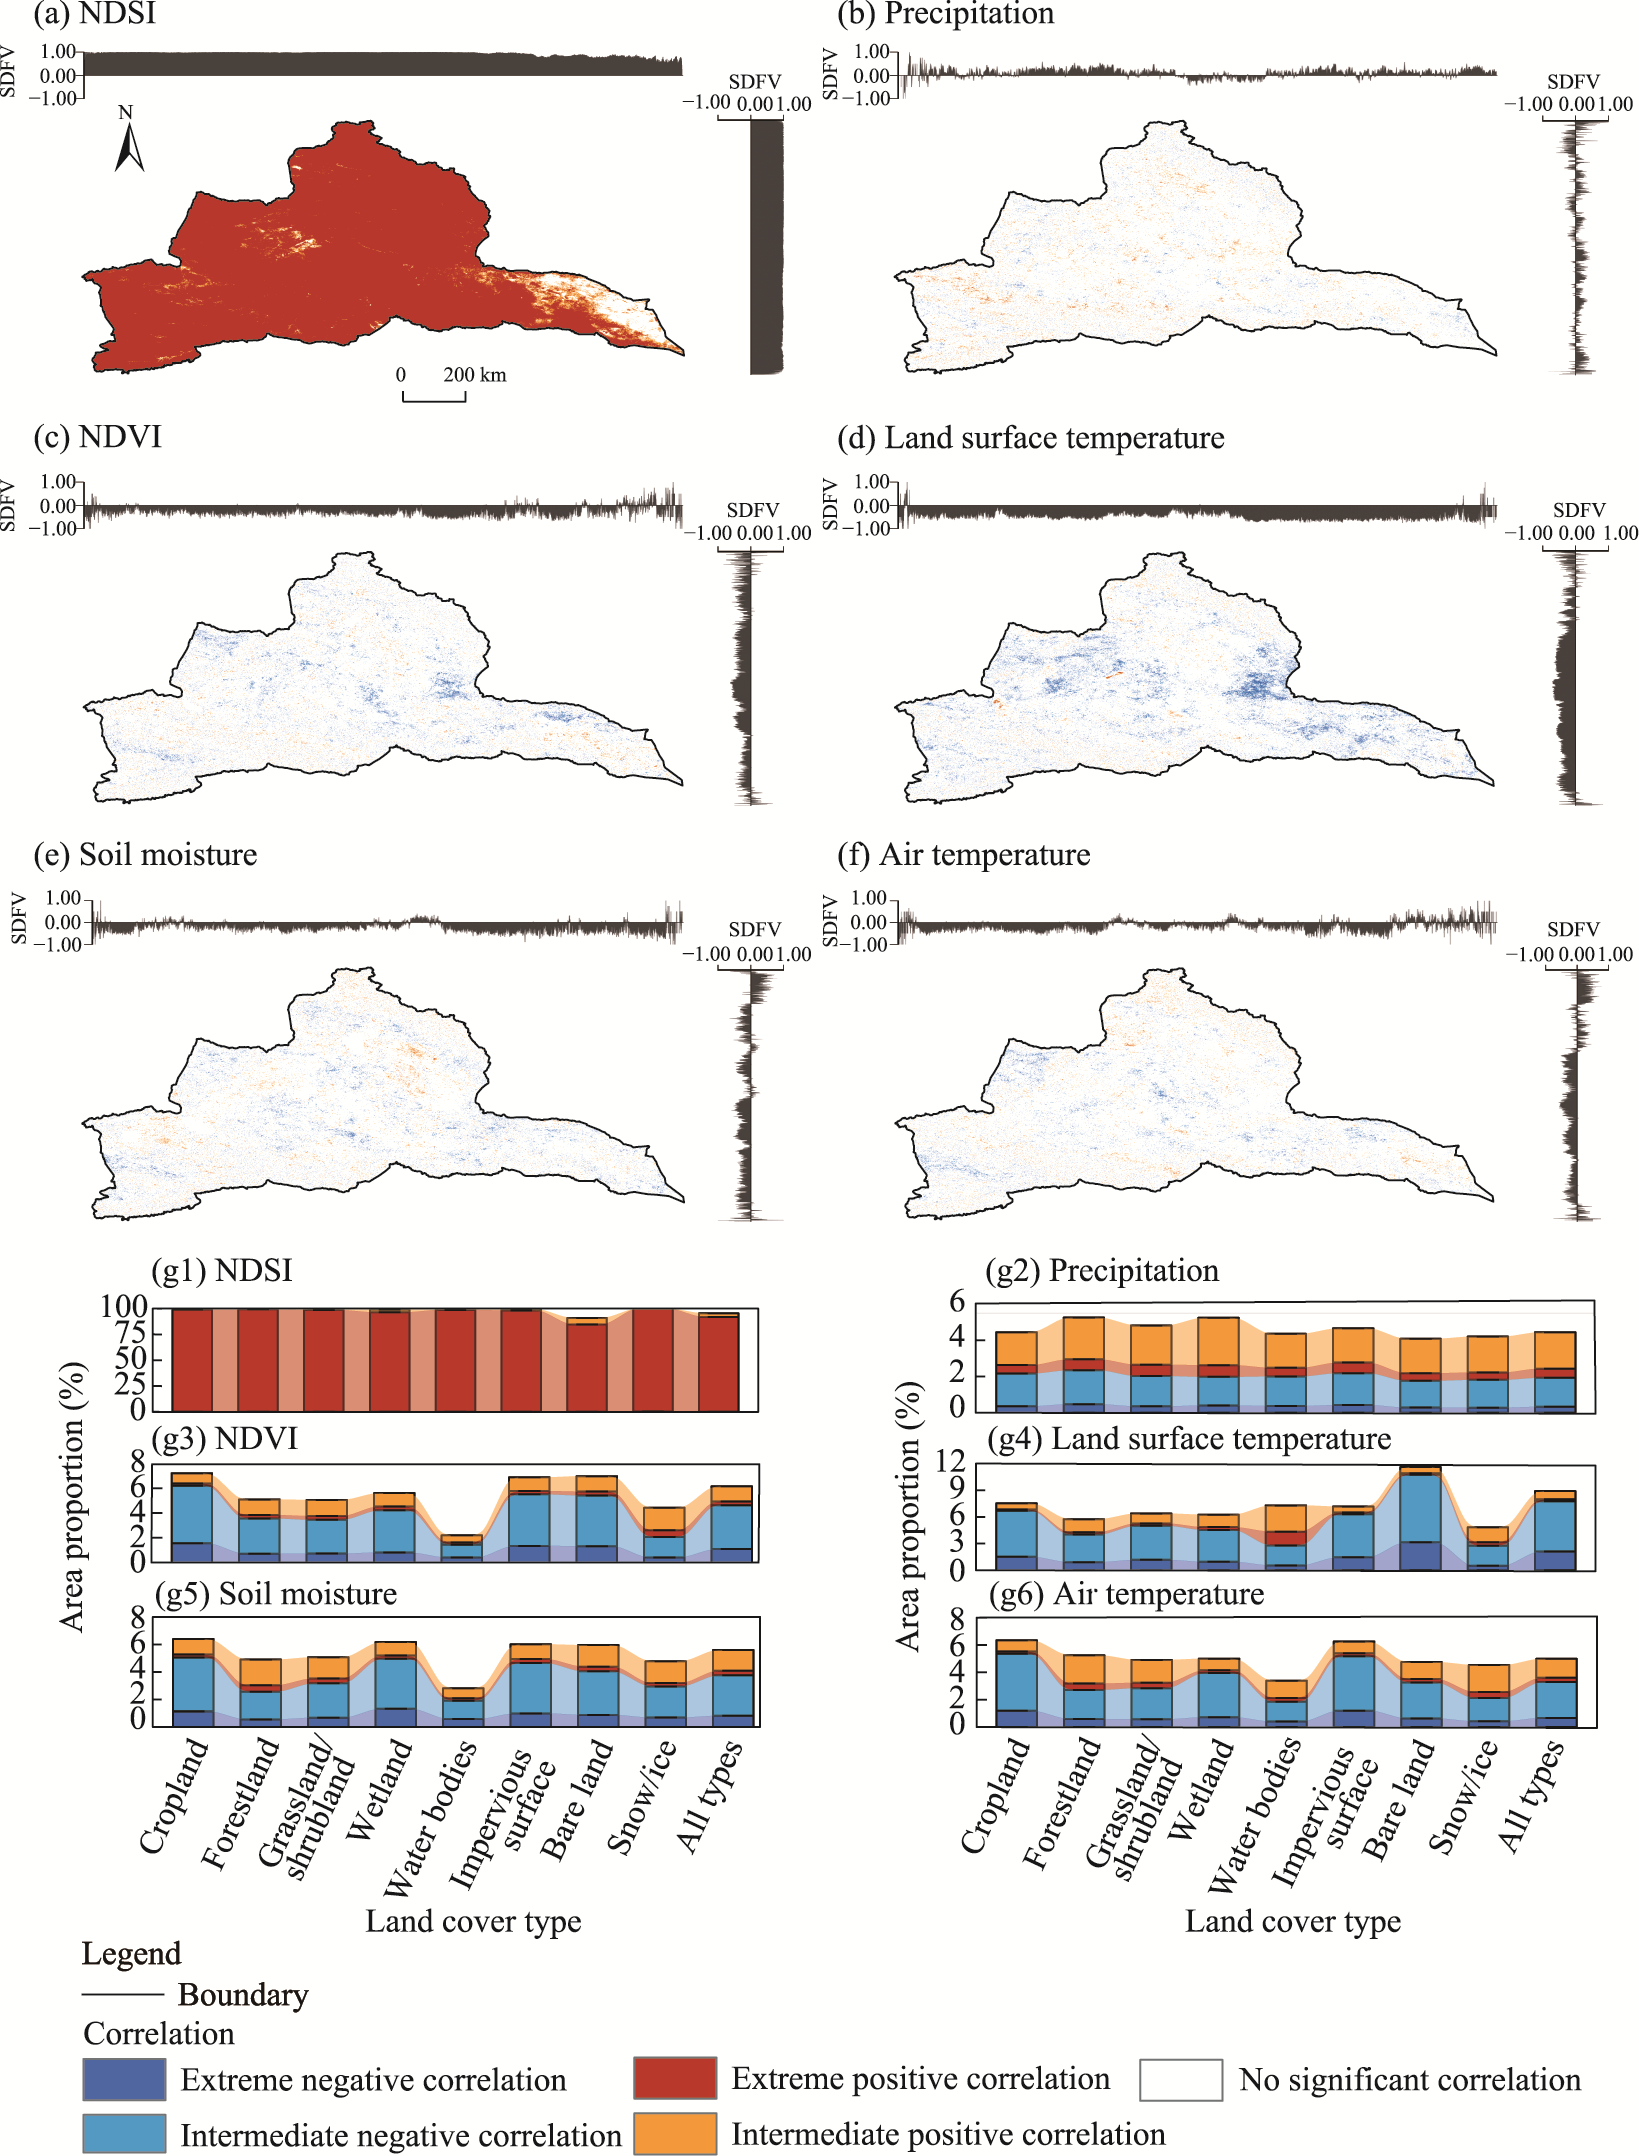
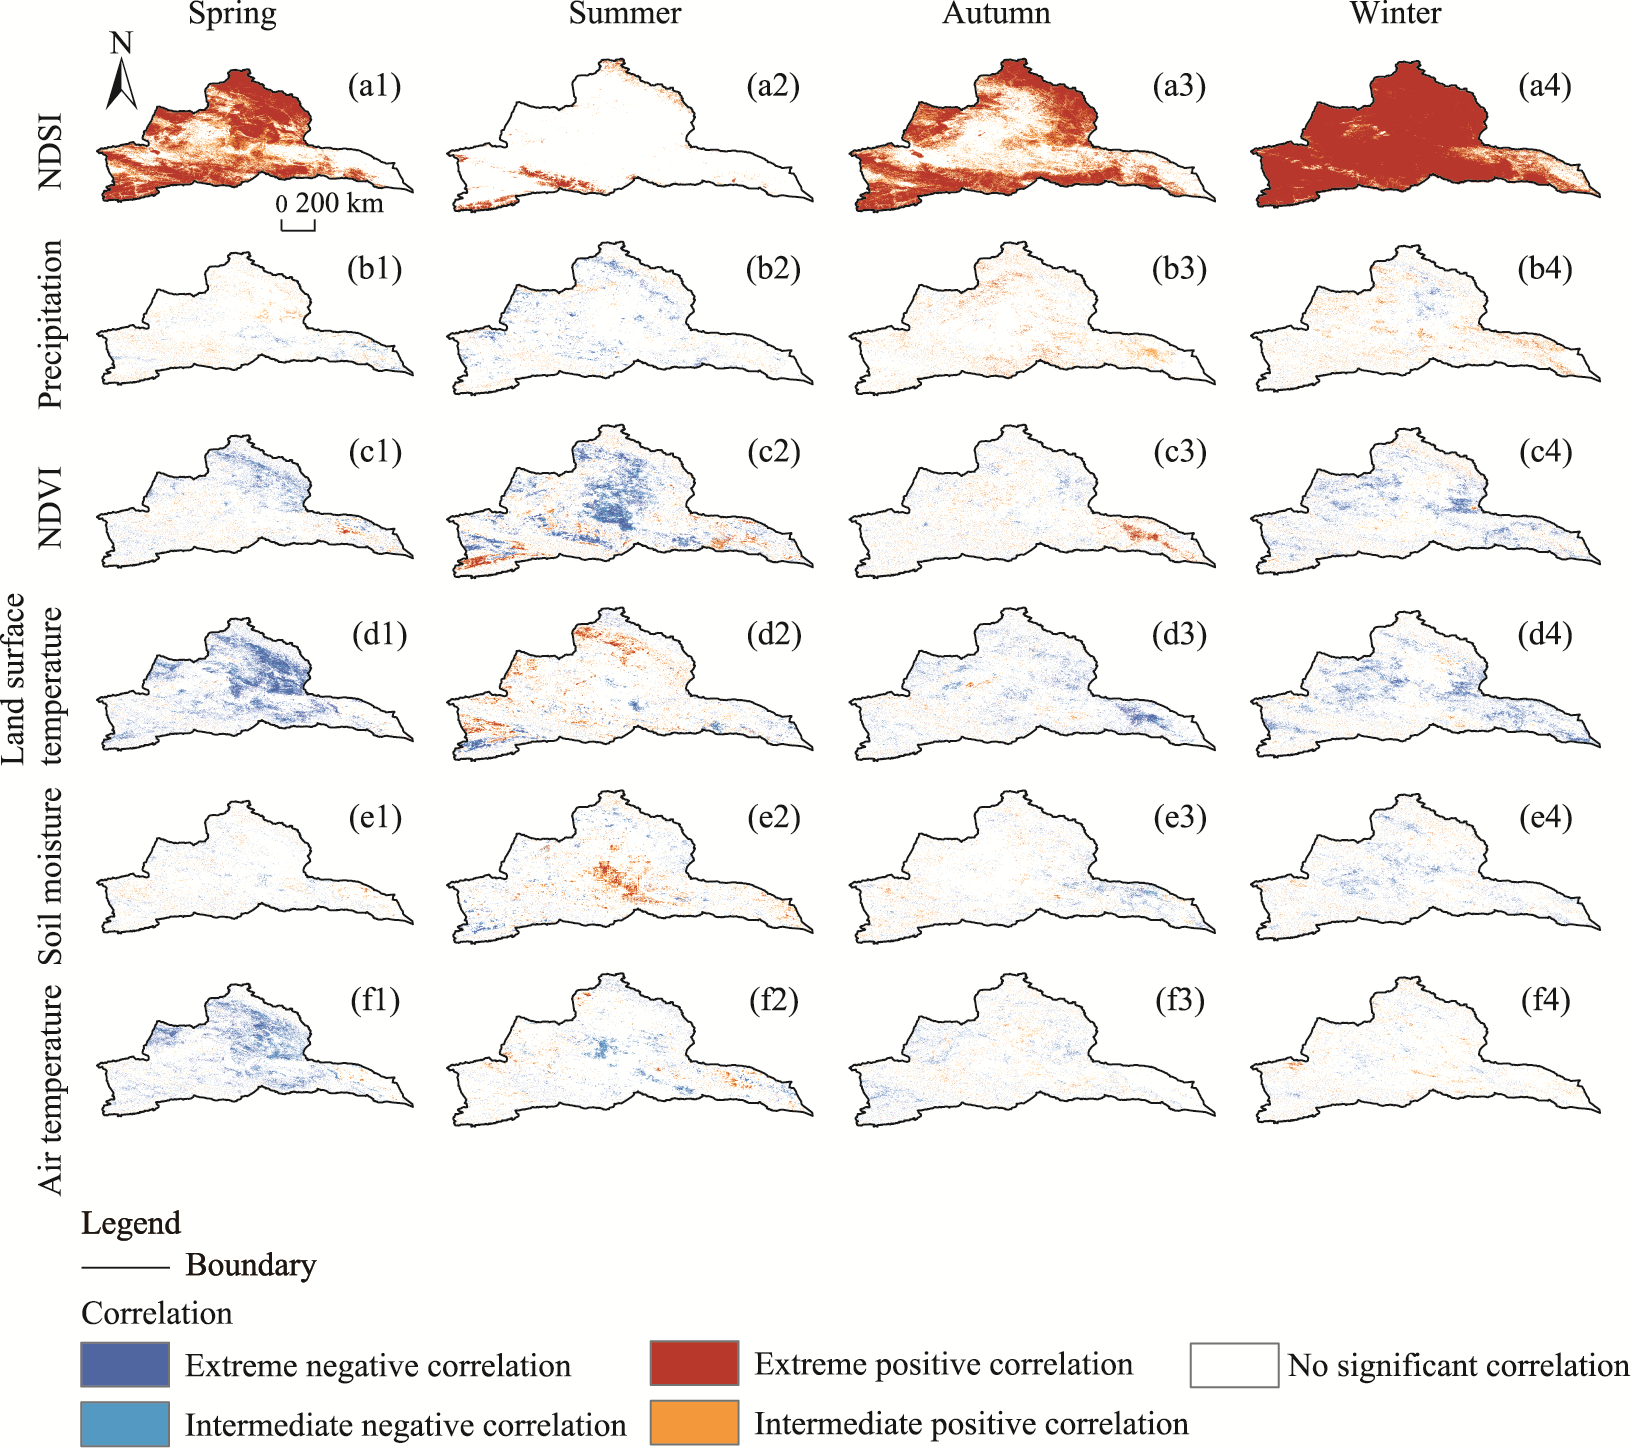
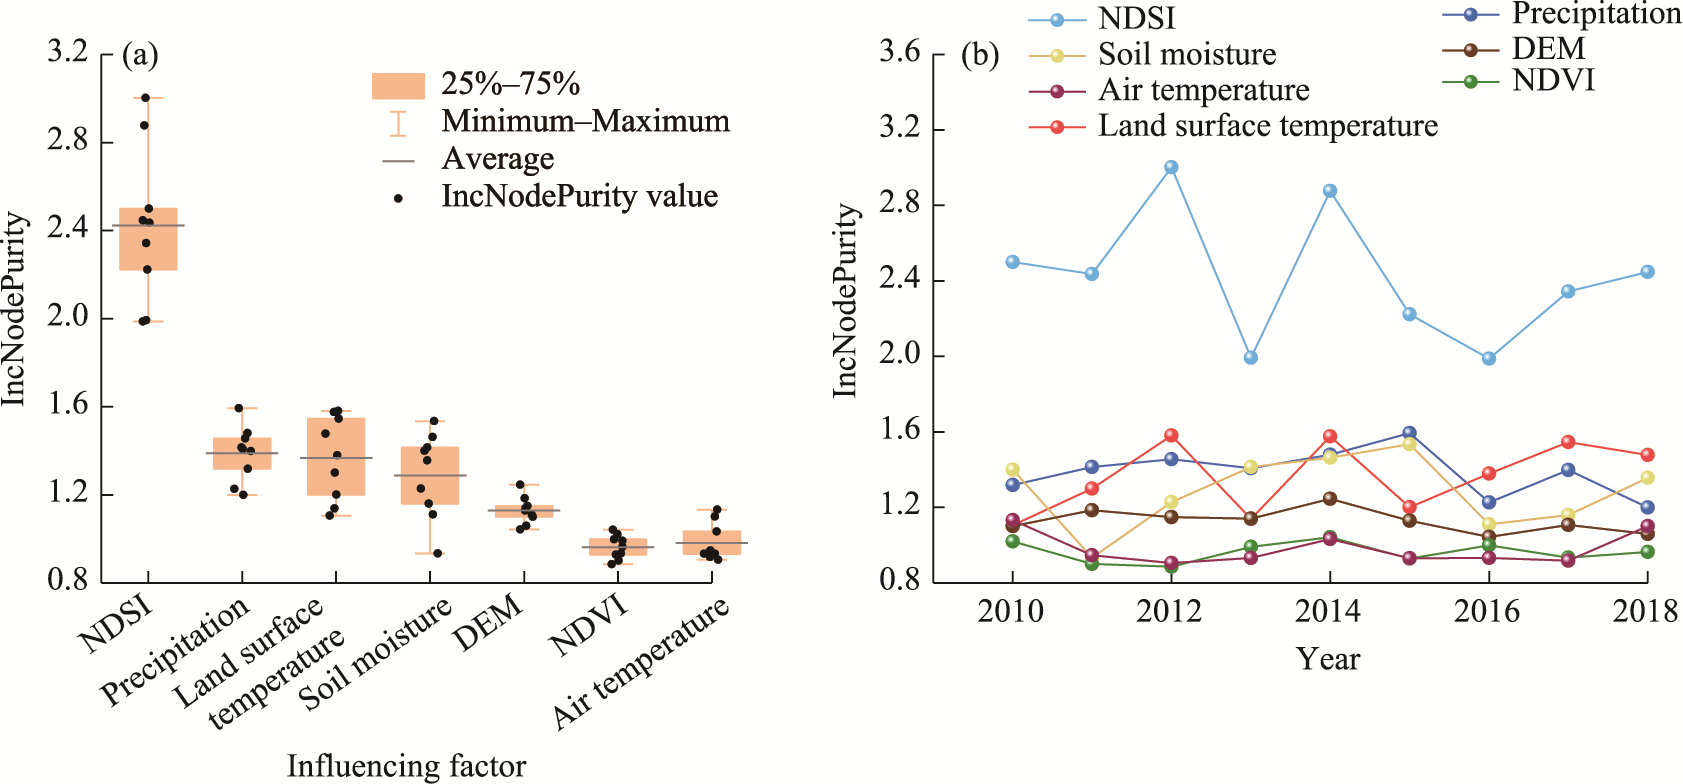
Abstract Surface albedo is a quantitative indicator for land surface processes and climate modeling, and plays an important role in surface radiation balance and climate change. In this study, by means of the MCD43A3 surface albedo product developed on the basis of Moderate Resolution Imaging Spectroradiometer (MODIS), we analyzed the spatiotemporal variation, persistence status, land cover type differences, and annual and seasonal differences of surface albedo, as well as the relationship between surface albedo and various influencing factors (including Normalized Difference Snow Index (NDSI), precipitation, Normalized Difference Vegetation Index (NDVI), land surface temperature, soil moisture, air temperature, and digital elevation model (DEM)) in the north of Xinjiang Uygur Autonomous Region (northern Xinjiang) of Northwest China from 2010 to 2020 based on the unary linear regression, Hurst index, and Pearson's correlation coefficient analyses. Combined with the random forest (RF) model and geographical detector (Geodetector), the importance of the above-mentioned influencing factors as well as their interactions on surface albedo were quantitatively evaluated. The results showed that the seasonal average surface albedo in northern Xinjiang was the highest in winter and the lowest in summer. The annual average surface albedo from 2010 to 2020 was high in the west and north and low in the east and south, showing a weak decreasing trend and a small and stable overall variation. Land cover types had a significant impact on the variation of surface albedo. The annual average surface albedo in most regions of northern Xinjiang was positively correlated with NDSI and precipitation, and negatively correlated with NDVI, land surface temperature, soil moisture, and air temperature. In addition, the correlations between surface albedo and various influencing factors showed significant differences for different land cover types and in different seasons. To be specific, NDSI had the largest influence on surface albedo, followed by precipitation, land surface temperature, and soil moisture; whereas NDVI, air temperature, and DEM showed relatively weak influences. However, the interactions of any two influencing factors on surface albedo were enhanced, especially the interaction of air temperature and DEM. NDVI showed a nonlinear enhancement of influence on surface albedo when interacted with land surface temperature or precipitation, with an explanatory power greater than 92.00%. This study has a guiding significance in correctly understanding the land-atmosphere interactions in northern Xinjiang and improving the regional land-surface process simulation and climate prediction.
|
|
Received: 21 February 2023
Published: 30 November 2023
|
|
Corresponding Authors:
* LIU Yongqiang (E-mail: liuyq@xju.edu.cn)
|
|
|
| [1] |
Alessandri A, Catalano F, De Felice M, et al. 2017. Multi-scale enhancement of climate prediction over land by increasing the model sensitivity to vegetation variability in EC-Earth. Climate Dynamics, 49(4): 1215-1237.
doi: 10.1007/s00382-016-3372-4
|
|
|
| [2] |
Alessandri A, Catalano F, De Felice M, et al. 2021. Varying snow and vegetation signatures of surface-albedo feedback on the Northern Hemisphere land warming. Environmental Research Letters, 16(3): 034023, doi: 10.1088/1748-9326/abd65f.
|
|
|
| [3] |
Alibakhshi S, Hovi A, Rautiainen M. 2019. Temporal dynamics of albedo and climate in the sparse forests of Zagros. Science of the Total Environment, 663: 596-609.
doi: 10.1016/j.scitotenv.2019.01.253
|
|
|
| [4] |
Atlaskina K, Berninger F, de Leeuw G. 2015. Satellite observations of changes in snow-covered land surface albedo during spring in the Northern Hemisphere. The Cryosphere, 9(5): 1879-1893.
doi: 10.5194/tc-9-1879-2015
|
|
|
| [5] |
Bonan G B. 2008. Forests and climate change: forcings, feedbacks, and the climate benefits of forests. Science, 320(5882): 1444-1449.
doi: 10.1126/science.1155121
pmid: 18556546
|
|
|
| [6] |
Bormann K J, Brown R D, Derksen C, et al. 2018. Estimating snow-cover trends from space. Nature Climate Change, 8(11): 924-928.
doi: 10.1038/s41558-018-0318-3
|
|
|
| [7] |
Cess R D. 1978. Biosphere-albedo feedback and climate modeling. Journal of Atmospheric Sciences, 35(9): 1765-1768.
doi: 10.1175/1520-0469(1978)035<1765:BAFACM>2.0.CO;2
|
|
|
| [8] |
Chen C N, Tian L, Zhu L Q, et al. 2021. The impact of climate change on the surface albedo over the Qinghai-Tibet Plateau. Remote Sensing, 13(12): 2336, doi: 10.3390/rs13122336.
|
|
|
| [9] |
Deng X J, Jing C Q, Guo W Z, et al. 2021. Spatio-temporal variation characteristics of surface albedo and analysis of influential factors in the Junggar Basin. Arid Zone Research, 38(2):314-326. (in Chinese)
|
|
|
| [10] |
Dickinson R E. 1983. Land surface processes and climate—Surface albedos and energy balance. Advances in Geophysics, 25: 305-353.
|
|
|
| [11] |
Fan N, Xie G D, Zhang C S, et al. 2012. Spatial-temporal dynamic changes of vegetation cover in Lancang River Basin during 2001-2010. Resources Science, 34(7): 1222-1231. (in Chinese)
|
|
|
| [12] |
Fang H L, Liang S L, Kim H Y, et al. 2007. Developing a spatially continuous 1 km surface albedo data set over North America from Terra MODIS products. Journal of Geophysical Research: Atmospheres, 112: D20206, doi: 10.1029/2006JD008377.
|
|
|
| [13] |
Fassnacht S R, Cherry M L, Venable N B H, et al. 2016. Snow and albedo climate change impacts across the United States Northern Great Plains. The Cryosphere, 10(1): 329-339.
doi: 10.5194/tc-10-329-2016
|
|
|
| [14] |
Gascoin S, Ducharne A, Ribstein P, et al. 2009. Sensitivity of bare soil albedo to surface soil moisture on the moraine of the Zongo glacier (Bolivia). Geophysical Research Letters, 36(2): L02405, doi: 10.1029/2008GL036377.
|
|
|
| [15] |
Gomes L C, Faria R M, de Souza E, et al. 2019. Modelling and mapping soil organic carbon stocks in Brazil. Geoderma, 340: 337-350.
doi: 10.1016/j.geoderma.2019.01.007
|
|
|
| [16] |
Gorelick N, Hancher M, Dixon M, et al. 2017. Google Earth Engine: Planetary-scale geospatial analysis for everyone. Remote Sensing of Environment, 202: 18-27.
doi: 10.1016/j.rse.2017.06.031
|
|
|
| [17] |
Grömping U. 2009. Variable importance assessment in regression: linear regression versus random forest. The American Statistician, 63(4): 308-319.
doi: 10.1198/tast.2009.08199
|
|
|
| [18] |
He T, Liang S L, Yu Y Y, et al. 2013. Greenland surface albedo changes in July 1981-2012 from satellite observations. Environmental Research Letters, 8(4): 044043, doi: 10.1088/1748-9326/8/4/044043.
|
|
|
| [19] |
He T, Liang S L, Song D X. 2014. Analysis of global land surface albedo climatology and spatial-temporal variation during 1981-2010 from multiple satellite products. Journal of Geophysical Research: Atmospheres, 119(17): 10281-10298.
|
|
|
| [20] |
Hotaling S, Lutz S, Dial R J, et al. 2021. Biological albedo reduction on ice sheets, glaciers, and snowfields. Earth-Science Reviews, 220: 103728, doi: 10.1016/j.earscirev.2021.103728.
|
|
|
| [21] |
Hou W, Hou X Y. 2020. Spatial-temporal changes in vegetation coverage in the global coastal zone based on GIMMS NDVI3g data. International Journal of Remote Sensing, 41(3-4): 1118-1138.
doi: 10.1080/01431161.2019.1657603
|
|
|
| [22] |
Hou X Y, Wu T, Yu L J, et al. 2012. Characteristics of multi-temporal scale variation of vegetation coverage in the Circum Bohai Bay Region, 1999-2009. Acta Ecologica Sinica, 32(6): 297-304.
doi: 10.1016/j.chnaes.2012.08.001
|
|
|
| [23] |
Huang W F, Cheng B, Zhang J R, et al. 2019. Modeling experiments on seasonal lake ice mass and energy balance in the Qinghai-Tibet Plateau: a case study. Hydrology and Earth System Sciences, 23(4): 2173-2186.
doi: 10.5194/hess-23-2173-2019
|
|
|
| [24] |
Kala J, Evans J P, Pitman A J, et al. 2014. Implementation of a soil albedo scheme in the CABLEv1.4b land surface model and evaluation against MODIS estimates over Australia. Geoscientific Model Development, 7(5): 2121-2140.
doi: 10.5194/gmd-7-2121-2014
|
|
|
| [25] |
Knorr W, Schnitzler K G, Govaerts Y. 2001. The role of bright desert regions in shaping North African climate. Geophysical Research Letters, 28(18): 3489-3492.
doi: 10.1029/2001GL013283
|
|
|
| [26] |
Kong Y L, Pang Z H. 2012. Evaluating the sensitivity of glacier rivers to climate change based on hydrograph separation of discharge. Journal of Hydrology, 434-435: 121-129.
doi: 10.1016/j.jhydrol.2012.02.029
|
|
|
| [27] |
Li Q P, Ma M G, Wu X D, et al. 2018. Snow cover and vegetation-induced decrease in global albedo from 2002 to 2016. Journal of Geophysical Research: Atmospheres, 123(1): 124-138.
doi: 10.1002/jgrd.v123.1
|
|
|
| [28] |
Li X J, Zhang H Y, Qu Y. 2020. Land surface albedo variations in Sanjiang Plain from 1982 to 2015: Assessing with glass data. Chinese Geographical Science, 30(5): 876-888.
doi: 10.1007/s11769-020-1152-x
|
|
|
| [29] |
Liang S L, Zhao X, Liu S H, et al. 2013. A long-term Global Land Surface Satellite (GLASS) data-set for environmental studies. International Journal of Digital Earth, 6(Supp1.): 5-33.
doi: 10.1080/17538947.2013.805262
|
|
|
| [30] |
Liang S L, Wang D D, He T, et al. 2019. Remote sensing of earth's energy budget: Synthesis and review. International Journal of Digital Earth, 12(7): 737-780.
doi: 10.1080/17538947.2019.1597189
|
|
|
| [31] |
Liu Q, Wang L Z, Qu Y, et al. 2013. Preliminary evaluation of the long-term GLASS albedo product. International Journal of Digital Earth, 6(Supp1.): 69-95.
doi: 10.1080/17538947.2013.804601
|
|
|
| [32] |
Liu S S, Yang Y H, Shen H H, et al. 2018. No significant changes in topsoil carbon in the grasslands of northern China between the 1980s and 2000s. Science of the Total Environment, 624: 1478-1487.
doi: 10.1016/j.scitotenv.2017.12.254
|
|
|
| [33] |
Liu Y H, Zhong Y F, Ma A L, et al. 2023. Cross-resolution national-scale land-cover mapping based on noisy label learning: A case study of China. International Journal of Applied Earth Observation and Geoinformation, 118: 103265, doi: 10.1016/j.jag.2023.103265.
|
|
|
| [34] |
Loranty M M, Berner L T, Goetz S J, et al. 2014. Vegetation controls on northern high latitude snow-albedo feedback: observations and CMIP 5 model simulations. Global Change Biology, 20(2): 594-606.
doi: 10.1111/gcb.2014.20.issue-2
|
|
|
| [35] |
Lucht W, Hyman A H, Strahler A H, et al. 2000. A comparison of satellite-derived spectral albedos to ground-based broadband albedo measurements modeled to satellite spatial scale for a semidesert landscape. Remote Sensing of Environment, 74(1): 85-98.
doi: 10.1016/S0034-4257(00)00125-5
|
|
|
| [36] |
Luo N N, Bake B, Wu Y F. 2017. Analysis on spatiotemporal characteristics of drought-flood based on standard precipitation index in northern Xinjiang in recent 52 years. Research of Soil and Water Conservation, 24(2): 293-299. (in Chinese)
|
|
|
| [37] |
Malmros J K, Mernild S H, Wilson R, et al. 2018. Snow cover and snow albedo changes in the central Andes of Chile and Argentina from daily MODIS observations (2000-2016). Remote Sensing of Environment, 209: 240-252.
doi: 10.1016/j.rse.2018.02.072
|
|
|
| [38] |
Moody E G, King M D, Schaaf C B, et al. Northern Hemisphere five-year average (2000-2004) spectral albedos of surfaces in the presence of snow: Statistics computed from Terra MODIS land products. Remote Sensing of Environment, 111(2-3): 337-345.
|
|
|
| [39] |
Ollinger S V, Richardson A D, Martin M E, et al. 2008. Canopy nitrogen, carbon assimilation, and albedo in temperate and boreal forests: Functional relations and potential climate feedbacks. Proceedings of the National Academy of Sciences, 105(49): 19336-19341.
|
|
|
| [40] |
Ouyang Z, Sciusco P, Jiao T, et al. 2022. Albedo changes caused by future urbanization contribute to global warming. Nature Communications, 13(1): 3800, doi: 10.1038/s41467-022-31558-z.
pmid: 35778380
|
|
|
| [41] |
Pang G J, Chen D L, Wang X J, et al. 2022. Spatiotemporal variations of land surface albedo and associated influencing factors on the Tibetan Plateau. Science of the Total Environment, 804: 150100, doi: 10.1016/j.scitotenv.2021.150100.
|
|
|
| [42] |
Pearson R G, Phillips S J, Loranty M M, et al. 2013. Shifts in Arctic vegetation and associated feedbacks under climate change. Nature Climate Change, 3(7): 673-677.
doi: 10.1038/nclimate1858
|
|
|
| [43] |
Pistone K, Eisenman I, Ramanathan V. 2014. Observational determination of albedo decrease caused by vanishing Arctic sea ice. Proceedings of the National Academy of Sciences, 111(9): 3322-3326.
|
|
|
| [44] |
Planque C, Carrer D, Roujean J L. 2017. Analysis of MODIS albedo changes over steady woody covers in France during the period of 2001-2013. Remote Sensing of Environment, 191: 13-29.
doi: 10.1016/j.rse.2016.12.019
|
|
|
| [45] |
Potts D R, Mackin S, Muller J P, et al. 2012. Sensor intercalibration over Dome C for the ESA GlobAlbedo project. IEEE Transactions on Geoscience and Remote Sensing, 51(3): 1139-1146.
doi: 10.1109/TGRS.2012.2217749
|
|
|
| [46] |
Qu X, Hall A. 2007. What controls the strength of snow-albedo feedback? Journal of Climate, 20(15): 3971-3981.
doi: 10.1175/JCLI4186.1
|
|
|
| [47] |
Rangwala I, Miller J R. 2012. Climate change in mountains: a review of elevation-dependent warming and its possible causes. Climatic Change, 114(3): 527-547.
doi: 10.1007/s10584-012-0419-3
|
|
|
| [48] |
Rotenberg E, Yakir D. 2010. Contribution of semi-arid forests to the climate system. Science, 327(5964): 451-454.
doi: 10.1126/science.1179998
pmid: 20093470
|
|
|
| [49] |
Salomonson V V, Appel I. 2004. Estimating fractional snow cover from MODIS using the normalized difference snow index. Remote Sensing of Environment, 89(3): 351-360.
doi: 10.1016/j.rse.2003.10.016
|
|
|
| [50] |
Sánchez-Granero M A, Trinidad-Segovia J E, García-Pérez J. 2008. Some comments on Hurst exponent and the long memory processes on capital markets. Physica A: Statistical Mechanics and its Applications, 387(22): 5543-5551.
doi: 10.1016/j.physa.2008.05.053
|
|
|
| [51] |
Schaaf C B, Gao F, Strahler A H, et al. 2002. First operational BRDF, albedo nadir reflectance products from MODIS. Remote Sensing of Environment, 83(1-2): 135-148.
doi: 10.1016/S0034-4257(02)00091-3
|
|
|
| [52] |
Shekhar M S, Chand H, Kumar S, et al. 2010. Climate-change studies in the western Himalaya. Annals of Glaciology, 51(54): 105-112.
doi: 10.3189/172756410791386508
|
|
|
| [53] |
Shi Q, Liang S. 2013. Characterizing the surface radiation budget over the Tibetan Plateau with ground-measured, reanalysis, and remote sensing data sets: 2. Spatiotemporal analysis. Journal of Geophysical Research: Atmospheres, 118(16): 8921-8934.
doi: 10.1002/jgrd.v118.16
|
|
|
| [54] |
Song Y Z, Wang J F, Ge Y, et al. 2020. An optimal parameters-based geographical detector model enhances geographic characteristics of explanatory variables for spatial heterogeneity analysis: cases with different types of spatial data. GIScience & Remote Sensing, 57(5-6): 593-610.
|
|
|
| [55] |
Tang R Y, Zhao X, Zhou T, et al. 2018. Assessing the impacts of urbanization on albedo in Jing-Jin-Ji Region of China. Remote Sensing, 10(7): 1096, doi: 10.3390/rs10071096.
|
|
|
| [56] |
Tang X Y, Cui Y P, Li N, et al. 2020. Human activities enhance radiation forcing through surface albedo associated with vegetation in Beijing. Remote Sensing, 12(5): 837, doi: 10.3390/rs12050837.
|
|
|
| [57] |
Van De Kerchove R, Lhermitte S, Veraverbeke S, et al. 2013. Spatio-temporal variability in remotely sensed land surface temperature, and its relationship with physiographic variables in the Russian Altay Mountains. International Journal of Applied Earth Observation and Geoinformation, 20: 4-19.
doi: 10.1016/j.jag.2011.09.007
|
|
|
| [58] |
Verheijen F G A, Jeffery S, van der Velde M, et al. 2013. Reductions in soil surface albedo as a function of biochar application rate: implications for global radiative forcing. Environmental Research Letters, 8(4): 044008, doi: 10.1088/1748-9326/8/4/044008.
|
|
|
| [59] |
Wang J F, Xu C D. 2017. Geodetector: Principle and prospective. Acta Geographica Sinica, 72(1): 116-134. (in Chinese)
doi: 10.11821/dlxb201701010
|
|
|
| [60] |
Wang J J, Ding J L, Zhang Z. 2019. Temporal-spatial dynamic change characteristics of soil moisture in Ebinur Lake Basin from 2008-2014. Acta Ecologica Sinica, 39(5): 1784-1794. (in Chinese)
|
|
|
| [61] |
Wang K C, Wang P C, Liu J M, et al. 2005. Variation of surface albedo and soil thermal parameters with soil moisture content at a semi-desert site on the western Tibetan Plateau. Boundary-Layer Meteorology, 116(1): 117-129.
doi: 10.1007/s10546-004-7403-z
|
|
|
| [62] |
Wang X W, Xie H J, Liang T G. 2008. Evaluation of MODIS snow cover and cloud mask and its application in Northern Xinjiang, China. Remote Sensing of Environment, 112(4): 1497-1513.
doi: 10.1016/j.rse.2007.05.016
|
|
|
| [63] |
Wang Y F, Shen Y J, Sun F B, et al. 2014a. Evaluating the vegetation growing season changes in the arid region of northwestern China. Theoretical and Applied Climatology, 118: 569-579.
doi: 10.1007/s00704-013-1078-7
|
|
|
| [64] |
Wang Z S, Schaaf C B, Chopping M J, et al. 2012. Evaluation of Moderate-resolution Imaging Spectroradiometer (MODIS) snow albedo product (MCD43A) over tundra. Remote Sensing of Environment, 117: 264-280.
doi: 10.1016/j.rse.2011.10.002
|
|
|
| [65] |
Wang Z S, Schaaf C B, Strahler A H, et al. 2014b. Evaluation of MODIS albedo product (MCD43A) over grassland, agriculture and forest surface types during dormant and snow-covered periods. Remote Sensing of Environment, 140: 60-77.
doi: 10.1016/j.rse.2013.08.025
|
|
|
| [66] |
Wen J G, Lin X W, Wu X D, et al. 2022. Validation of the MCD43A 3 collection 6 and GLASS V04 snow-free albedo products over rugged terrain. IEEE Transactions on Geoscience and Remote Sensing, 60: 5632311, doi: 10.1109/TGRS.2022.3214103.
|
|
|
| [67] |
Wielicki B A, Wong T, Loeb N, et al. 2005. Changes in Earth's albedo measured by satellite. Science, 308(5723): 825, doi: 10.1126/science.11064.
pmid: 15879211
|
|
|
| [68] |
Xu H Q. 2009. Quantitative analysis on the relationship of urban impervious surface with other components of the urban ecosystem. Acta Ecologica Sinica, 29(5): 2456-2462.
|
|
|
| [69] |
Xu Z Y, Qiu X F, Li S S, et al. 2020. Analysis of surface albedo over China based on MODIS. Journal of Arid Land Resources and Environment, 34(1): 99-105. (in Chinese)
|
|
|
| [70] |
Zhang H W, Song J, Wang G, et al. 2021a. Spatiotemporal characteristic and forecast of drought in northern Xinjiang, China. Ecological Indicators, 127: 107712, doi: 10.1016/j.ecolind.2021.107712.
|
|
|
| [71] |
Zhang Y, Chu X Z, Yang S M, et al. 2019. Climate change in North Xinjiang in recent 56 years. Arid Zone Research, 36(1): 212-219. (in Chinese)
|
|
|
| [72] |
Zhang Y L, Gao T G, Kang S C, et al. 2021b. Albedo reduction as an important driver for glacier melting in Tibetan Plateau and its surrounding areas. Earth-Science Reviews, 220: 103735, doi: 10.1016/j.earscirev.2021.103735.
|
|
|
| [73] |
Zhao Z C, Zhao K, Xu J B, et al. 2014. Spatial-temporal changes of surface albedo and its relationship with climate factors in the source of three rivers region. Arid Zone Research, 31(6): 1031-1038. (in Chinese)
|
|
|
| [74] |
Zou L, Gao F, Ma Y J. 2021. Spatial distribution of water quality in Ulungur Lake. Journal of Hydroecology, 42(1): 35-41. (in Chinese)
|
|
|
|
Viewed |
|
|
|
Full text
|
|
|
|
|
Abstract
|
|
|
|
|
Cited |
|
|
|
|
| |
Shared |
|
|
|
|
| |
Discussed |
|
|
|
|