| Research article |
|


|
|
|
| Response of ecosystem carbon storage to land use change from 1985 to 2050 in the Ningxia Section of Yellow River Basin, China |
LIN Yanmin1,2, HU Zhirui3, LI Wenhui1,2, CHEN Haonan1,2, WANG Fang1,2,*( ), NAN Xiongxiong4, YANG Xuelong5, ZHANG Wenjun5 ), NAN Xiongxiong4, YANG Xuelong5, ZHANG Wenjun5 |
1College of Geographical Sciences and Planning, Ningxia University, Yinchuan 750021, China
2China-Arab Joint International Research Laboratory for Featured Resources and Environmental Governance in Arid Region, Yinchuan 750021, China
3Ningxia Land Resources Surveying and Monitoring Institute, Yinchuan 750002, China
4State Key Laboratory of Efficient Production of Forest Resources, Yinchuan 750002, China
5Ningxia Lingwu Baijitan National Nature Reserve Administration, Yinchuan 751400, China |
|
|
|
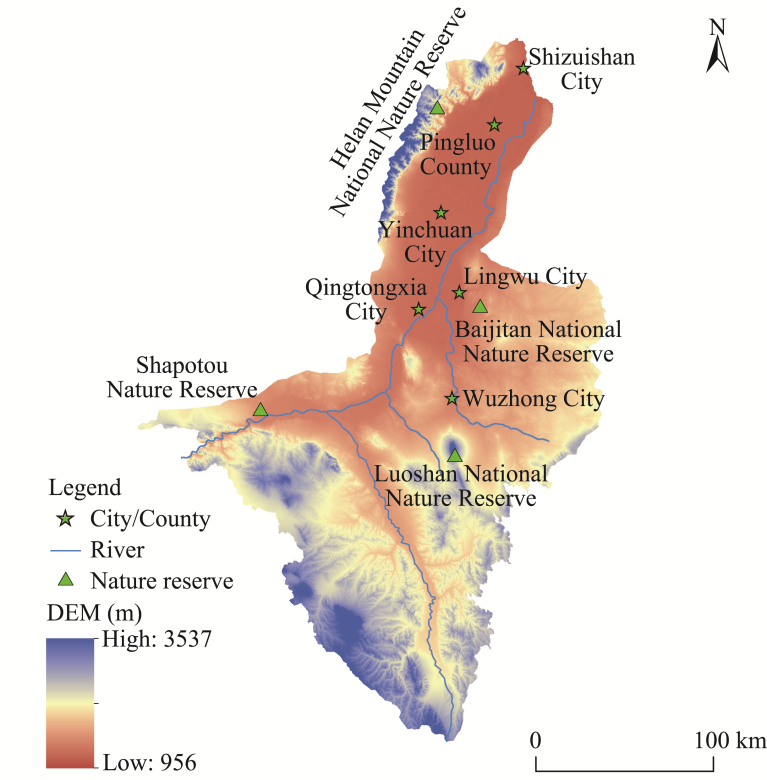
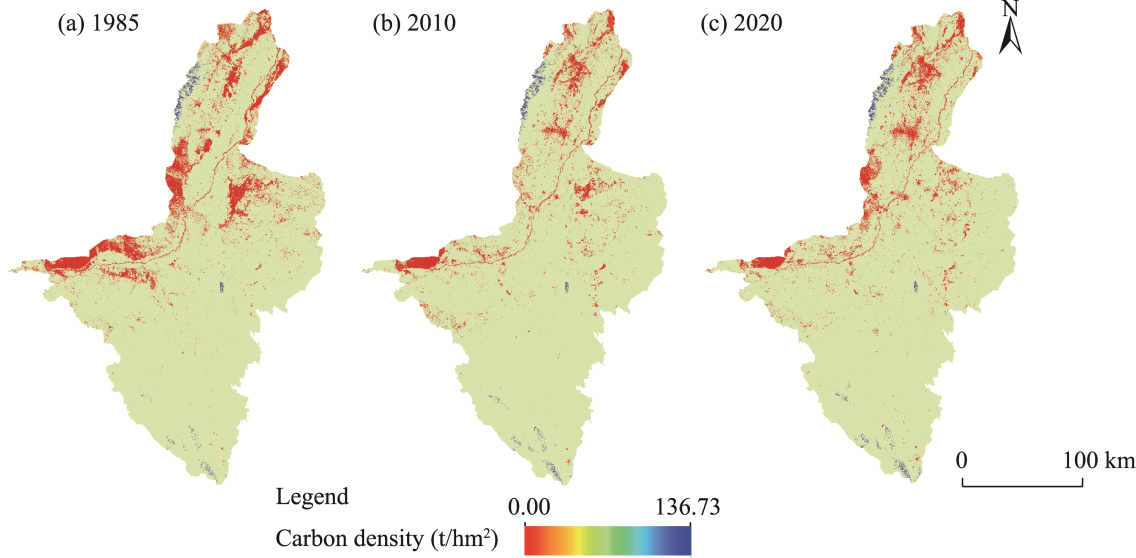
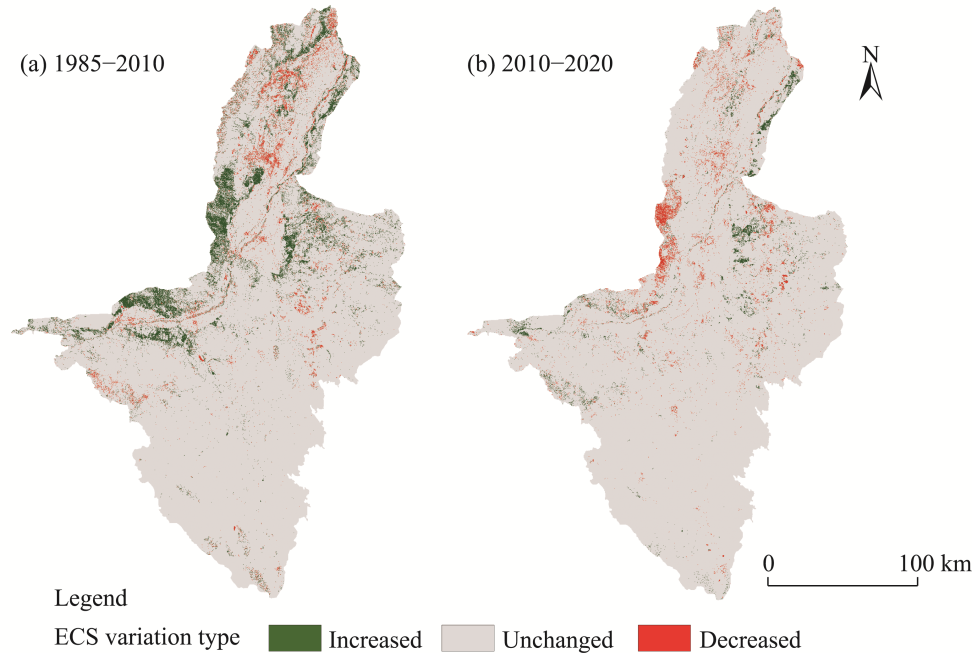
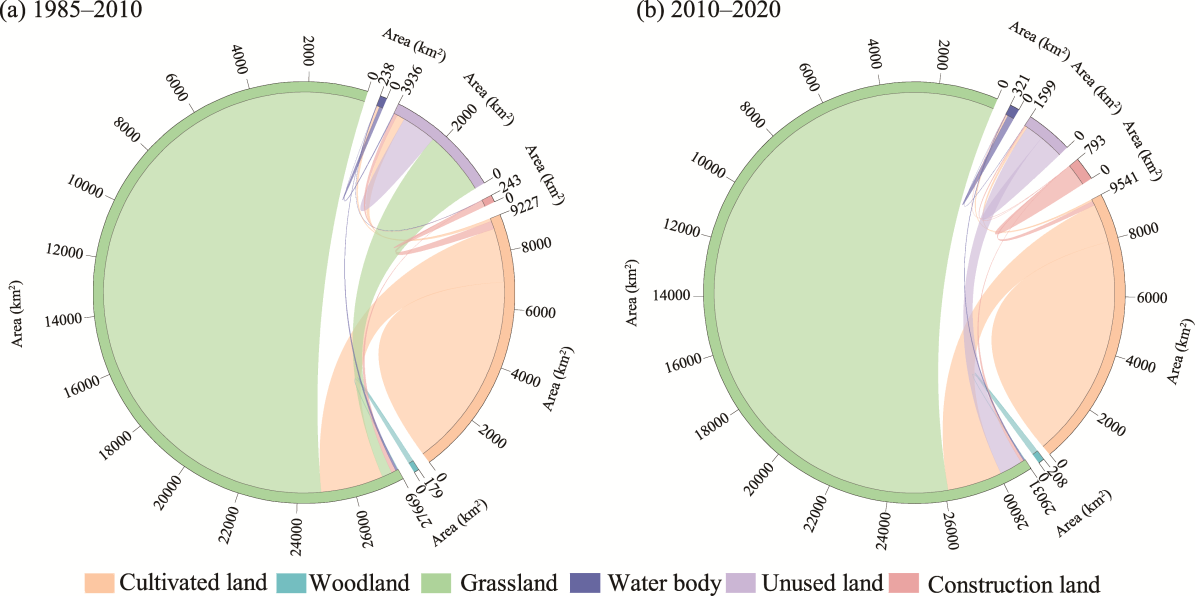
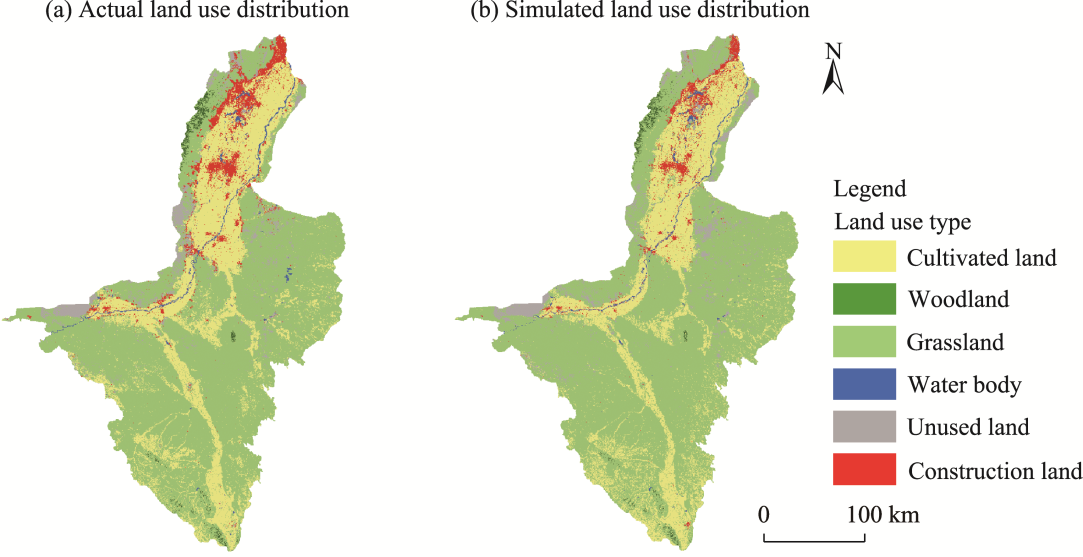
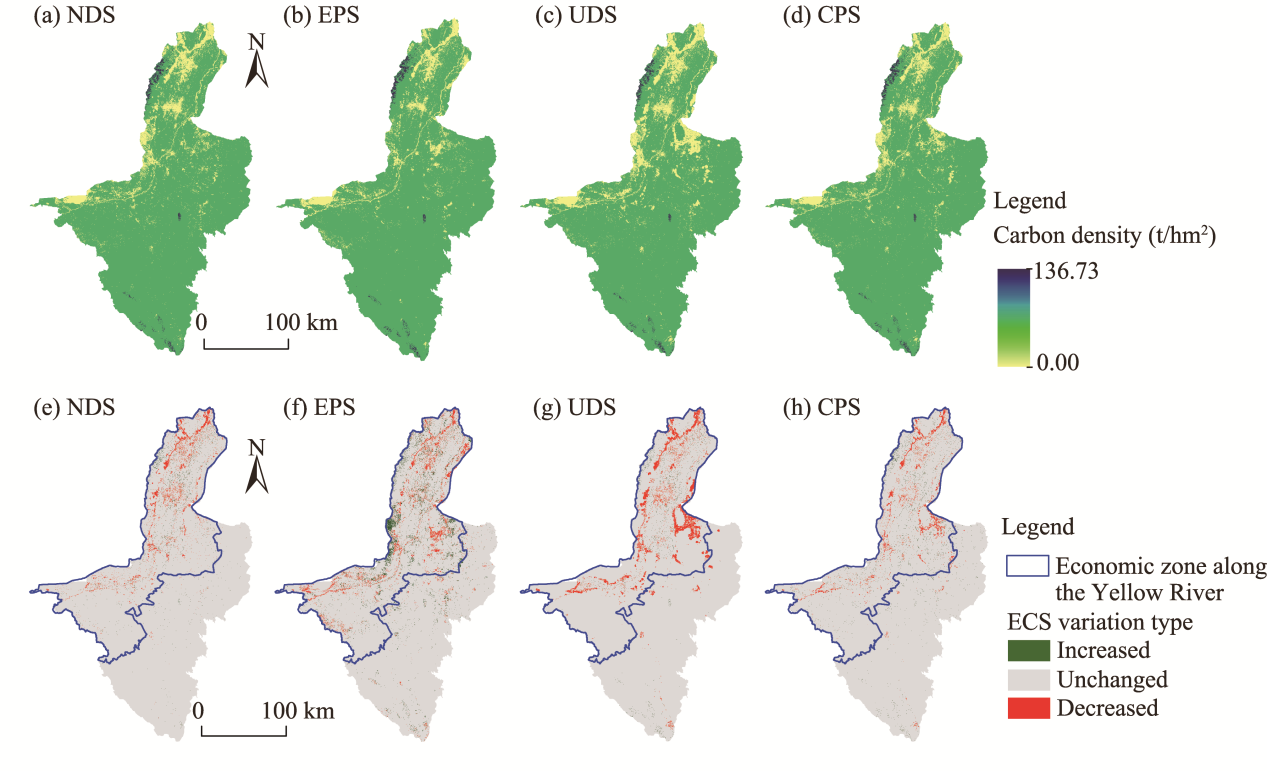
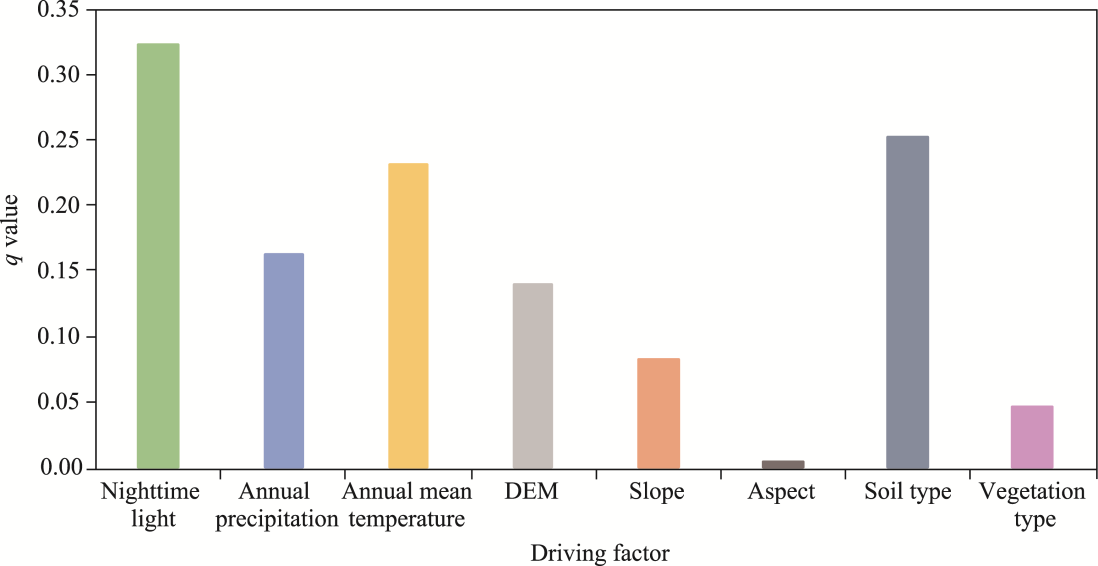
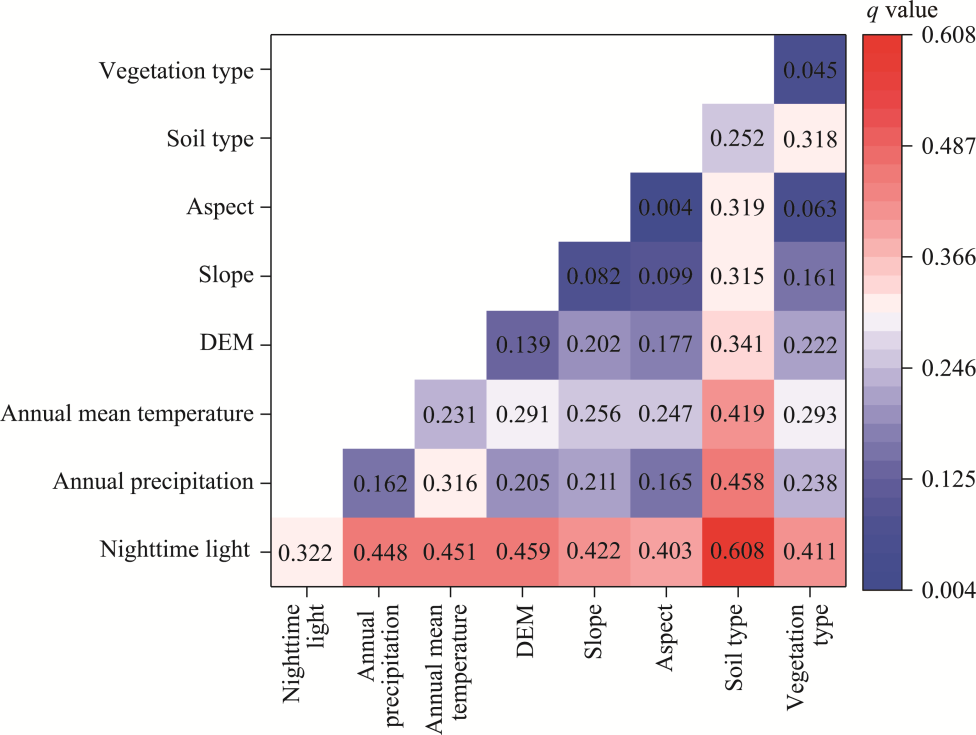
Abstract Regional sustainable development necessitates a holistic understanding of spatiotemporal variations in ecosystem carbon storage (ECS), particularly in ecologically sensitive areas with arid and semi-arid climate. In this study, we calculated the ECS in the Ningxia Section of Yellow River Basin, China from 1985 to 2020 using the Integrated Valuation of Ecosystem Services and Tradeoffs (InVEST) model based on land use data. We further predicted the spatial distribution of ECS in 2050 under four land use scenarios: natural development scenario (NDS), ecological protection scenario (EPS), cultivated land protection scenario (CPS), and urban development scenario (UDS) using the patch-generating land use simulation (PLUS) model, and quantified the influences of natural and human factors on the spatial differentiation of ECS using the geographical detector (Geodetector). Results showed that the total ECS of the study area initially increased from 1985 until reaching a peak at 402.36×10⁶ t in 2010, followed by a decreasing trend to 2050. The spatial distribution of ECS was characterized by high values in the eastern and southern parts of the study area, and low values in the western and northern parts. Between 1985 and 2020, land use changes occurred mainly through the expansion of cultivated land, woodland, and construction land at the expense of unused land. The total ECS in 2050 under different land use scenarios (ranked as EPS>CPS>NDS>UDS) would be lower than that in 2020. Nighttime light was the largest contributor to the spatial differentiation of ECS, with soil type and annual mean temperature being the major natural driving factors. Findings of this study could provide guidance on the ecological construction and high-quality development in arid and semi-arid areas.
|
|
Received: 08 August 2023
Published: 31 January 2024
|
|
Corresponding Authors:
*WANG Fang (E-mail: fangwang0820@nxu.edu.cn)
|
| Cite this article:
LIN Yanmin, HU Zhirui, LI Wenhui, CHEN Haonan, WANG Fang, NAN Xiongxiong, YANG Xuelong, ZHANG Wenjun. Response of ecosystem carbon storage to land use change from 1985 to 2050 in the Ningxia Section of Yellow River Basin, China. Journal of Arid Land, 2024, 16(1): 110-130.
URL:
http://jal.xjegi.com/10.1007/s40333-024-0052-9 OR http://jal.xjegi.com/Y2024/V16/I1/110
|
|
|
| [1] |
Alam S A, Starr M, Clark B J F. 2013. Tree biomass and soil organic carbon densities across the Sudanese woodland savannah: A regional carbon sequestration study. Journal of Arid Environments, 89: 67-76.
doi: 10.1016/j.jaridenv.2012.10.002
|
|
|
| [2] |
Bian R, Zhao A T, Liu X F, et al. 2023. Impact of land use change on carbon storage in urban agglomerations in the Guanzhong plain. Environmental Science, doi: 10.13227/j.hjkx.202306233. (in Chinese)
|
|
|
| [3] |
Cao M, Tang G A, Shen Q F, et al. 2015. A new discovery of transition rules for cellular automata by using cuckoo search algorithm. International Journal of Geographical Information Science, 29(5): 806-824.
doi: 10.1080/13658816.2014.999245
|
|
|
| [4] |
Chang X Q, Xing Y Q, Wang J Q, et al. 2022. Effects of land use and cover change (LUCC) on terrestrial carbon stocks in China between 2000 and 2018. Resources, Conservation and Recycling, 182: 106333, doi: 10.1016/j.resconrec.2022.106333.
|
|
|
| [5] |
Chaudhuri G, Clarke K. 2013. The SLEUTH land use change model: A review. Environmental Resources Research, 1(1): 88-105.
|
|
|
| [6] |
Chen G S, Yang Y S, Xie J S, et al. 2007. Total belowground carbon allocation in China's forests. Acta Ecologica Sinica, 27(12): 5148-5157. (in Chinese)
|
|
|
| [7] |
Chuai X W, Huang X J, Zheng Z Q, et al. 2011. Land use change and its influence on carbon storage of terrestrial ecosystems in Jiangsu Province. Resources Science, 33(10): 1932-1939. (in Chinese)
|
|
|
| [8] |
Dai L C, Ke X, Guo X W, et al. 2019. Responses of biomass allocation across two vegetation types to climate fluctuations in the northern Qinghai-Tibet Plateau. Ecology and Evolution, 9(10): 6105-6115.
doi: 10.1002/ece3.2019.9.issue-10
|
|
|
| [9] |
Dignac M F, Derrien D, Barré P, et al. 2017. Increasing soil carbon storage: mechanisms, effects of agricultural practices and proxies. A review. Agronomy for Sustainable Development, 37(2): 14, doi: 10.1007/s13593-017-0421-2.
|
|
|
| [10] |
Dong F, Li J Y, Wang Y, et al. 2019. Drivers of the decoupling indicator between the economic growth and energy-related CO2 in China: A revisit from the perspectives of decomposition and spatiotemporal heterogeneity. Science of the Total Environment, 685: 631-658.
doi: 10.1016/j.scitotenv.2019.05.269
|
|
|
| [11] |
Du X G. 2020. Improvement status and suggestions of degraded natural grassland in Sunan County. Journal of Animal Science and Veterinary Medicine, 39(4): 70-71. (in Chinese)
|
|
|
| [12] |
Elbasiouny H, El-Ramady H, Elbehiry F, et al. 2022. Plant nutrition under climate change and soil carbon sequestration. Sustainability, 14(2): 914, doi: 10.3390/su14020914.
|
|
|
| [13] |
Gu Q, Wei J, Luo S C, et al. 2018. Potential and environmental control of carbon sequestration in major ecosystems across arid and semi-arid regions in China. Science of the Total Environment, 645: 796-805.
doi: 10.1016/j.scitotenv.2018.07.139
|
|
|
| [14] |
Hastings S J, Oechel W C, Muhliamelo A. 2005. Diurnal, seasonal and annual variation in the net ecosystem CO2 exchange of a desert shrub community (Sarcocaulescent) in Baja California, Mexico. Global Change Biology, 11(6): 927-939.
doi: 10.1111/gcb.2005.11.issue-6
|
|
|
| [15] |
He C Y, Zhang D, Huang Q X, et al. 2016. Assessing the potential impacts of urban expansion on regional carbon storage by linking the LUSD-urban and InVEST models. Environmental Modelling & Software, 75: 44-58.
|
|
|
| [16] |
Houghton R A. 2003. Revised estimates of the annual net flux of carbon to the atmosphere from changes in land use and land management 1850-2000. Tellus B: Chemical and Physical Meteorology, 55(2): 378-390.
|
|
|
| [17] |
Huang M, Ji J J, Cao M K, et al. 2006. Modeling study of vegetation shoot and root biomass in China. Acta Ecologica Sinica, 26(12): 4156-4163. (in Chinese)
|
|
|
| [18] |
Huo H, Sun C P. 2021. Spatiotemporal variation and influencing factors of vegetation dynamics based on Geodetector: A case study of the northwestern Yunnan Plateau, China. Ecological Indicators, 130: 108005, doi: 10.1016/j.ecolind.2021.108005.
|
|
|
| [19] |
Lai L, Huang X J, Yang H, et al. 2016. Carbon emissions from land-use change and management in China between 1990 and 2010. Science Advances, 2(11): e1601063, doi: 10.1126/sciadv.1601063.
|
|
|
| [20] |
Lal R. 2004. Carbon sequestration in dryland ecosystems. Environmental Management, 33(4): 528-544.
doi: 10.1007/s00267-003-9110-9
pmid: 15453406
|
|
|
| [21] |
Leta M K, Demissie T A, Tränckner J. 2021. Modeling and prediction of land use land cover change dynamics based on land change modeler (LCM) in Nashe watershed, Upper Blue Nile Basin, Ethiopia. Sustainability, 13(7): 3740, doi: 10.3390/su13073740.
|
|
|
| [22] |
Li K M, Cao J J, Adamowski J F, et al. 2021. Assessing the effects of ecological engineering on spatiotemporal dynamics of carbon storage from 2000 to 2016 in the Loess Plateau area using the InVEST model: A case study in Huining County, China. Environmental Development, 39: 100641, doi: 10.1016/j.envdev.2021.100641.
|
|
|
| [23] |
Li K R, Wang S Q, Cao M K. 2004. Vegetation and soil carbon storage in China. Science in China Series D-Earth Sciences, 47(1): 49-57.
doi: 10.1360/02yd0029
|
|
|
| [24] |
Li P C, Chen J D, Li Y X, et al. 2023. Using the InVEST-PLUS model to predict and analyze the pattern of ecosystem carbon storage in Liaoning Province, China. Remote Sensing, 15(16): 4050, doi: 10.3390/rs15164050.
|
|
|
| [25] |
Li R, Shi Y, Feng C C, et al. 2021. The spatial relationship between ecosystem service scarcity value and urbanization from the perspective of heterogeneity in typical arid and semiarid regions of China. Ecological Indicators, 132: 108299, doi: 10.1016/j.ecolind.2021.108299.
|
|
|
| [26] |
Li S, Gu Y W, Chen J P. 2016. Spatio-temporal dynamical changes of land use in Ningxia Yellow River Valley. Journal of Southwest University (Natural Science Edition), 38(4): 42-49. (in Chinese)
|
|
|
| [27] |
Li W, Liu Y J, Yang Z F. 2012. Preliminary strategic environmental assessment of the Great Western Development Strategy: safeguarding ecological security for a new western China. Environmental Management, 49(2): 483-501.
doi: 10.1007/s00267-011-9794-1
pmid: 22190169
|
|
|
| [28] |
Liang X, Guan Q F, Clarke K C, et al. 2021a. Understanding the drivers of sustainable land expansion using a patch-generating land use simulation (PLUS) model: A case study in Wuhan, China. Computers, Environment and Urban Systems, 85: 101569, doi: 10.1016/j.compenvurbsys.2020.101569.
|
|
|
| [29] |
Liang Y J, Hashimoto S, Liu L J. 2021b. Integrated assessment of land-use/land-cover dynamics on carbon storage services in the Loess Plateau of China from 1995 to 2050. Ecological Indicators, 120: 106939, doi: 10.1016/j.ecolind.2020.106939.
|
|
|
| [30] |
Liu Q, Yang D D, Cao L, et al. 2022. Assessment and prediction of carbon storage based on land use/land cover dynamics in the tropics: A case study of Hainan Island, China. Land, 11(2): 244, doi: 10.3390/land11020244.
|
|
|
| [31] |
Liu X P, Liang X, Li X, et al. 2017. A future land use simulation model (FLUS) for simulating multiple land use scenarios by coupling human and natural effects. Landscape and Urban Planning, 168: 94-116.
doi: 10.1016/j.landurbplan.2017.09.019
|
|
|
| [32] |
Lu H L, Zhou L H, Chen Y, et al. 2017. Degree of coupling and coordination of eco-economic system and the influencing factors: a case study in Yanchi County, Ningxia Hui Autonomous Region, China. Journal of Arid Land, 9(3): 446-457.
doi: 10.1007/s40333-017-0098-z
|
|
|
| [33] |
Lu Y Y, Xu X L, Zhao J H, et al. 2022. Spatiotemporal evolution of mountainous ecosystem services in an arid region and its influencing factors: A case study of the Tianshan Mountains in Xinjiang. Land, 11(12): 2164, doi: 10.3390/land11122164.
|
|
|
| [34] |
Lyu R F, Clarke K C, Zhang J M, et al. 2019. The impact of urbanization and climate change on ecosystem services: A case study of the city belt along the Yellow River in Ningxia, China. Computers, Environment and Urban Systems, 77: 101351, doi: 10.1016/j.compenvurbsys.2019.101351.
|
|
|
| [35] |
Maestre F T, Cortina J. 2004. Do positive interactions increase with abiotic stress? A test from a semi-arid steppe. Proceedings of the Royal Society B: Biological Sciences, 271(Suppl. 5): S331-S333.
|
|
|
| [36] |
Meentemeyer R K, Tang W W, Dorning M A, et al. 2013. FUTURES: multilevel simulations of emerging urban-rural landscape structure using a stochastic patch-growing algorithm. Annals of the Association of American Geographers, 103(4): 785-807.
doi: 10.1080/00045608.2012.707591
|
|
|
| [37] |
Nie X, Lu B, Chen Z P, et al. 2020. Increase or decrease? Integrating the CLUMondo and InVEST models to assess the impact of the implementation of the Major Function Oriented Zone planning on carbon storage. Ecological Indicators, 118: 106708, doi: 10.1016/j.ecolind.2020.106708.
|
|
|
| [38] |
Piyathilake I D U H, Udayakumara E P N, Ranaweera L V, et al. 2022. Modeling predictive assessment of carbon storage using InVEST model in Uva Province, Sri Lanka. Modeling Earth Systems and Environment, 8(2): 2213-2223.
doi: 10.1007/s40808-021-01207-3
|
|
|
| [39] |
Posner S, Verutes G, Koh I, et al. 2016. Global use of ecosystem service models. Ecosystem Services, 17: 131-141.
doi: 10.1016/j.ecoser.2015.12.003
|
|
|
| [40] |
Raich J W, Schlesinger W H. 1992. The global carbon dioxide flux in soil respiration and its relationship to vegetation and climate. Tellus B: Chemical and Physical Meteorology, 44(2): 81-99.
doi: 10.3402/tellusb.v44i2.15428
|
|
|
| [41] |
Sohl T L, Claggett P R. 2013. Clarity versus complexity: Land-use modeling as a practical tool for decision-makers. Journal of Environmental Management, 129: 235-243.
doi: 10.1016/j.jenvman.2013.07.027
pmid: 23954777
|
|
|
| [42] |
Song C, Yu Q Y, Wang R X. 2021. Spatio-temporal varaiation of windbreak and sand fixation functions based on vegetation coverage in Baijitan Nature Reserve, Ningxia. Acta Ecological Sinica, 41(8): 3131-3143. (in Chinese)
|
|
|
| [43] |
Tang X L, Zhao X, Bai Y F, et al. 2018. Carbon pools in China's terrestrial ecosystems: New estimates based on an intensive field survey. Proceedings of the National Academy of Sciences, 115(16): 4021-4026.
|
|
|
| [44] |
Verburg P H, Soepboer W, Veldkamp A, et al. 2002. Modeling the spatial dynamics of regional land use: the CLUE-S model. Environmental Management, 30(3): 391-405.
pmid: 12148073
|
|
|
| [45] |
Wang C W, Luo J J, Qing F, et al. 2022a. Analysis of the driving force of spatial and temporal differentiation of carbon storage in Taihang Mountains based on InVEST model. Applied Sciences, 12(20): 10662, doi: 10.3390/app122010662.
|
|
|
| [46] |
Wang C Y, Li T Z, Guo X H, et al. 2022b. Plus-InVEST Study of the Chengdu-Chongqing urban agglomeration's land-use change and carbon storage. Land, 11(10): 1617, doi: 10.3390/land11101617.
|
|
|
| [47] |
Wang J F, Xu C D. 2017. Geodetector: Principle and prospective. Acta Geographica Sinica, 72(1): 116-134. (in Chinese)
doi: 10.11821/dlxb201701010
|
|
|
| [48] |
Wang L, Du L T, Dan Y, et al. 2020. Carbon dynamic simulation of desert steppe ecosystem in different climate scenarios. Acta Ecologica Sinica, 40(2): 657-666. (in Chinese)
|
|
|
| [49] |
Wang P Q, Li R J, Liu D J, et al. 2022c. Dynamic characteristics and responses of ecosystem services under land use/land cover change scenarios in the Huangshui River Basin, China. Ecological Indicators, 144: 109539, doi: 10.1016/j.ecolind.2022.109539.
|
|
|
| [50] |
Wang Z Y, Li X, Mao Y T, et al. 2022d. Dynamic simulation of land use change and assessment of carbon storage based on climate change scenarios at the city level: A case study of Bortala, China. Ecological Indicators, 134: 108499, doi: 10.1016/j.ecolind.2021.108499.
|
|
|
| [51] |
Wei P J, Chen S Y, Wu M H, et al. 2021. Increased ecosystem carbon storage between 2001 and 2019 in the northeastern margin of the Qinghai-Tibet Plateau. Remote Sensing, 13(19): 3986, doi: 10.3390/rs13193986.
|
|
|
| [52] |
Wiesmeier M, von Lützow M, Spörlein P, et al. 2015. Land use effects on organic carbon storage in soils of Bavaria: the importance of soil types. Soil and Tillage Research, 146: 296-302.
doi: 10.1016/j.still.2014.10.003
|
|
|
| [53] |
Wu D, Li H, Ai N, et al. 2020. Predicting spatiotemporal changes in land use and habitat quality based on CA-Markov: A case study in central Ningxia, China. Chinese Journal of Eco-Agriculture, 28(12): 1969-1978.
|
|
|
| [54] |
Xiang M S, Wang C J, Tan Y X, et al. 2022. Spatio-temporal evolution and driving factors of carbon storage in the Western Sichuan Plateau. Scientific Reports, 12(1): 8114, doi: 10.1038/s41598-022-12175-8.
pmid: 35581278
|
|
|
| [55] |
Xie X L, Sun B, Zhou H Z, et al. 2004. Soil carbon stocks and their influencing factors under native vegetations in China. Acta Pedologica Sinica, 41(5): 687-699. (in Chinese)
|
|
|
| [56] |
Xu L, Yu G R, He N P, et al. 2018. Carbon storage in China's terrestrial ecosystems: A synthesis. Scientific Reports, 8: 2806, doi: 10.1038/s41598-018-20764-9.
pmid: 29434274
|
|
|
| [57] |
Xu L, He N P, Yu G R. 2019. A dataset of carbon density in Chinese terrestrial ecosystems (2010s). China Scientific Data, 4(1): 90-96. (in Chinese)
|
|
|
| [58] |
Xu L F, Liu X, Tong D, et al. 2022. Forecasting urban land use change based on cellular automata and the PLUS model. Land, 11(5): 652, doi: 10.3390/land11050652.
|
|
|
| [59] |
Xu X M, Du Z Q, Zhang H. 2016. Integrating the system dynamic and cellular automata models to predict land use and land cover change. International Journal of Applied Earth Observation and Geoinformation, 52: 568-579.
doi: 10.1016/j.jag.2016.07.022
|
|
|
| [60] |
Yang F X, Yang M, Xue B, et al. 2018. The effects of China's western development strategy implementation on local ecological economic performance. Journal of Cleaner Production, 202: 925-933.
doi: 10.1016/j.jclepro.2018.08.203
|
|
|
| [61] |
Yang J, Xie B P, Zhang D G. 2021. Spatio-temporal evolution of carbon stocks in the Yellow River Basin based on InVEST and CA-Markov models. Chinese Journal of Eco-Agriculture, 29(6): 1018-1029.
|
|
|
| [62] |
Yang L W, Wang D Y. 2009. Evaluation of ecological service value of wind-break and sand-fixation function of Shapotou sand-binding vegetation ecosystem. Journal of Shanxi Normal University (Natural Science Edition), 23(4): 94-98. (in Chinese)
|
|
|
| [63] |
Zhang P P, Li Y H, Yin H R, et al. 2022a. Spatio-temporal variation and dynamic simulation of ecosystem carbon storage in the north-south transitional zone of China. Journal of Natural Resources, 37(5): 1183-1197. (in Chinese)
doi: 10.31497/zrzyxb.20220506
|
|
|
| [64] |
Zhang S R, Bai X Y, Zhao C W, et al. 2022b. China's carbon budget inventory from 1997 to 2017 and its challenges to achieving carbon neutral strategies. Journal of Cleaner Production, 347: 130966, doi: 10.1016/j.jclepro.2022.130966.
|
|
|
| [65] |
Zhao M M, He Z B, Du J, et al. 2019. Assessing the effects of ecological engineering on carbon storage by linking the CA-Markov and InVEST models. Ecological Indicators, 98: 29-38.
doi: 10.1016/j.ecolind.2018.10.052
|
|
|
| [66] |
Zhao Z Q, Sharifi A, Dong X, et al. 2021. Spatial variability and temporal heterogeneity of surface urban heat island patterns and the suitability of local climate zones for land surface temperature characterization. Remote Sensing, 13(21): 4338, doi: 10.3390/rs13214338.
|
|
|
| [67] |
Zhu L Y, Hu K, Sun S, et al. 2022. Research on the spatiotemporal variation of carbon storage in the coastal zone of Liaoning Province based on InVEST model. Geoscience, 36(1): 96-104. (in Chinese)
|
|
|
| [68] |
Zhu W B, Zhang J J, Cui Y P, et al. 2019. Assessment of territorial ecosystem carbon storage based on land use change scenario: A case study in Qihe River Basin. Acta Geographica Sinica, 74(3): 446-459. (in Chinese)
doi: 10.11821/dlxb201903004
|
|
|
|
Viewed |
|
|
|
Full text
|
|
|
|
|
Abstract
|
|
|
|
|
Cited |
|
|
|
|
| |
Shared |
|
|
|
|
| |
Discussed |
|
|
|
|