| Research article |
|


|
|
|
| Spatiotemporal variation of land surface temperature and its driving factors in Xinjiang, China |
ZHANG Mingyu1,2, CAO Yu1,2, ZHANG Zhengyong1,2,*( ), ZHANG Xueying3, LIU Lin1,2, CHEN Hongjin1,2, GAO Yu1,2, YU Fengchen1,2, LIU Xinyi1,2 ), ZHANG Xueying3, LIU Lin1,2, CHEN Hongjin1,2, GAO Yu1,2, YU Fengchen1,2, LIU Xinyi1,2 |
1College of Sciences, Shihezi University, Shihezi 832000, China
2Key Laboratory of Oasis Town and Mountain-Basin System Ecology, Xinjiang Production and Construction Corps, Shihezi 832000, China
3Yantai Institute of Coastal Zone Research, Chinese Academy of Sciences, Yantai 264003, China |
|
|
|
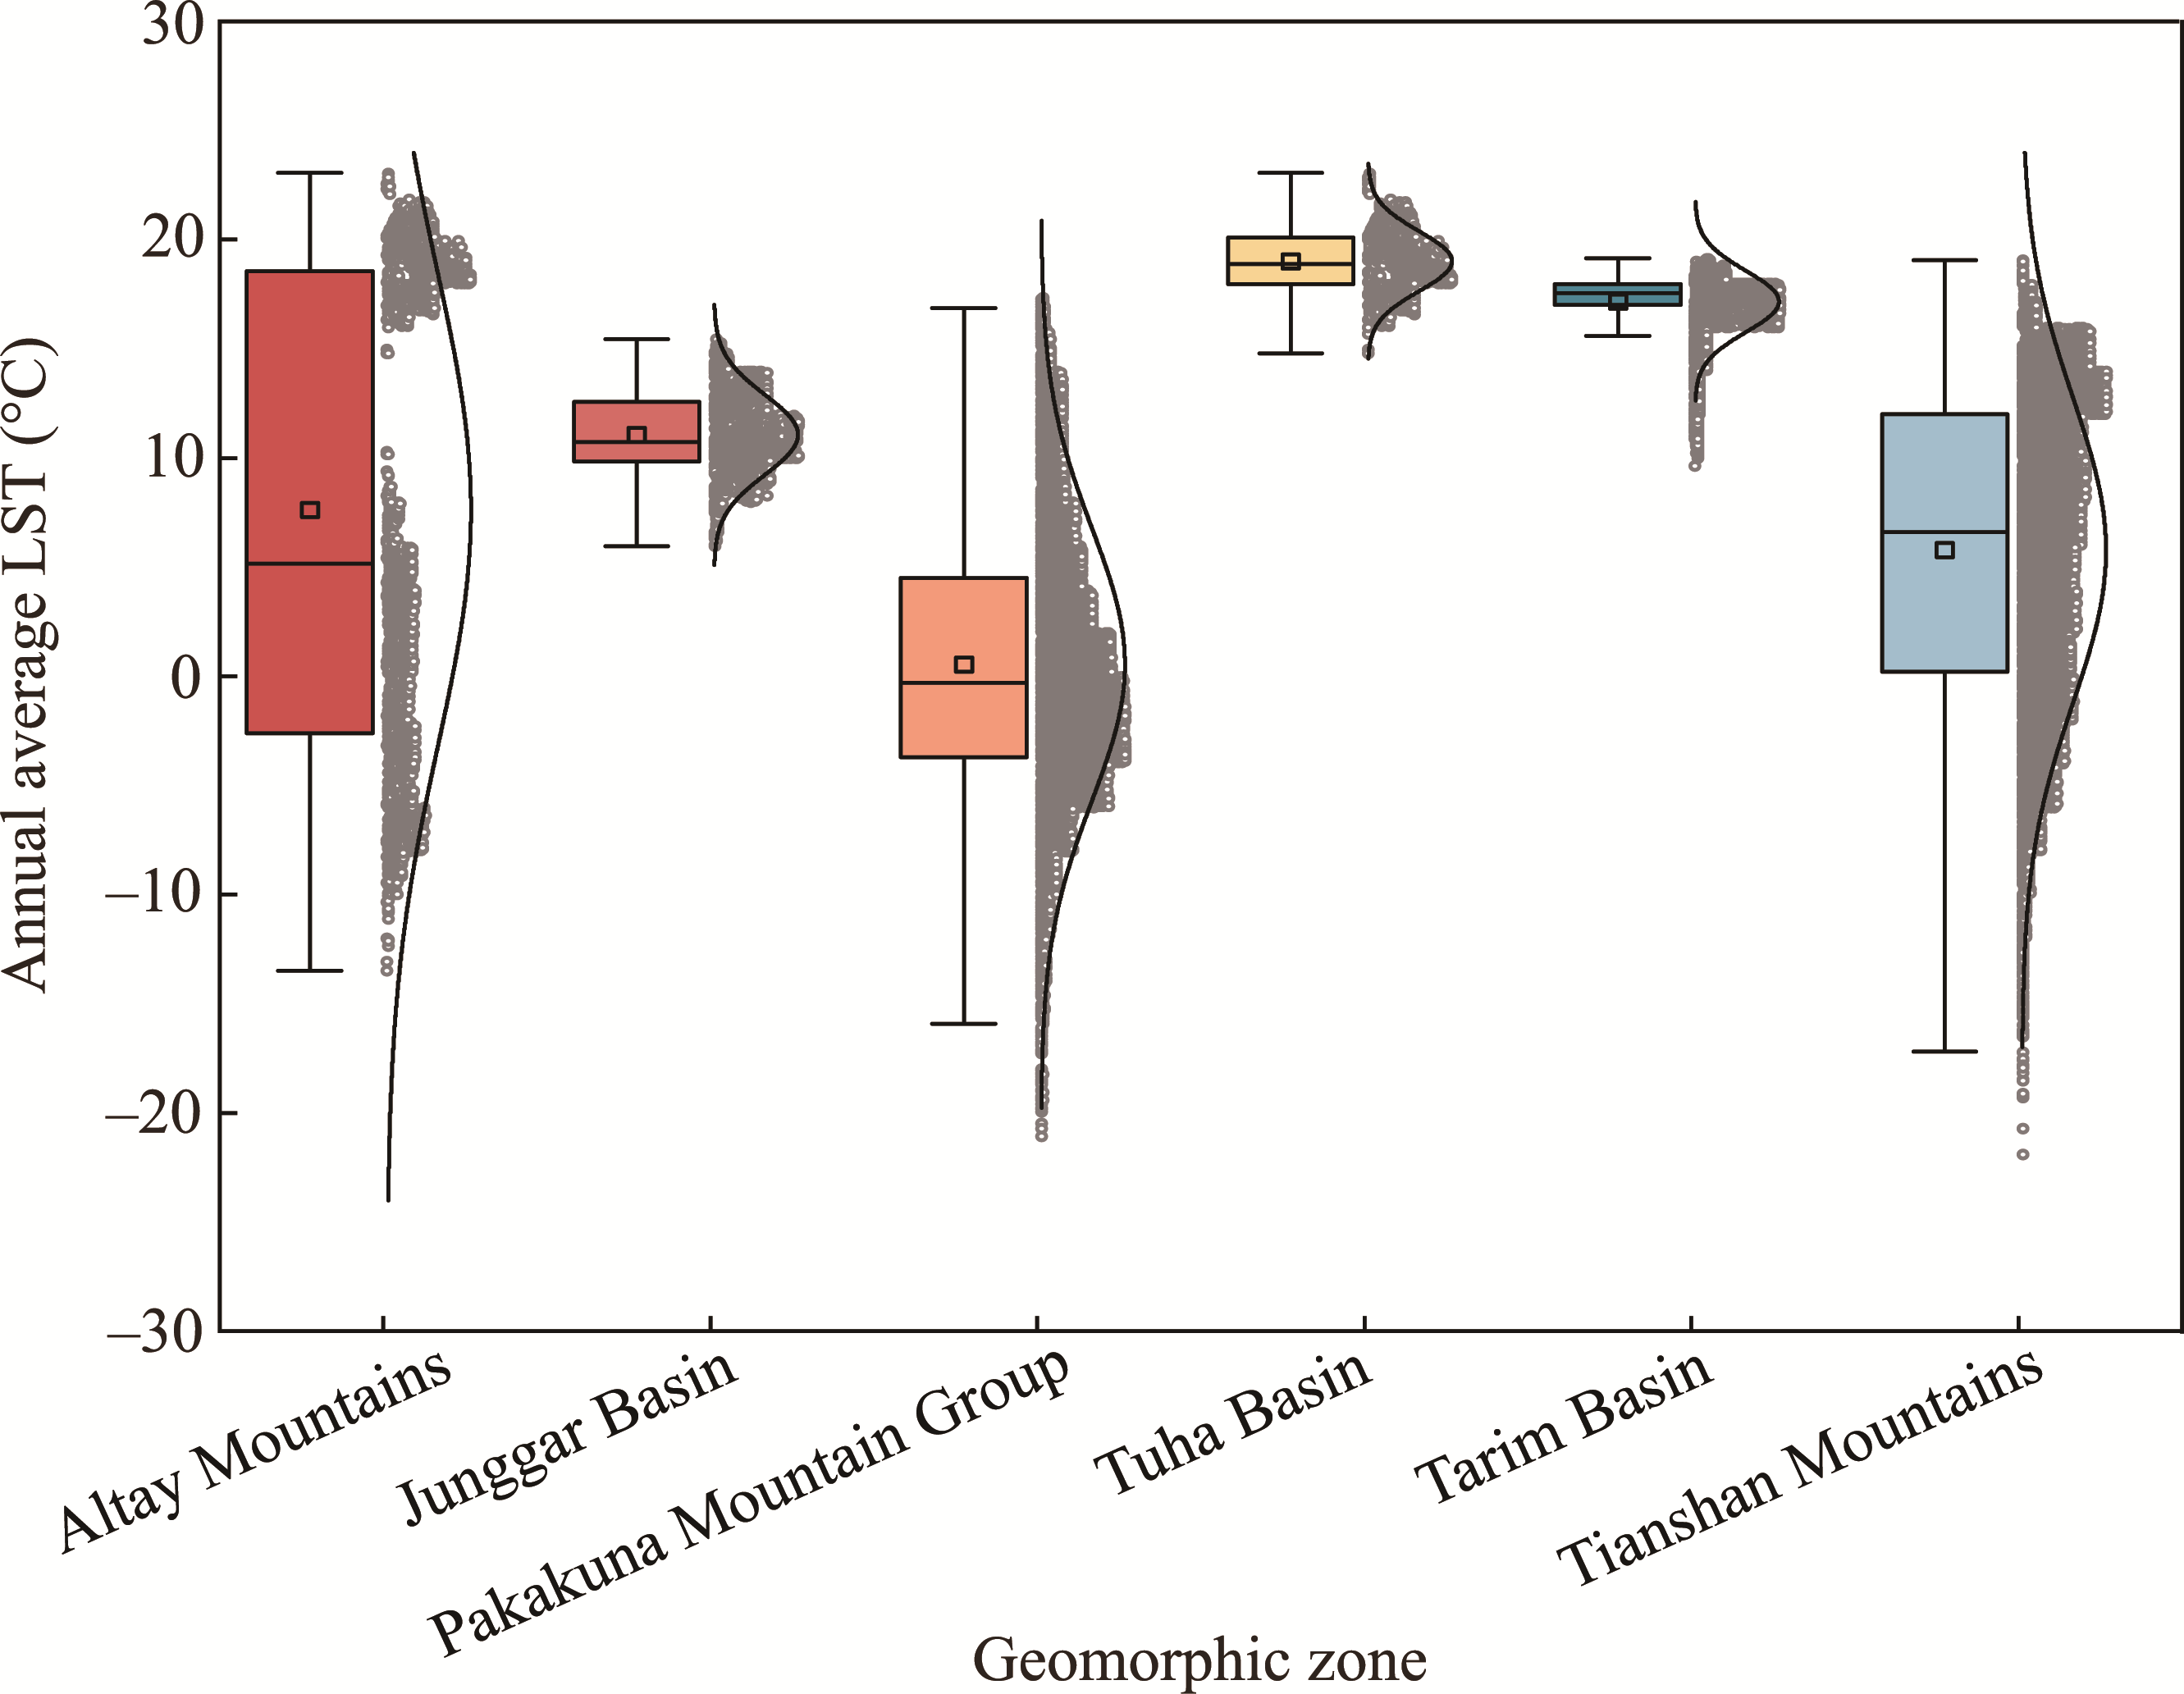
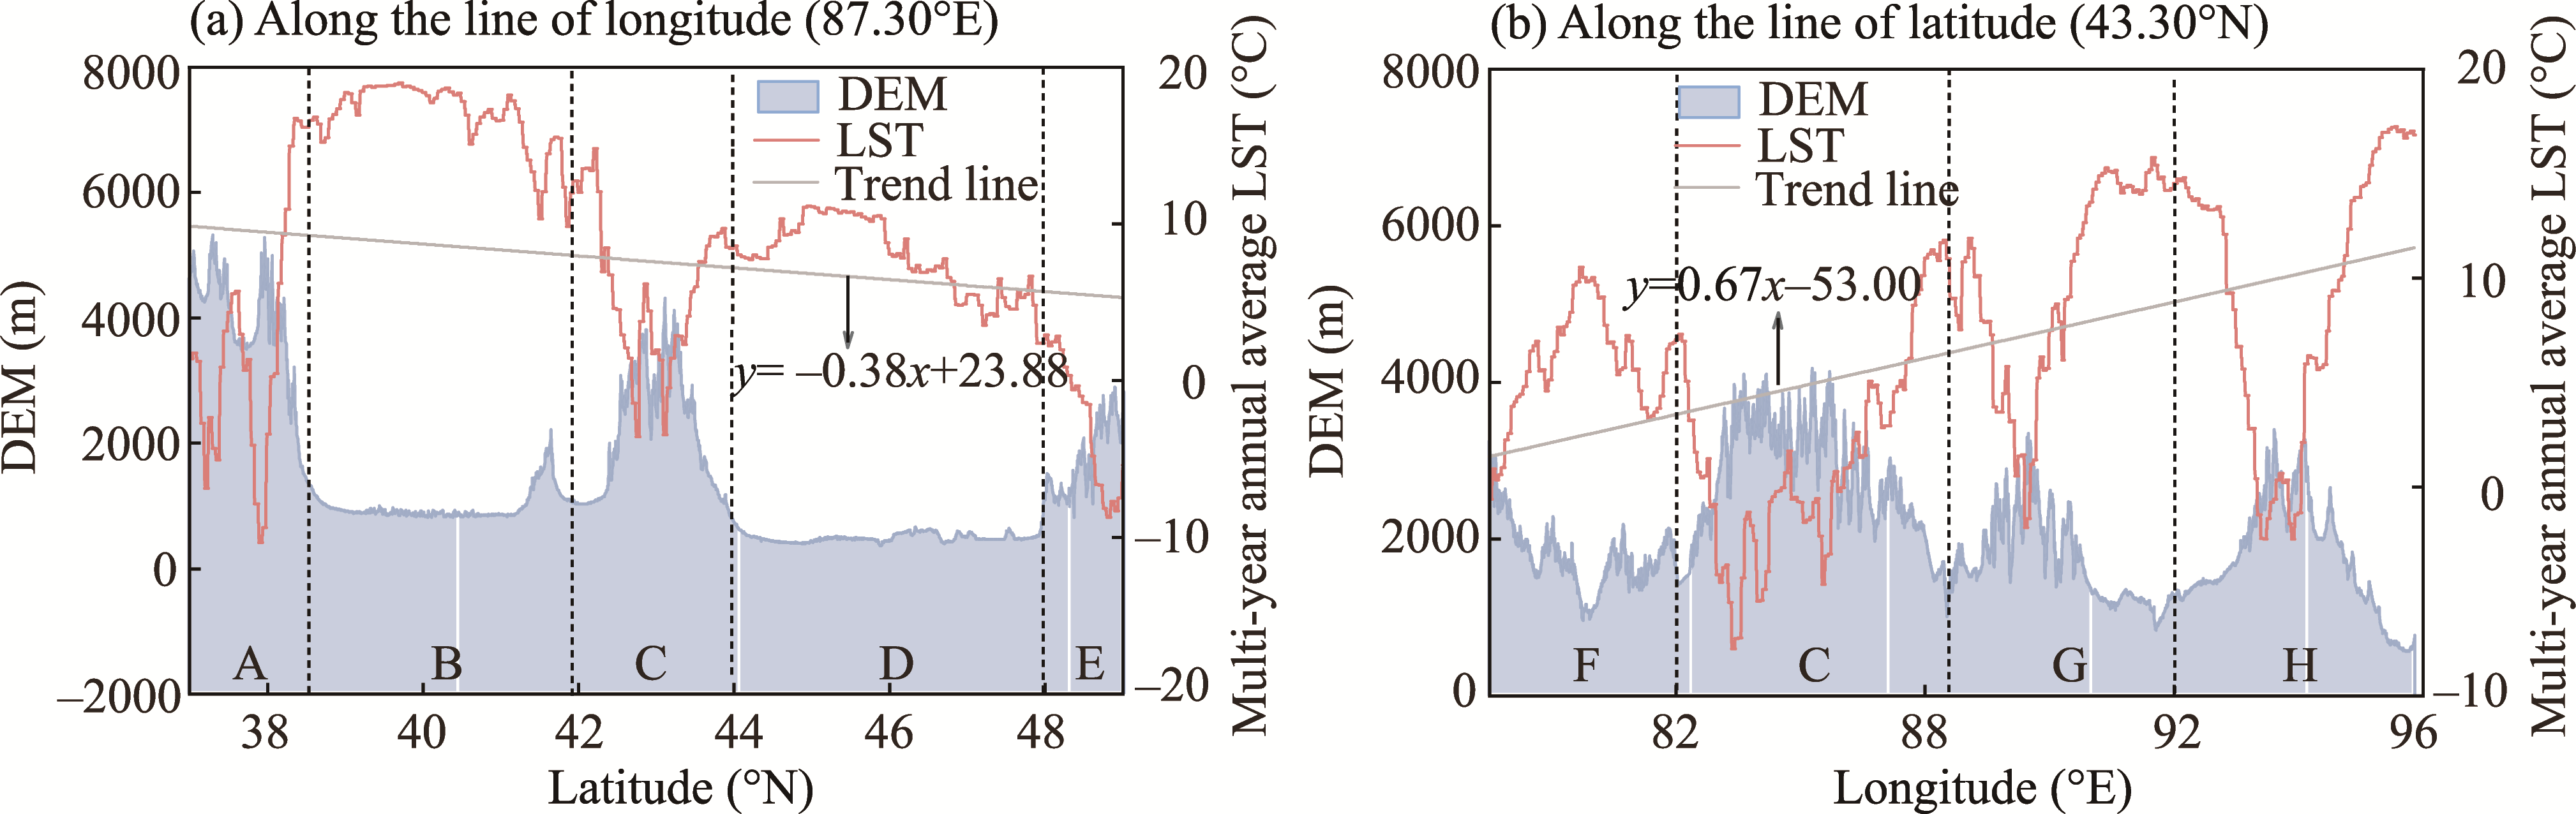
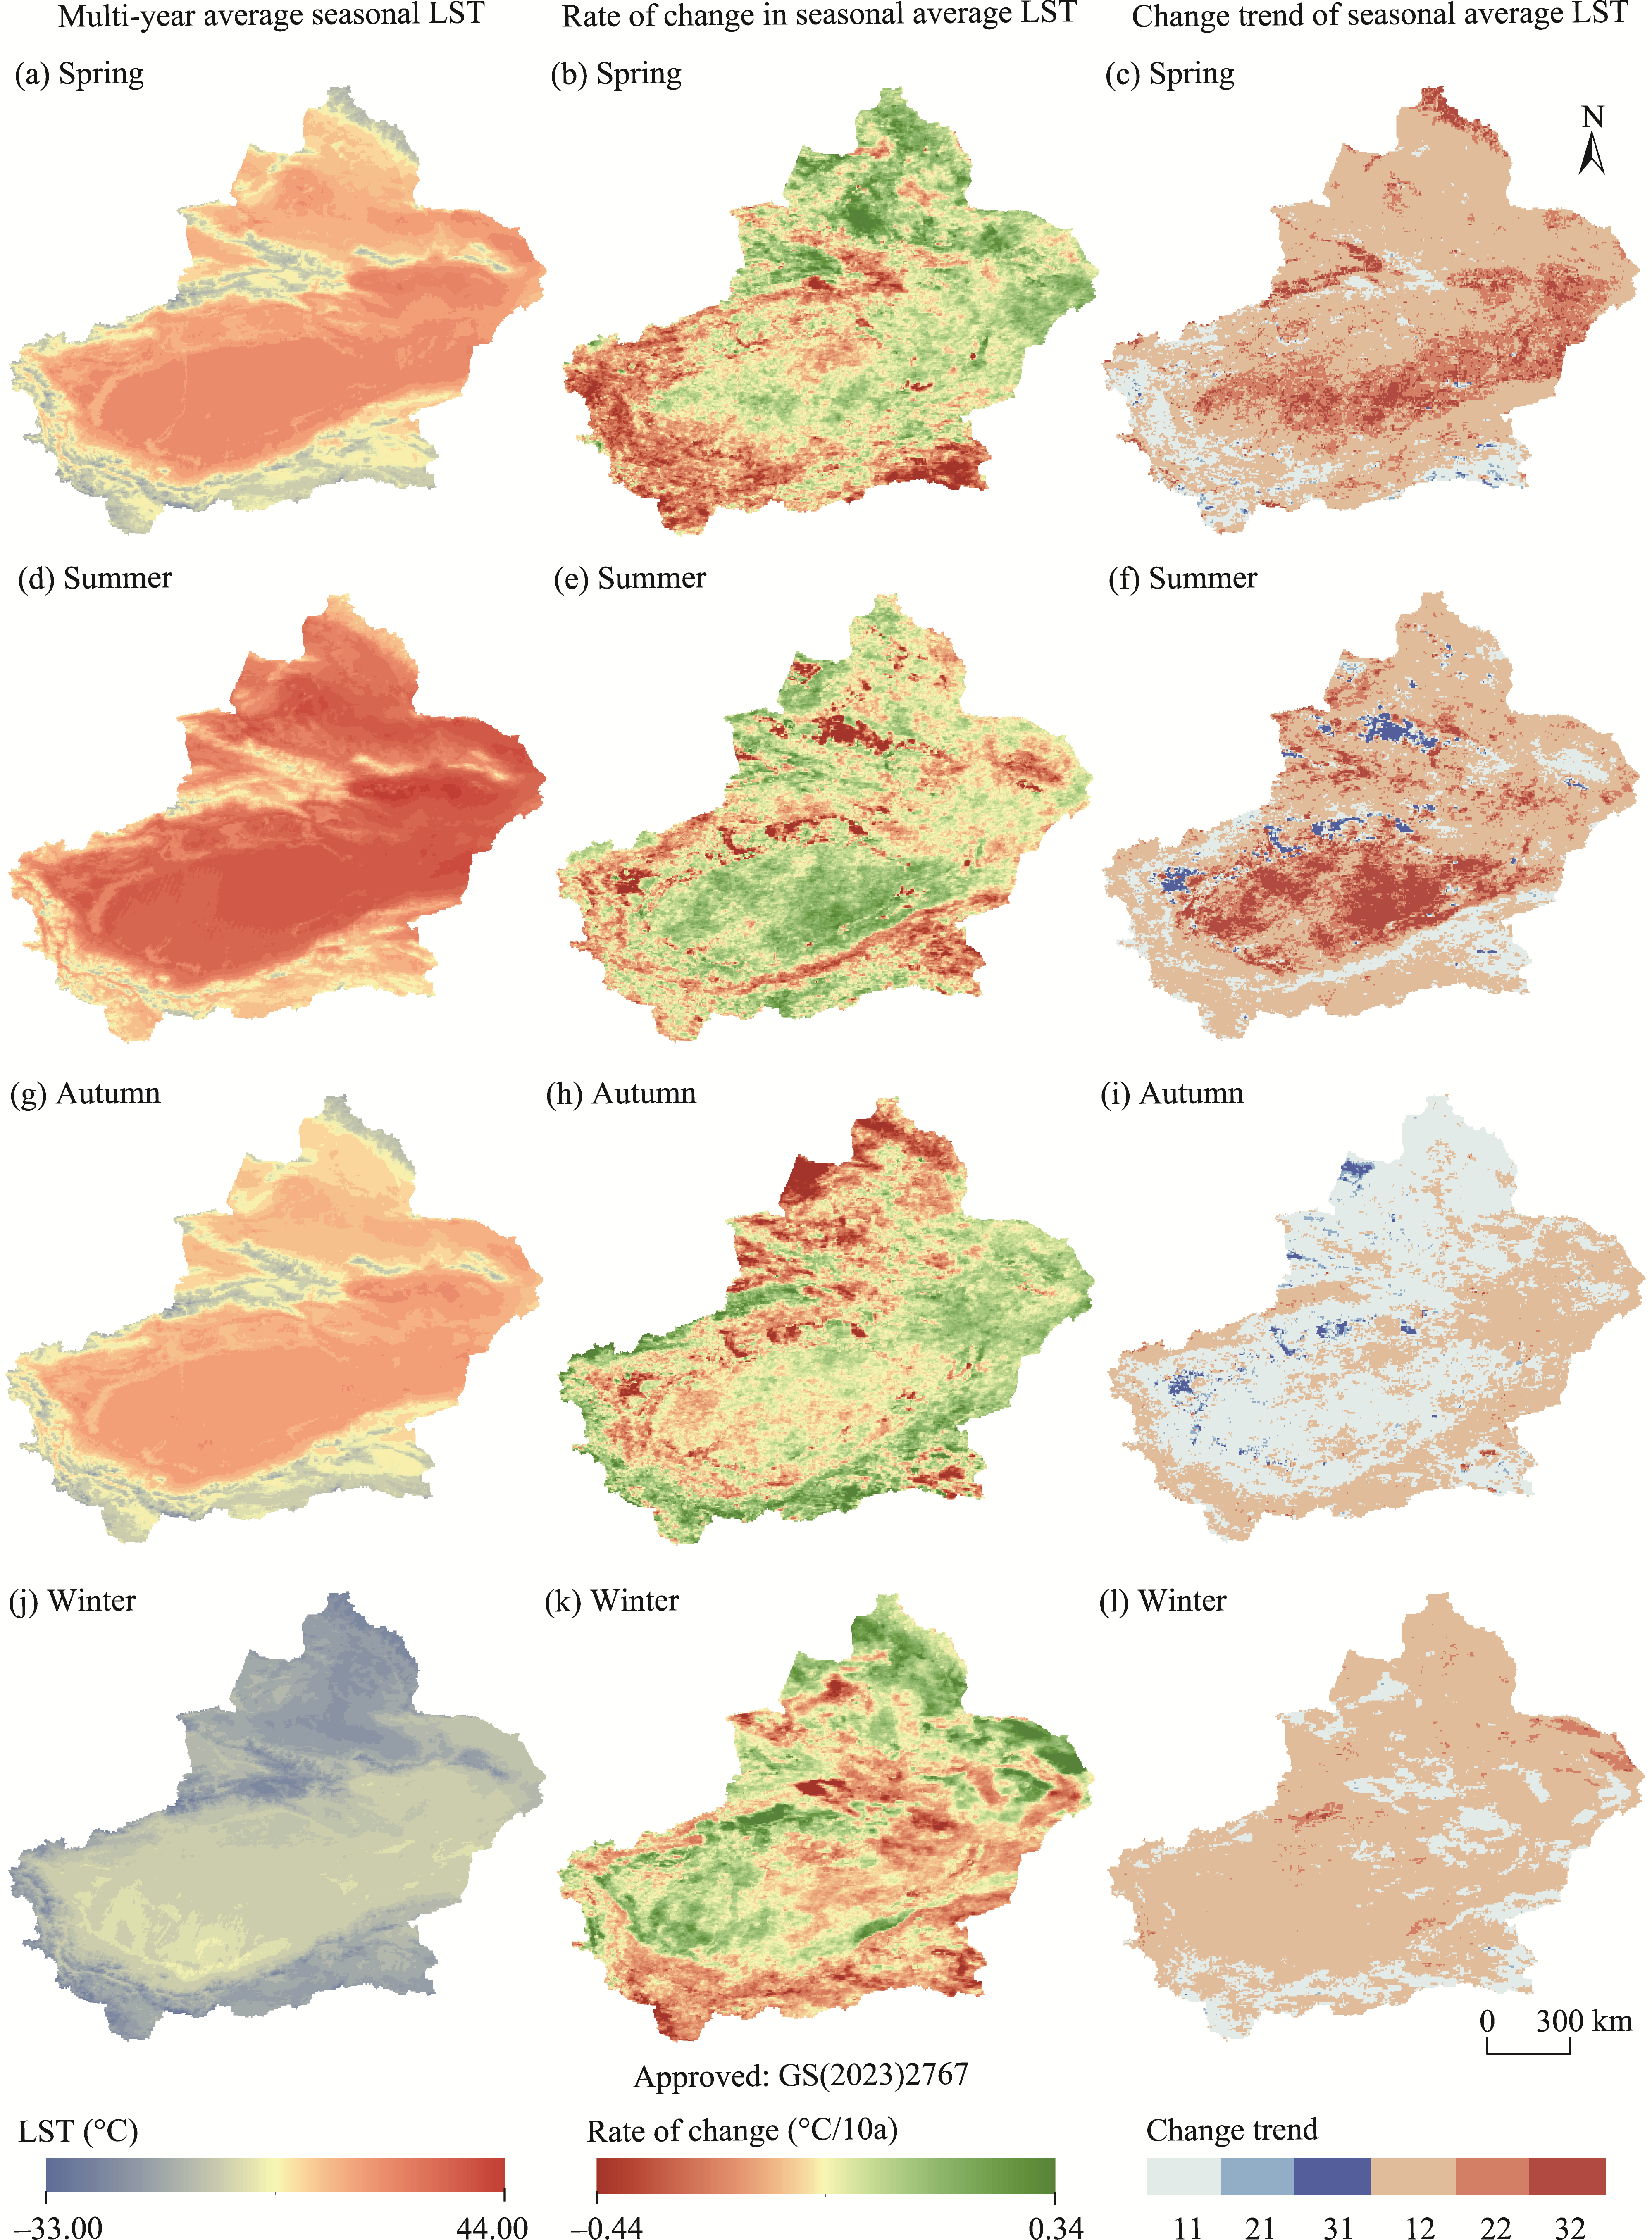
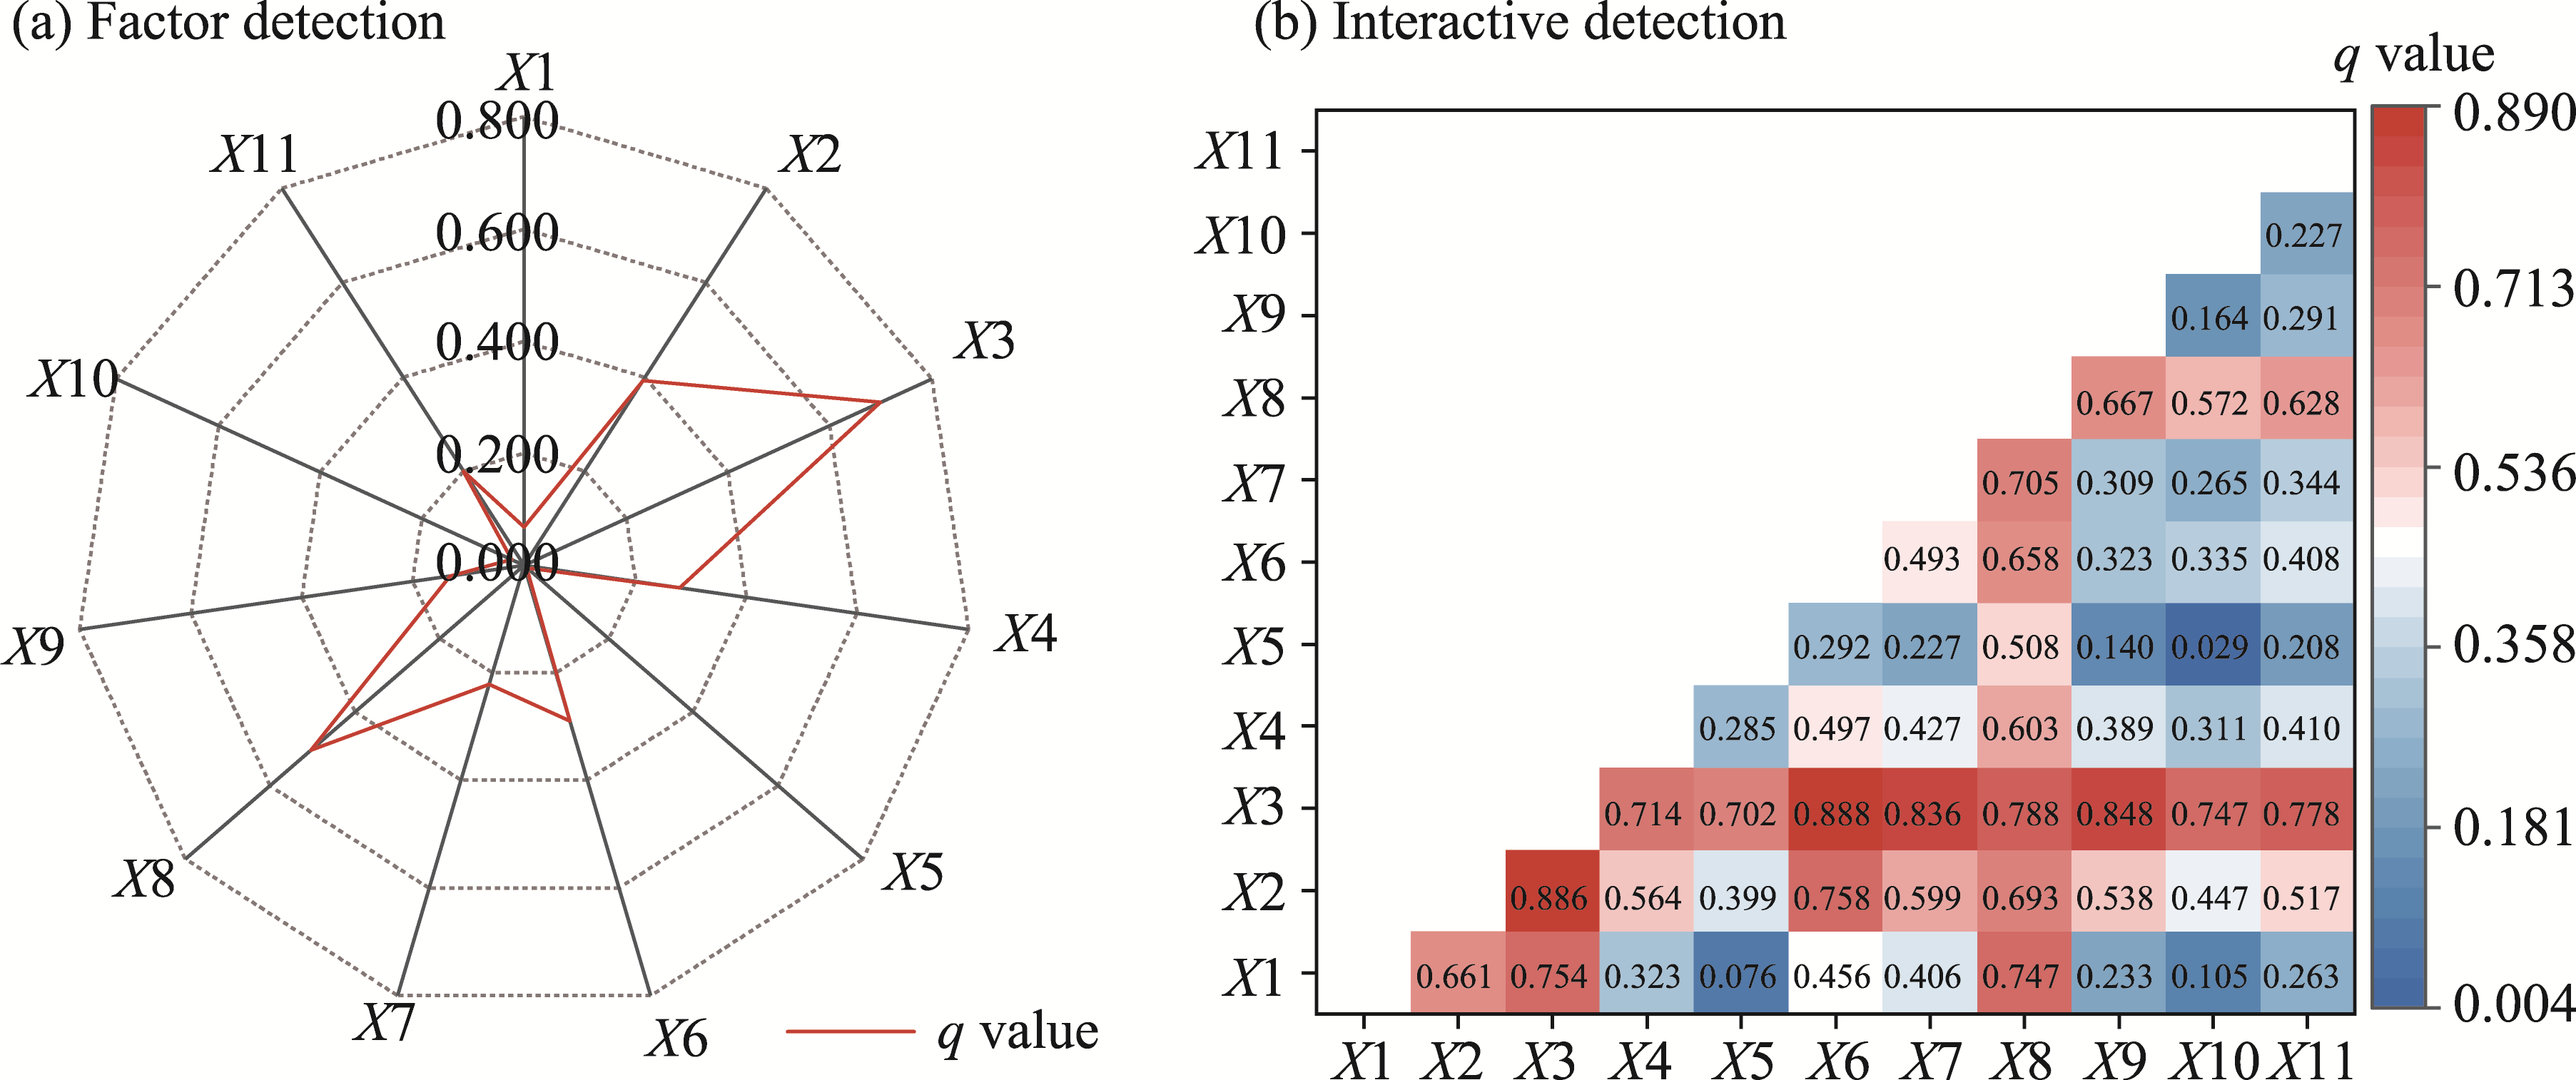
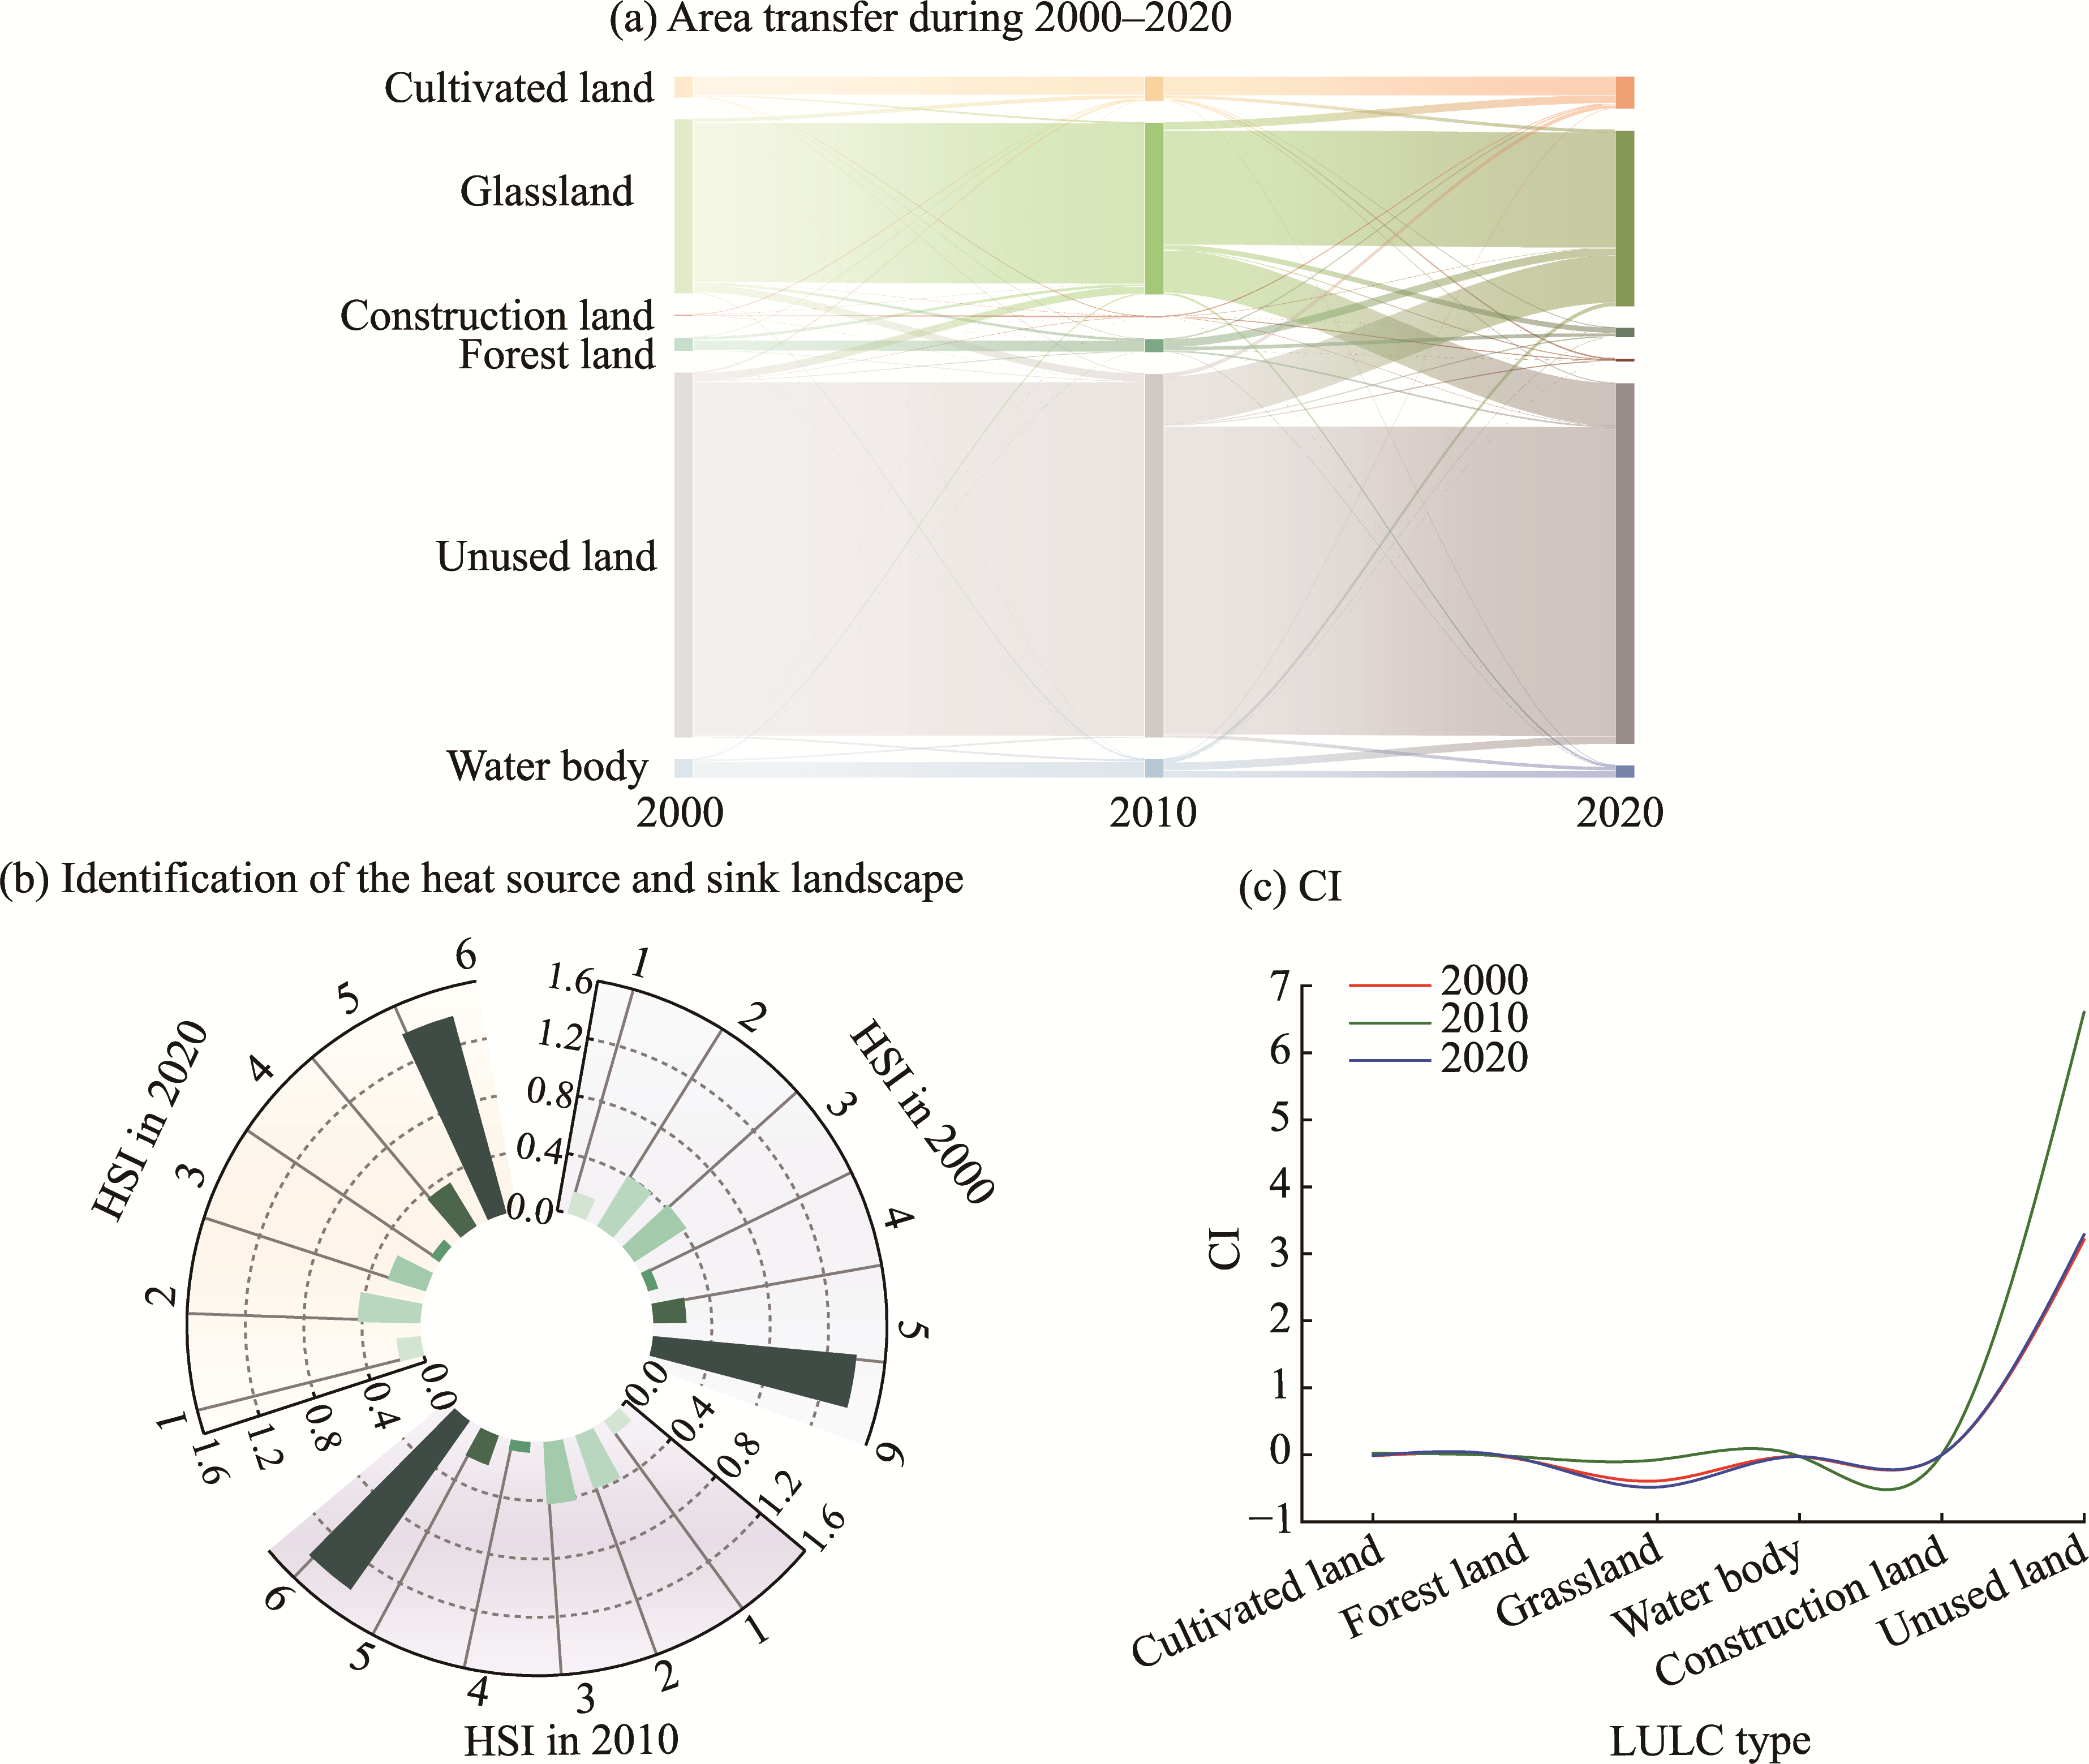
Abstract Land surface temperature (LST) directly affects the energy balance of terrestrial surface systems and impacts regional resources, ecosystem evolution, and ecosystem structures. Xinjiang Uygur Autonomous Region is located at the arid Northwest China and is extremely sensitive to climate change. There is an urgent need to understand the distribution patterns of LST in this area and quantitatively measure the nature and intensity of the impacts of the major driving factors from a spatial perspective, as well as elucidate the formation mechanisms. In this study, we used the MOD11C3 LST product developed on the basis of Moderate Resolution Imaging Spectroradiometer (MODIS) to conduct regression analysis and determine the spatiotemporal variation and differentiation pattern of LST in Xinjiang from 2000 to 2020. We analyzed the driving mechanisms of spatial heterogeneity of LST in Xinjiang and the six geomorphic zones (the Altay Mountains, Junggar Basin, Tianshan Mountains, Tarim Basin, Turpan-Hami (Tuha) Basin, and Pakakuna Mountain Group) using geographical detector (Geodetector) and geographically weighted regression (GWR) models. The warming rate of LST in Xinjiang during the study period was 0.24°C/10a, and the spatial distribution pattern of LST had obvious topographic imprints, with 87.20% of the warming zone located in the Gobi desert and areas with frequent human activities, and the cooling zone mainly located in the mountainous areas. The seasonal LST in Xinjiang was at a cooling rate of 0.09°C/10a in autumn, and showed a warming trend in other seasons. Digital elevation model (DEM), latitude, wind speed, precipitation, normalized difference vegetation index (NDVI), and sunshine duration in the single-factor and interactive detections were the key factors driving the LST changes. The direction and intensity of each major driving factor on the spatial variations of LST in the study area were heterogeneous. The negative feedback effect of DEM on the spatial differentiation of LST was the strongest. Lower latitudes, lower vegetation coverage, lower levels of precipitation, and longer sunshine duration increased LST. Unused land was the main heat source landscape, water body was the most important heat sink landscape, grassland and forest land were the land use and land cover (LULC) types with the most prominent heat sink effect, and there were significant differences in different geomorphic zones due to the influences of their vegetation types, climatic conditions, soil types, and human activities. The findings will help to facilitate sustainable climate change management, analyze local climate and environmental patterns, and improve land management strategies in Xinjiang and other arid areas.
|
|
Received: 20 October 2023
Published: 31 March 2024
|
|
Corresponding Authors:
*ZHANG Zhengyong (E-mail: zyz0815@163.com)
|
| About author: First author contact: The first and second authors contributed equally to this work. |
| Cite this article:
ZHANG Mingyu, CAO Yu, ZHANG Zhengyong, ZHANG Xueying, LIU Lin, CHEN Hongjin, GAO Yu, YU Fengchen, LIU Xinyi. Spatiotemporal variation of land surface temperature and its driving factors in Xinjiang, China. Journal of Arid Land, 2024, 16(3): 373-395.
URL:
http://jal.xjegi.com/10.1007/s40333-024-0072-5 OR http://jal.xjegi.com/Y2024/V16/I3/373
|
|
|
| [1] |
Ampatzidis P, Kershaw T. 2020. A review of the impact of blue space on the urban microclimate. Science of the Total Environment, 730: 139068, doi: 10.1016/j.scitotenv.2020.139068.
|
|
|
| [2] |
Anderson M C, Norman J M, Kustas W P, et al. 2008. A thermal-based remote sensing technique for routine mapping of land-surface carbon, water and energy fluxes from field to regional scales. Remote Sensing of Environment, 112(12): 4227-4241.
doi: 10.1016/j.rse.2008.07.009
|
|
|
| [3] |
Bogren J, Gustavsson T. 1991. Nocturnal air and road surface temperature variations in complex terrain. International Journal of Climatology, 11(4): 443-455.
doi: 10.1002/joc.v11:4
|
|
|
| [4] |
Bonan G B. 2008. Forests and climate change: Forcings, feedbacks, and the climate benefits of forests. Science, 320(5882): 1444-1449.
doi: 10.1126/science.1155121
pmid: 18556546
|
|
|
| [5] |
Brenning A, Peña M A, Long S, et al. 2012. Thermal remote sensing of ice-debris landforms using ASTER: An example from the Chilean Andes. The Cryosphere, 6(2): 367-382.
doi: 10.5194/tc-6-367-2012
|
|
|
| [6] |
Brunsdon C, Fotheringham A S, Charlton M E. 1996. Geographically weighted regression: A method for exploring spatial nonstationarity. Geographical Analysis, 28(4): 281-298.
doi: 10.1111/gean.1996.28.issue-4
|
|
|
| [7] |
Chen H J, Liu L, Zhang Z Y, et al. 2022a. Spatio-temporal correlation between human activity intensity and land surface temperature on the north slope of Tianshan Mountains. Journal of Geographical Sciences, 32(10): 1935-1955.
doi: 10.1007/s11442-022-2030-5
|
|
|
| [8] |
Chen Y, Baishan J, Shao W, et al. 2022b. Influence of Arctic Oscillation on winter temperature in Xinjiang under climate warming background. Journal of Arid Meteorology, 40(2): 195-201. (in Chinese)
|
|
|
| [9] |
Chi Q, Zhou S H, Wang L J, et al. 2021. Quantifying the contribution of LUCC to surface energy budget: A case study of four typical cities in the Yellow River Basin in China. Atmosphere, 12(11): 1374, doi: 10.3390/atmos12111374.
|
|
|
| [10] |
De Wekker S F J, Zhong S Y, Fast J D, et al. 1998. A numerical study of the thermally driven plain-to-basin wind over idealized basin topographies. Journal of Applied Meteorology and Climatology, 37(6): 606-622.
|
|
|
| [11] |
Dong D W, Tao H, Ding G, et al. 2022. Historical population and cropland exposure to heatwaves in Xinjiang, China. Transactions of the Chinese Society of Agricultural Engineering, 38(5): 288-295. (in Chinese)
|
|
|
| [12] |
Dong L P. 2012. Estimation of surface air temperature from MODIS land surface temperature and its application to the study of urban heat island in the East China Metropolitan Area. MSc Thesis. Nanjing: Nanjing University of Information Science and Technology. (in Chinese)
|
|
|
| [13] |
Fu Q, Li B, Hou Y, et al. 2017. Effects of land use and climate change on ecosystem services in Central Asia's arid regions: A case study in Altay Prefecture, China. Science of the Total Environment, 607-608: 633-646.
|
|
|
| [14] |
Garratt J R. 1994. Review: The atmospheric boundary layer. Earth-Science Reviews, 37(1-2): 89-134.
doi: 10.1016/0012-8252(94)90026-4
|
|
|
| [15] |
Grimmond C S B, Oke T R. 1999. Aerodynamic properties of urban areas derived from analysis of surface form. Journal of Applied Meteorology and Climatology, 38(9): 1262-1292.
|
|
|
| [16] |
Hachem S, Duguay C R, Allard M. 2012. Comparison of MODIS-derived land surface temperatures with ground surface and air temperature measurements in continuous permafrost terrain. The Cryosphere, 6(1): 51-69.
doi: 10.5194/tc-6-51-2012
|
|
|
| [17] |
Han J, Rui Y, Yang K, et al. 2020. Quantitative attribution of national key town layout based on Geodetector and the geographically weighted regression model. Progress in Geography, 39(10): 1687-1697. (in Chinese)
doi: 10.18306/dlkxjz.2020.10.008
|
|
|
| [18] |
Hu R J. 2004. Physical Geography of the Tianshan Mountains in China (2nd ed.). Beijing: China Environmental Science Press, 70-77. (in Chinese)
|
|
|
| [19] |
Hu T, van Dijk A I J M, Renzullo L J, et al. 2020. On agricultural drought monitoring in Australia using Himawari-8 geostationary thermal infrared observations. International Journal of Applied Earth Observation and Geoinformation, 91: 102153, doi: 10.1016/j.jag.2020.102153.
|
|
|
| [20] |
Huang F F, Ma W Q, Li M S, et al. 2016. Analysis on responses of land surface temperature on the northern Tibetan Plateau to climate change. Plateau Meteorology, 35(1): 55-63. (in Chinese)
doi: 10.7522/j.issn.1000-0534.2015.00075
|
|
|
| [21] |
Kang Z W, Zhang Z Z, Liu L, et al. 2022. Spatio-temporal variation characteristics of land surface temperature in Xinjiang based on MODIS. Geographical Research, 41(4): 997-1017. (in Chinese)
doi: 10.11821/dlyj020210232
|
|
|
| [22] |
Khan J, Wang P X, Xie Y, et al. 2018. Mapping MODIS LST NDVI imagery for drought monitoring in Punjab Pakistan. IEEE Access, 6: 19898-19911.
doi: 10.1109/Access.6287639
|
|
|
| [23] |
Li K R, Wang S Q, Cao M K. 2004. Vegetation and soil carbon storage in China. Science in China Series D-Earth Sciences, 47(1): 49-57.
doi: 10.1360/02yd0029
|
|
|
| [24] |
Li Q X, Sun W B, Huang B Y, et al. 2020. Consistency of global warming trends strengthened since 1880s. Science Bulletin, 65(20): 1709-1712.
doi: 10.1016/j.scib.2020.06.009
pmid: 36659242
|
|
|
| [25] |
Li Z L, Tang B H, Wu H, et al. 2013. Satellite-derived land surface temperature: Current status and perspectives. Remote Sensing of Environment, 131: 14-37.
doi: 10.1016/j.rse.2012.12.008
|
|
|
| [26] |
Liu L, Liu P X, Zhang W X, et al. 2021. Variation characteristics of extreme warm events from 1961 to 2017 and projection for future scenarios in Xinjiang, China. Arid Zone Research, 38(6): 1590-1600. (in Chinese)
|
|
|
| [27] |
Mao D L, Cai F Y, Lei J Q, et al. 2017. Spatial analysis on changes of microclimate in typical landscapes in desert-wilderness-oasis in Cele, Xinjiang Scientia Geographica Sinica, 37(4): 630-640. (in Chinese)
doi: 10.13249/j.cnki.sgs.2017.04.017
|
|
|
| [28] |
Ning S, Zhang Z Y, Liu L, et al. 2020. Adaptability of precipitation estimation method based on TRMM data combined with partial least squares downscaling in different landforms of Xinjiang, China. Transactions of the Chinese Society of Agricultural Engineering, 36(12): 99-109. (in Chinese)
|
|
|
| [29] |
Pan N H, Guan Q Y, Wang Q Z, et al. 2021. Spatial differentiation and driving mechanisms in ecosystem service value of arid region:A case study in the middle and lower reaches of Shule River Basin, NW China. Journal of Cleaner Production, 319: 128718, doi: 10.1016/j.jclepro.2021.128718.
|
|
|
| [30] |
Portela C I, Massi K G, Rodrigues T, et al. 2020. Impact of urban and industrial features on land surface temperature: Evidences from satellite thermal indices. Sustainable Cities and Society, 56: 102100, doi: 10.1016/j.scs.2020.102100.
|
|
|
| [31] |
Qiao Z, Huang N Y, Xu X L, et al. 2019. Spatio-temporal pattern and evolution of the urban thermal landscape in metropolitan Beijing between 2003 and 2017. Acta Geographica Sinica, 74(3): 475-489. (in Chinese)
doi: 10.11821/dlxb201903006
|
|
|
| [32] |
Qu Y, Liu Q, Liang S L, et al. 2014. Direct-estimation algorithm for mapping daily land-surface broadband albedo from MODIS data. IEEE Transactions on Geoscience and Remote Sensing, 52(2): 907-919.
doi: 10.1109/TGRS.2013.2245670
|
|
|
| [33] |
Ren T, Zhou W Q, Wang J. 2021. Beyond intensity of urban heat island effect: A continental scale analysis on land surface temperature in major Chinese cities. Science of the Total Environment, 791: 148334, doi: 10.1016/j.scitotenv.2021.148334.
|
|
|
| [34] |
Sfîcă L, Corocăescu A C, Crețu C Ș, et al. 2023. Spatiotemporal features of the surface urban heat island of Bacau City (Romania) during the warm season and local trends of LST imposed by land use changes during the last 20 years. Remote Sensing, 15(13): 3385, doi: 10.3390/rs15133385.
|
|
|
| [35] |
Shi Y F, Cheng G D. 1991. Cryosphere and global change. Bulletin of Chinese Academy of Sciences, (4): 287-291. (in Chinese)
|
|
|
| [36] |
Tian H, Liu L, Zhang Z Y, et al. 2022. Spatiotemporal diversity of land surface temperature in China from 2001 to 2020. Acta Geographica Sinica, 77(7): 1713-1729. (in Chinese)
|
|
|
| [37] |
Townshend J R G, Justice C O, Skole D, et al. 1994. The 1 km resolution global data set: Needs of the International Geosphere Biosphere Programme. International Journal of Remote Sensing, 15(17): 3417-3441.
doi: 10.1080/01431169408954338
|
|
|
| [38] |
Wan G N, Yang M X, Wang X J. 2012. Variations in soil temperature at BJ site on the central Tibetan Plateau. Journal of Mountain Science, 9(2): 274-285.
doi: 10.1007/s11629-012-2147-6
|
|
|
| [39] |
Wang J F, Xu C D. 2017. Geodetector: Principle and prospective. Acta Geographica Sinica, 72(1): 116-134. (in Chinese)
doi: 10.11821/dlxb201701010
|
|
|
| [40] |
Wang L L, Gao Z Q, Miao S G, et al. 2015. Contrasting characteristics of the surface energy balance between the urban and rural areas of Beijing. Advances in Atmospheric Sciences, 32: 505-514.
doi: 10.1007/s00376-014-3222-4
|
|
|
| [41] |
Wei B C, Bao Y H, Yu S, et al. 2021. Analysis of land surface temperature variation based on MODIS data a case study of the agricultural pastural ecotone of northern China. International Journal of Applied Earth Observation and Geoinformation, 100: 102342, doi: 10.1016/j.jag.2021.102342.
|
|
|
| [42] |
Wu J S, He H S, Hu T. 2022. Analysis of factors influencing the "source-sink" landscape contribution of land surface temperature. Acta Geographica Sinica, 77(1): 51-65. (in Chinese)
doi: 10.11821/dlxb202201004
|
|
|
| [43] |
Xi M Z, Zhang W, Li W L, et al. 2023. Distinguishing dominant drivers on LST dynamics in the Qinling-Daba Mountains in Central China from 2000 to 2020. Remote Sensing, 15(4): 878, doi: 10.3390/rs15040878.
|
|
|
| [44] |
Yang Z W, Chen Y B, Guo G H, et al. 2021. Characteristics of land surface temperature clusters: Case study of the central urban area of Guangzhou. Sustainable Cities and Society, 73: 103140, doi: 10.1016/j.scs.2021.103140.
|
|
|
| [45] |
Yu Z. 2017. Changes of ground temperature in Sichuan and evaluation model. PhD Dissertation. Chengdu: Chengdu University of Technology. (in Chinese)
|
|
|
| [46] |
Yu Z W, Chen T T, Yang G Y, et al. 2020. Quantifying seasonal and diurnal contributions of urban landscapes to heat energy dynamics. Applied Energy, 264: 114724, doi: 10.1016/j.apenergy.2020.114724.
|
|
|
| [47] |
Yue S P, Yan Y C, Zhang S W, et al. 2021. Spatiotemporal variations of soil freeze-thaw state in Northeast China based on the ERA5-LAND dataset. Acta Geographica Sinica, 76(11): 2765-2779. (in Chinese)
doi: 10.11821/dlxb202111012
|
|
|
| [48] |
Zeng J. 2015. Remote sensing monitoring of land use change impacts on land surface temperature. MSc Thesis. Guilin: Guangxi Normal University. (in Chinese)
|
|
|
| [49] |
Zeng L L, Wardlow B D, Tadesse T, et al. 2015. Estimation of daily air temperature based on MODIS land surface temperature products over the Corn Belt in the US. Remote Sensing, 7(1): 951-970.
|
|
|
| [50] |
Zeng Y, Qiu X F, Liu C M, et al. 2005. Distributed modelling of direct solar radiation of rugged terrain over the Yellow River Basin. Acta Geographica Sinica, 60(4): 680-688. (in Chinese)
doi: 10.11821/xb200504017
|
|
|
| [51] |
Zhang F, Tiyip T, Kung H, et al. 2016. Dynamics of land surface temperature (LST) in response to land use and land cover (LULC) changes in the Weigan and Kuqa river oasis, Xinjiang, China. Arabian Journal of Geosciences, 9: 499, doi: 10.1007/s12517-016-2521-8.
|
|
|
| [52] |
Zhang F F, Peng K, Zhang F. 2022. Spatial distribution characteristics of land surface temperature and its "source-sink" effect in Yanqi Basin, Xinjiang. Transactions of the Chinese Society of Agricultural Engineering, 38(16): 153-161. (in Chinese)
|
|
|
| [53] |
Zhang G L, Xiao X M, Dong J W, et al. 2015. Mapping paddy rice planting areas through time series analysis of MODIS land surface temperature and vegetation index data. ISPRS Journal of Photogrammetry and Remote Sensing, 106: 157-171.
pmid: 27667901
|
|
|
| [54] |
Zhang M Y, Zhang Z Y, Liu L, et al. 2023. Spatio-temporal pattern and attribution analysis of mass elevation effect in Tianshan Mountains of China. Acta Geographica Sinica, 78(05): 1254-1270. (in Chinese)
|
|
|
| [55] |
Zhang Q, Xu C Y, Zhang Z X, et al. 2009. Changes of temperature extremes for 1960-2004 in Far-West China. Stochastic Environmental Research and Risk Assessment, 23: 721-735.
doi: 10.1007/s00477-008-0252-4
|
|
|
| [56] |
Zhang Z Y, Liu L, He X L, et al. 2019. Evaluation on glaciers ecological services value in the Tianshan Mountains, Northwest China. Journal of Geographical Sciences, 29: 101-114.
doi: 10.1007/s11442-019-1586-1
|
|
|
| [57] |
Zheng K Y, Tan L S, Sun Y W, et al. 2021. Impacts of climate change and anthropogenic activities on vegetation change: Evidence from typical areas in China. Ecological Indicators, 126: 107648, doi: 10.1016/j.ecolind.2021.107648.
|
|
|
| [58] |
Zhou J, Zhang X, Zhan W F, et al. 2014. Land surface temperature retrieval from MODIS data by integrating regression models and the genetic algorithm in an arid region. Remote Sensing, 6(6): 5344-5367.
doi: 10.3390/rs6065344
|
|
|
|
Viewed |
|
|
|
Full text
|
|
|
|
|
Abstract
|
|
|
|
|
Cited |
|
|
|
|
| |
Shared |
|
|
|
|
| |
Discussed |
|
|
|
|