|
|
|
| Characteristics of snow cover distribution along railway subgrade and the protective effect of snow fences |
LEI Jia, CHENG Jianjun*( ), GAO Li, MA Benteng, AN Yuanfeng, DONG Hongguang ), GAO Li, MA Benteng, AN Yuanfeng, DONG Hongguang |
| College of Water Conservancy & Architectural Engineering, Shihezi University, Shihezi 832003, China |
|
|
|
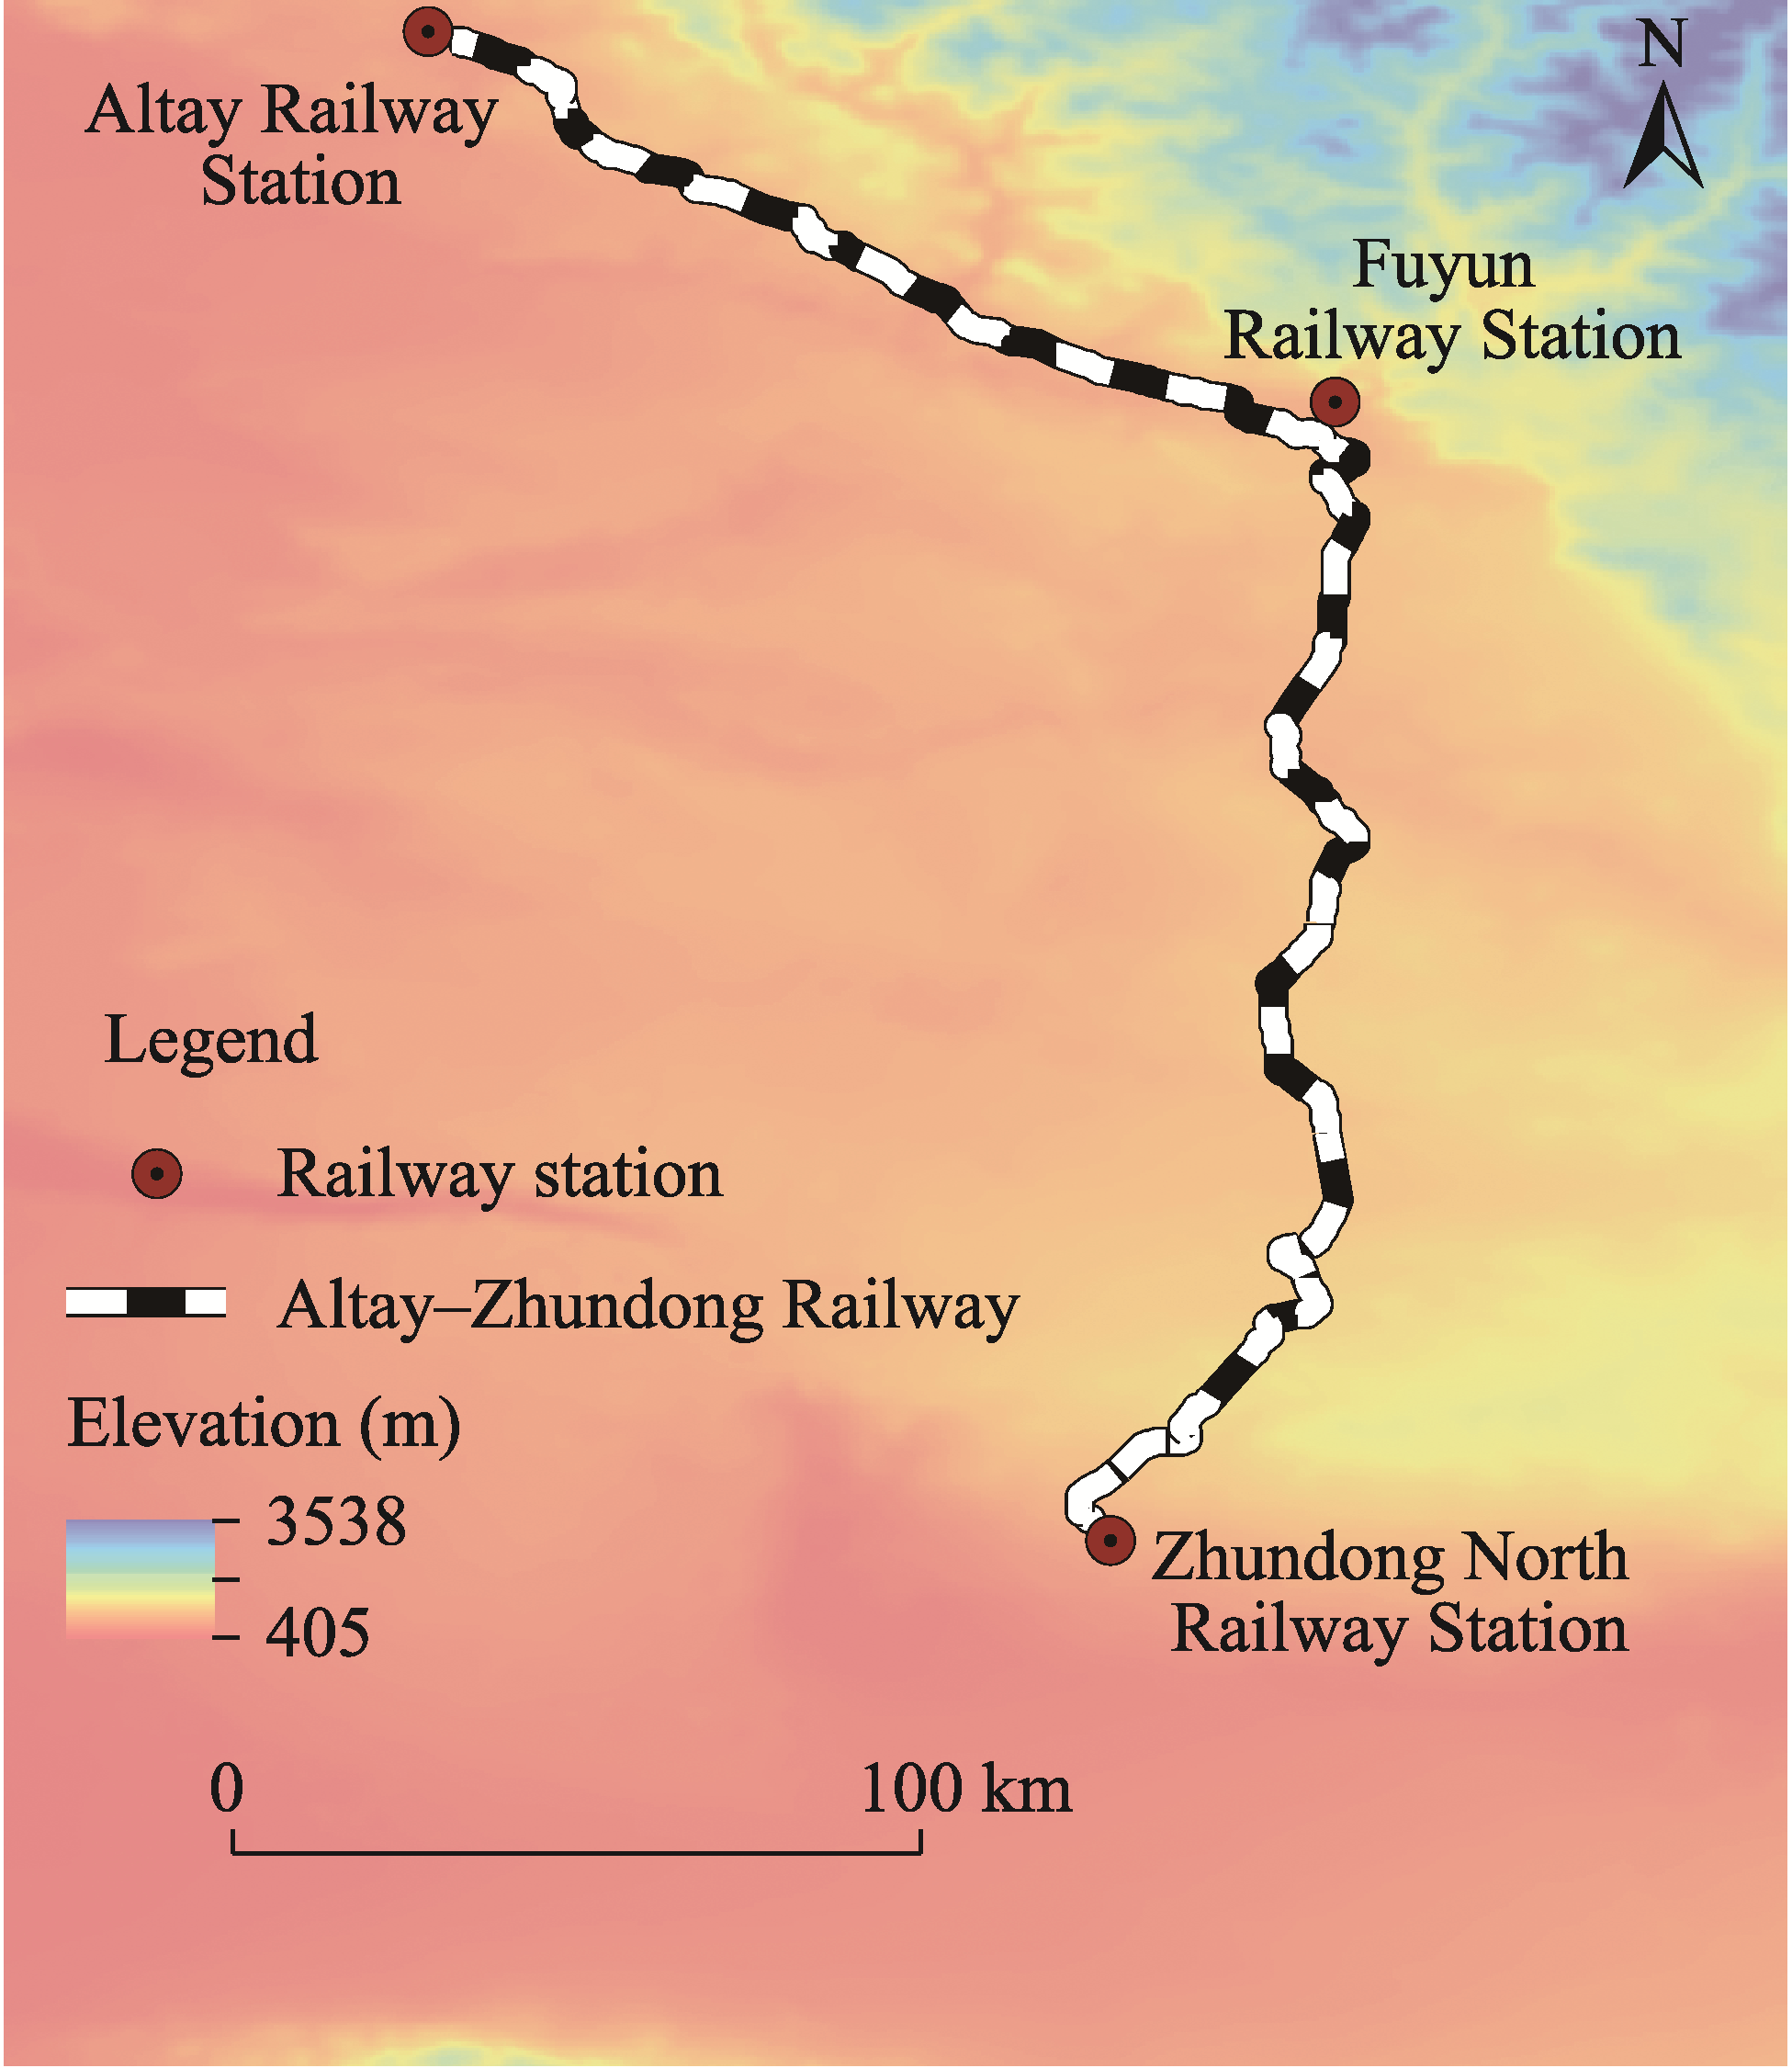
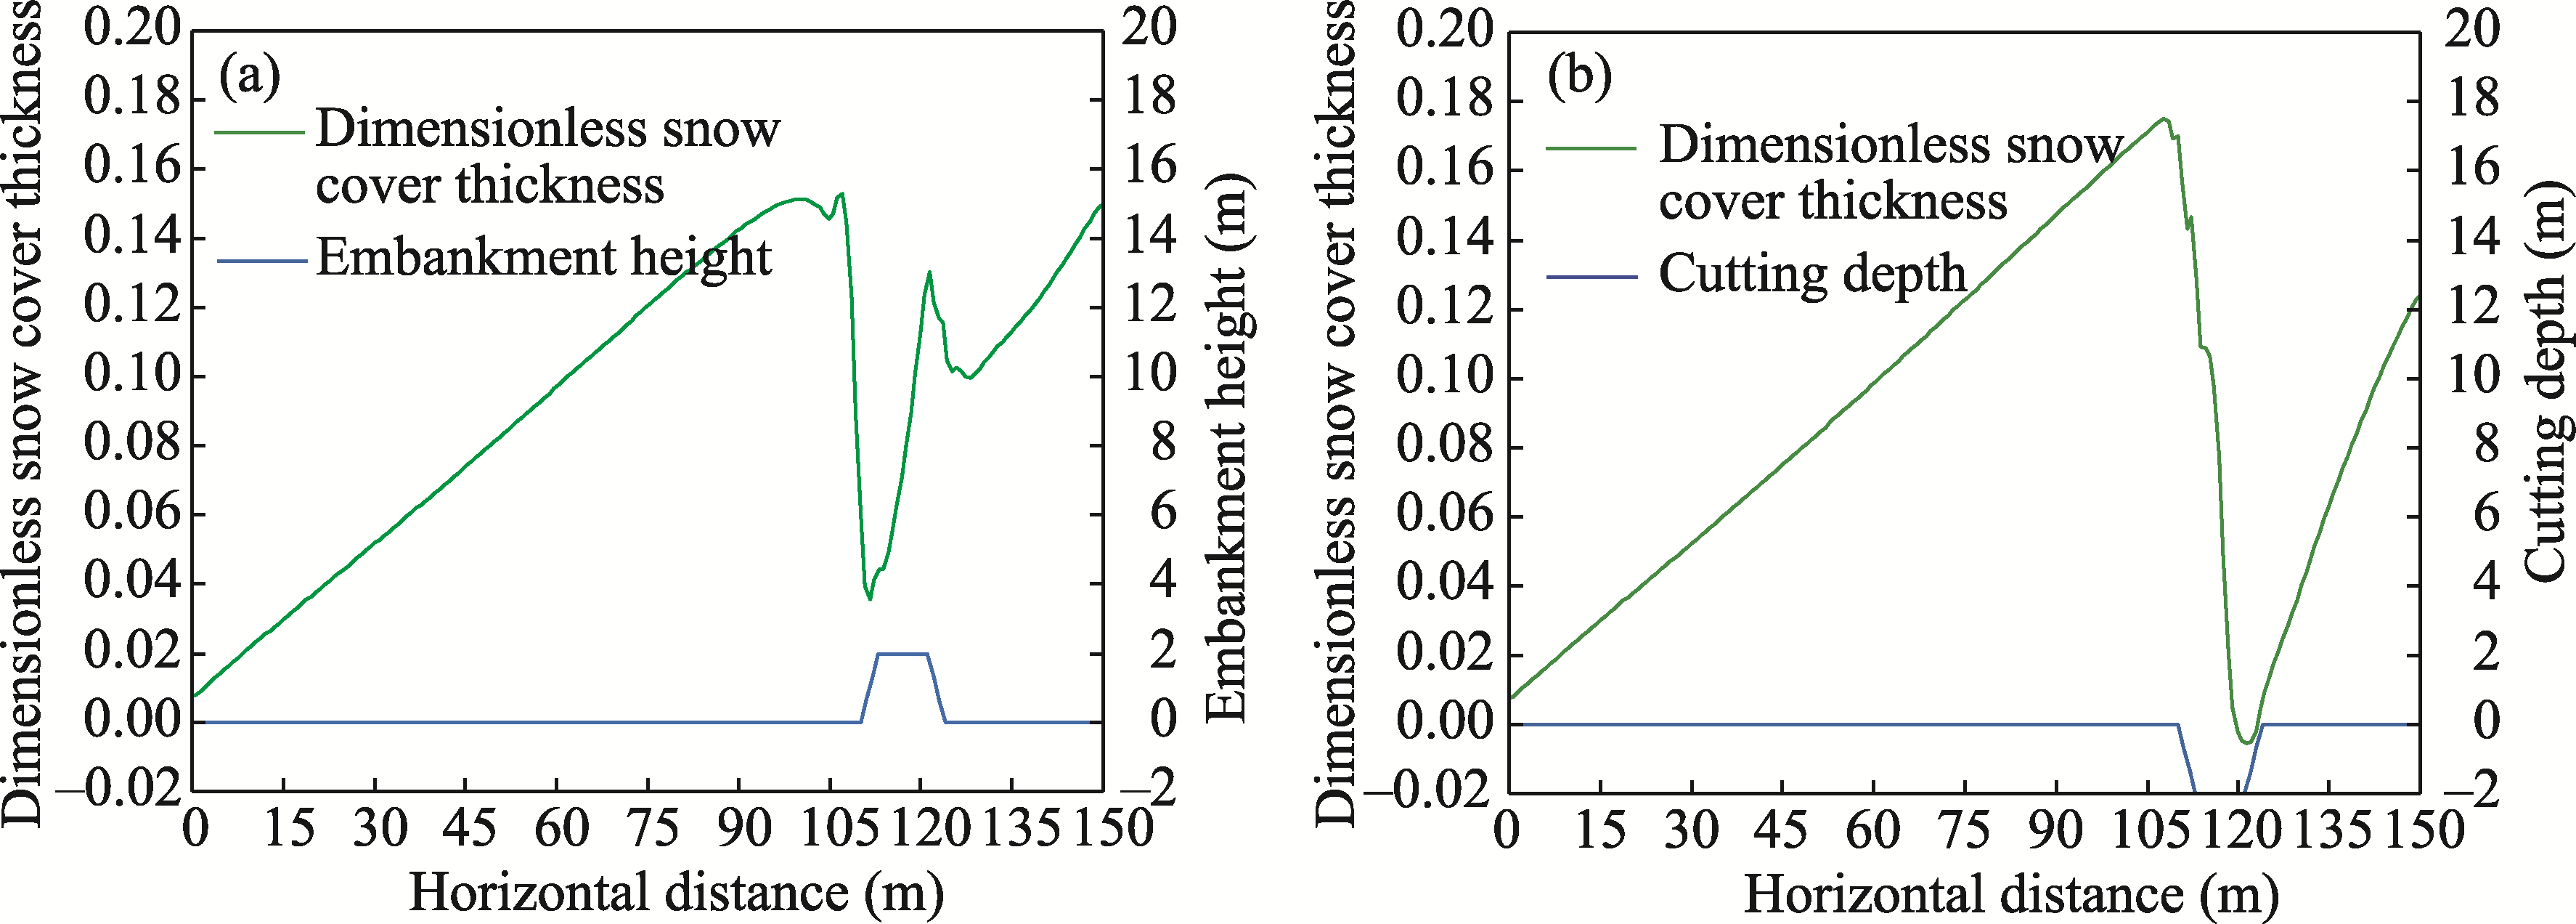
Abstract Railways built in cold, snowy, and lightly populated areas are subjected to wind and snow disasters. In this study, we selected a snow hazard prevention and control section of the Altay-Zhundong Railway in Xinjiang Uygur Autonomous Region of China as the research object. We investigated the deposited snowfall variation characteristics on the two sides and in the embankment pavement area of snow fences with different porosities, fence heights, and arrangement distances using single-factor tests and orthogonal tests based on global atmospheric reanalysis climate data, field survey data, and a multi-phase flow analysis model. The results showed significant differences in the characteristics of snow cover distribution and snow cover thickness between the embankment and the cutting in the absence of snow protection measures. The maximum snow cover thickness of the embankment pavement decreased by 12.6% relative to the cutting pavement. The snow cover thickness of the embankment exhibited an increasing trend from windward shoulder to leeward shoulder, whereas the snow cover thickness of the cutting presented a declining trend from windward shoulder to leeward toe. In the collaborative prevention and control of snow fences and embankments, the three factors can be ranked in terms of their sensitivity to deposited snowfall within the influence scope of snow fences as follows: fence height>arrangement distance>porosity. At the same time, fence height yielded a significant relationship for the influence scope of snow fences (P<0.05). The three factors can also be ranked in terms of their sensitivity to deposited snowfall on the pavement as follows: porosity>fence height>arrangement distance. For the embankment protection of the Altay-Zhundong Railway against wind and snow, snow fence with a porosity of 75%, a fence height of 4.8 m, and an arrangement distance from the embankment of 60 m produced the best snow control effect. By revealing the characteristics of snow cover distribution along railway subgrade and the protective effect of snow fences, this study provides valuable references for the engineering applications of railway construction in areas prone to wind and snow disasters.
|
|
Received: 14 December 2022
Published: 31 August 2023
|
|
Corresponding Authors:
* CHENG Jianjun (E-mail: chengdesign@126.com)
|
|
|
| [1] |
Basnet K, Constantinescu G, Muste M, et al. 2015. Method to assess efficiency and improve design of snow fences. Journal of Engineering Mechanics, 141(3): 04014136, doi: 10.1061/(ASCE)EM.1943-7889.0000871.
doi: 10.1061/(ASCE)EM.1943-7889.0000871
|
|
|
| [2] |
Beria H, Larsen J R, Ceperley N C, et al. 2018. Understanding snow hydrological processes through the lens of stable water isotopes. WIREs Water, 5(6): e1311, doi: 10.1002/wat2.1311.
doi: 10.1002/wat2.1311
|
|
|
| [3] |
Beyers J, Sundsbo P A, Harms T M. 2004. Numerical simulation of three-dimensional, transient snow drifting around a cube. Journal of Wind Engineering and Industrial Aerodynamics, 92(9): 725-747.
doi: 10.1016/j.jweia.2004.03.011
|
|
|
| [4] |
Cao Z G, Liu M M, Wu P C. 2019. Experiment investigation and numerical simulation of snowdrift on a typical large-span retractable roof. Complexity, 5984804, doi: 10.1155/2019/5984804.
doi: 10.1155/2019/5984804
|
|
|
| [5] |
Cheng J J, Lei J Q, Li S Y, et al. 2016. Disturbance of the inclined inserting-type sand fence to wind-sand flow fields and its sand control characteristics. Aeolian Research, 21: 139-150.
doi: 10.1016/j.aeolia.2016.04.008
|
|
|
| [6] |
Fu Z K, Li Q W. 2023. Study on wind-proof effect and stability of windbreak fence in alpine skiing center. Sustainability, 15(4): 3369, doi: 10.3390/su15043369.
doi: 10.3390/su15043369
|
|
|
| [7] |
Gao L, Cheng J J, Wang H F, et al. 2022. Effects of different types of guardrails on sand transportation of desert highway pavement. Journal of Arid Land, 14(9): 993-1008.
doi: 10.1007/s40333-022-0030-z
|
|
|
| [8] |
Gordon M, Taylor P A. 2008. Measurements of blowing snow, part I: particle shape, size distribution, velocity, and number flux at Churchill, Manitoba, Canada. Cold Regions Science and Technology, 55(1): 63-74.
doi: 10.1016/j.coldregions.2008.05.001
|
|
|
| [9] |
Gossart A, Palm S P, Souverijns N, et al. 2020. Importance of blowing snow during cloudy conditions in east Antarctica: comparison of ground-based and space-borne retrievals over ice-shelf and mountain regions. Frontiers in Earth Science, 8: 240, doi: 10.3389/feart.2020.00240.
doi: 10.3389/feart.2020.00240
|
|
|
| [10] |
Kang L Y, Zhou X Y, van Hooff T, et al. 2018. CFD simulation of snow transport over flat, uniformly rough, open terrain: impact of physical and computational parameters. Journal of Wind Engineering and Industrial Aerodynamics, 177: 213-226.
doi: 10.1016/j.jweia.2018.04.014
|
|
|
| [11] |
Kumar G. 2015. Performance of snow fence at Banihal top in Himalayan region. Journal of Cold Regions Engineering, 29(4): 5014001, doi: 10.1061/(ASCE)CR.1943-5495.0000088.
doi: 10.1061/(ASCE)CR.1943-5495.0000088
|
|
|
| [12] |
Kumar G, Gairola A, Vaid A. 2020. Flow and deposition measurement of foam beads in a closed re-circulating wind tunnel for snowdrift modelling. Flow Measurement and Instrumentation, 72: 101687, doi: 10.1016/j.flowmeasinst.2019.101687.
doi: 10.1016/j.flowmeasinst.2019.101687
|
|
|
| [13] |
Li P X, Bai M Z, Li J X, et al. 2022. Analysis of the influence of snow fences on snow redistribution under snow-drifting in railway cuttings. Cold Regions Science and Technology, 196: 103520, doi: 10.1016/j.coldregions.2022.103520.
doi: 10.1016/j.coldregions.2022.103520
|
|
|
| [14] |
Liu D, Li Y, Wang B, et al. 2016. Mechanism and effects of snow accumulations and controls by lightweight snow fences. Journal of Modern Transportation, 24(4): 261-269.
doi: 10.1007/s40534-016-0115-5
|
|
|
| [15] |
Liu Q K, Liang P F, Gao L, et al. 2021. Effects of side slope inclination on drifting snow of embankment. Journal of Vibration and Shock, 40(3): 87-94. (in Chinese)
|
|
|
| [16] |
Loeb N A, Kennedy A. 2021. Blowing snow at Mcmurdo station, Antarctica during the aware field Campaign: surface and ceilometer observations. Journal of Geophysical Research-Atmospheres, 126(7): e2020JD033935, doi: 10.1029/2020JD033935.
doi: 10.1029/2020JD033935
|
|
|
| [17] |
Lu N, Wayllace A, Oh S. 2013. Infiltration-induced seasonally reactivated instability of a highway embankment near the Eisenhower Tunnel, Colorado, USA. Engineering Geology, 162: 22-32.
doi: 10.1016/j.enggeo.2013.05.002
|
|
|
| [18] |
Ma G S, Huang N. 2006. Threshold wind-speed of snow drifting. Journal of Lanzhou University (Natural Sciences), 42(6): 130-134. (in Chinese)
|
|
|
| [19] |
Ma W Y, Li F Q, Sun Y C, et al. 2021. Field measurement and numerical simulation of snow deposition on an embankment in snowdrift. Wind and Structures, 32(5): 453-469.
|
|
|
| [20] |
Ma W Y, Li S, Sun Y C, et al. 2022. Investigation of snow deposition on the railway cuttings during the snowdrift. Frontiers in Earth Science, 10: 857981, doi: 10.3389/feart.2022.857981.
doi: 10.3389/feart.2022.857981
|
|
|
| [21] |
McClure S, Kim J J, Lee S J, et al. 2017. Shelter effects of porous multi-scale fractal fences. Journal of Wind Engineering and Industrial Aerodynamics, 163: 6-14.
doi: 10.1016/j.jweia.2017.01.007
|
|
|
| [22] |
Mott R, Vionnet V, Grunewald T. 2018. The seasonal snow cover dynamics: review on wind-driven coupling processes. Frontiers in Earth Science, 6: 197, doi: 10.3389/feart.2018.00197.
doi: 10.3389/feart.2018.00197
|
|
|
| [23] |
Naaim M, Naaim B F, Martinez H. 1998. Numerical simulation of drifting snow: erosion and deposition models. Annals of Glaciology, 26: 191-196.
doi: 10.3189/1998AoG26-1-191-196
|
|
|
| [24] |
Potac J, O'Rourke M, Thiis T K. 2018. Determination of wall height to capture windward drift snow on flat roofs. Cold Regions Science and Technology, 150: 51-61.
doi: 10.1016/j.coldregions.2017.09.006
|
|
|
| [25] |
Potsis T, Tominaga Y, Stathopoulos T. 2023. Computational wind engineering: 30 years of research progress in building structures and environment. Journal of Wind Engineering and Industrial Aerodynamics, 234: 105346, doi: 10.1016/j.jweia.2023.105346.
doi: 10.1016/j.jweia.2023.105346
|
|
|
| [26] |
Prokop A, Procter E S. 2016. A new methodology for planning snow drift fences in alpine terrain. Cold Regions Science and Technology, 132: 33-43.
doi: 10.1016/j.coldregions.2016.09.010
|
|
|
| [27] |
Qiu S M, Bai M Z, Jiang H, et al. 2022. Field measurements and numerical simulation of snowdrift on railway subgrade. Journal of Testing and Evaluation, 50(6): 2988-3000.
|
|
|
| [28] |
Qi Y L. 2018. Strategies of railway alignment selection for Karamay-Tacheng railway in Xinjiang considering snow drifting disasters. Journal of Railway Science and Engineering, 15(11): 2813-2824. (in Chinese)
|
|
|
| [29] |
Qi Y, Cornwell M, Shi X M. 2021. Field test of living snow fences along Illinois freeways. Journal of Cold Regions Engineering, 35(4): 04021015, doi: 10.1061/(ASCE)CR.1943-5495.0000263.
doi: 10.1061/(ASCE)CR.1943-5495.0000263
|
|
|
| [30] |
Sanudo-Fontaneda L A, Castro-Fresno D, del Coz-Diaz J J, et al. 2011. Classification and comparison of snow fences for the protection of transport infrastructures. Journal of Cold Regions Engineering, 25(4): 162-181.
doi: 10.1061/(ASCE)CR.1943-5495.0000031
|
|
|
| [31] |
Tominaga Y, Okaze T, Mochida A. 2011. CFD modeling of snowdrift around a building: an overview of models and evaluation of a new approach. Building and Environment, 46(4): 899-910.
doi: 10.1016/j.buildenv.2010.10.020
|
|
|
| [32] |
Tominaga Y. 2018. Computational fluid dynamics simulation of snowdrift around buildings: Past achievements and future perspectives. Cold Regions Science and Technology, 150: 2-14.
doi: 10.1016/j.coldregions.2017.05.004
|
|
|
| [33] |
Tominaga Y, Stathopoulos T. 2020. CFD simulations can be adequate for the evaluation of snow effects on structures. Building Simulation, 13(4): 729-737.
doi: 10.1007/s12273-020-0643-0
|
|
|
| [34] |
Wang J B, Zhang J, Xie F, et al. 2018. A study of snow accumulating on the bogie and the effects of deflectors on the de-icing performance in the bogie region of a high-speed train. Cold Regions Science and Technology, 148: 121-130.
doi: 10.1016/j.coldregions.2018.01.010
|
|
|
| [35] |
Wang J S, Liu H B, Xu D, et al. 2019. Modeling snowdrift on roofs using immersed boundary method and wind tunnel test. Building and Environment, 160: 106208, doi: 10.1016/j.buildenv.2019.106208.
doi: 10.1016/j.buildenv.2019.106208
|
|
|
| [36] |
Xia C C, Zhou K F, Cheng Y, et al. 2017. Prediction model of snow depth of snowdrift on highway based on back propagation neural network. Journal of Tongji University (Natural Science), 45(5): 714-720. (in Chinese)
|
|
|
| [37] |
Yang S, Zhang M Y, Pei W S, et al. 2022. Numerical study on snow erosion and deposition around an embankment with a snow fence under snowfall conditions. Aeolian Research, 56: 100798, doi: 10.1016/j.aeolia.2022.100798.
doi: 10.1016/j.aeolia.2022.100798
|
|
|
| [38] |
Yu Y P, Zhang K C, An Z S, et al. 2020. The blocking effect of the sand fences quantified using wind tunnel simulations. Journal of Mountain Science, 17(10): 2485-2496.
doi: 10.1007/s11629-020-6095-2
|
|
|
| [39] |
Zhang G L, Zhang Q W, Fan F, et al. 2021. Numerical simulations of development of snowdrifts on long-span spherical roofs. Cold Regions Science and Technology, 182: 103211, doi: 10.1016/j.coldregions.2020.103211.
doi: 10.1016/j.coldregions.2020.103211
|
|
|
| [40] |
Zhang X T. 1985. Structure Wind Pressure and Wind Vibration Calculation. Shanghai: Tongji University Press, 34-36. (in Chinese)
|
|
|
| [41] |
Zhou X Y, Zhang Y, Kang L Y, et al. 2019. CFD simulation of snow redistribution on gable roofs: impact of roof slope. Journal of Wind Engineering and Industrial Aerodynamics, 185: 16-32.
doi: 10.1016/j.jweia.2018.12.008
|
|
|
| [42] |
Zhou X Y, Zhang T G, Ma W Y, et al. 2021. CFD simulation of snow redistribution on a bridge deck: effect of barriers with different porosities. Cold Regions Science and Technology, 181: 103174, doi: 10.1016/j.coldregions.2020.103174.
doi: 10.1016/j.coldregions.2020.103174
|
|
|
|
Viewed |
|
|
|
Full text
|
|
|
|
|
Abstract
|
|
|
|
|
Cited |
|
|
|
|
| |
Shared |
|
|
|
|
| |
Discussed |
|
|
|
|