| Research article |
|


|
|
|
| Integrating stable isotopes and factor analysis to delineate the groundwater provenance and pollution sources in the northwestern part of the Amman-Al Zarqa Basin, Jordan |
Mutawakil OBEIDAT1,*( ), Ahmad AL-AJLOUNI2, Eman BANI-KHALED2, Muheeb AWAWDEH3, Muna ABU-DALO2 ), Ahmad AL-AJLOUNI2, Eman BANI-KHALED2, Muheeb AWAWDEH3, Muna ABU-DALO2 |
1Basic Sciences and Humanities Department, Faculty of Science and Arts, Water Diplomacy Centre, Jordan University of Science and Technology, Irbid 22110, Jordan
2Chemistry Department, Jordan University of Science and Technology, Irbid 22110, Jordan
3Laboratory of Applied Geoinformatics, Department of Earth and Environmental Sciences, Yarmouk University, Irbid 21163, Jordan |
|
|
|
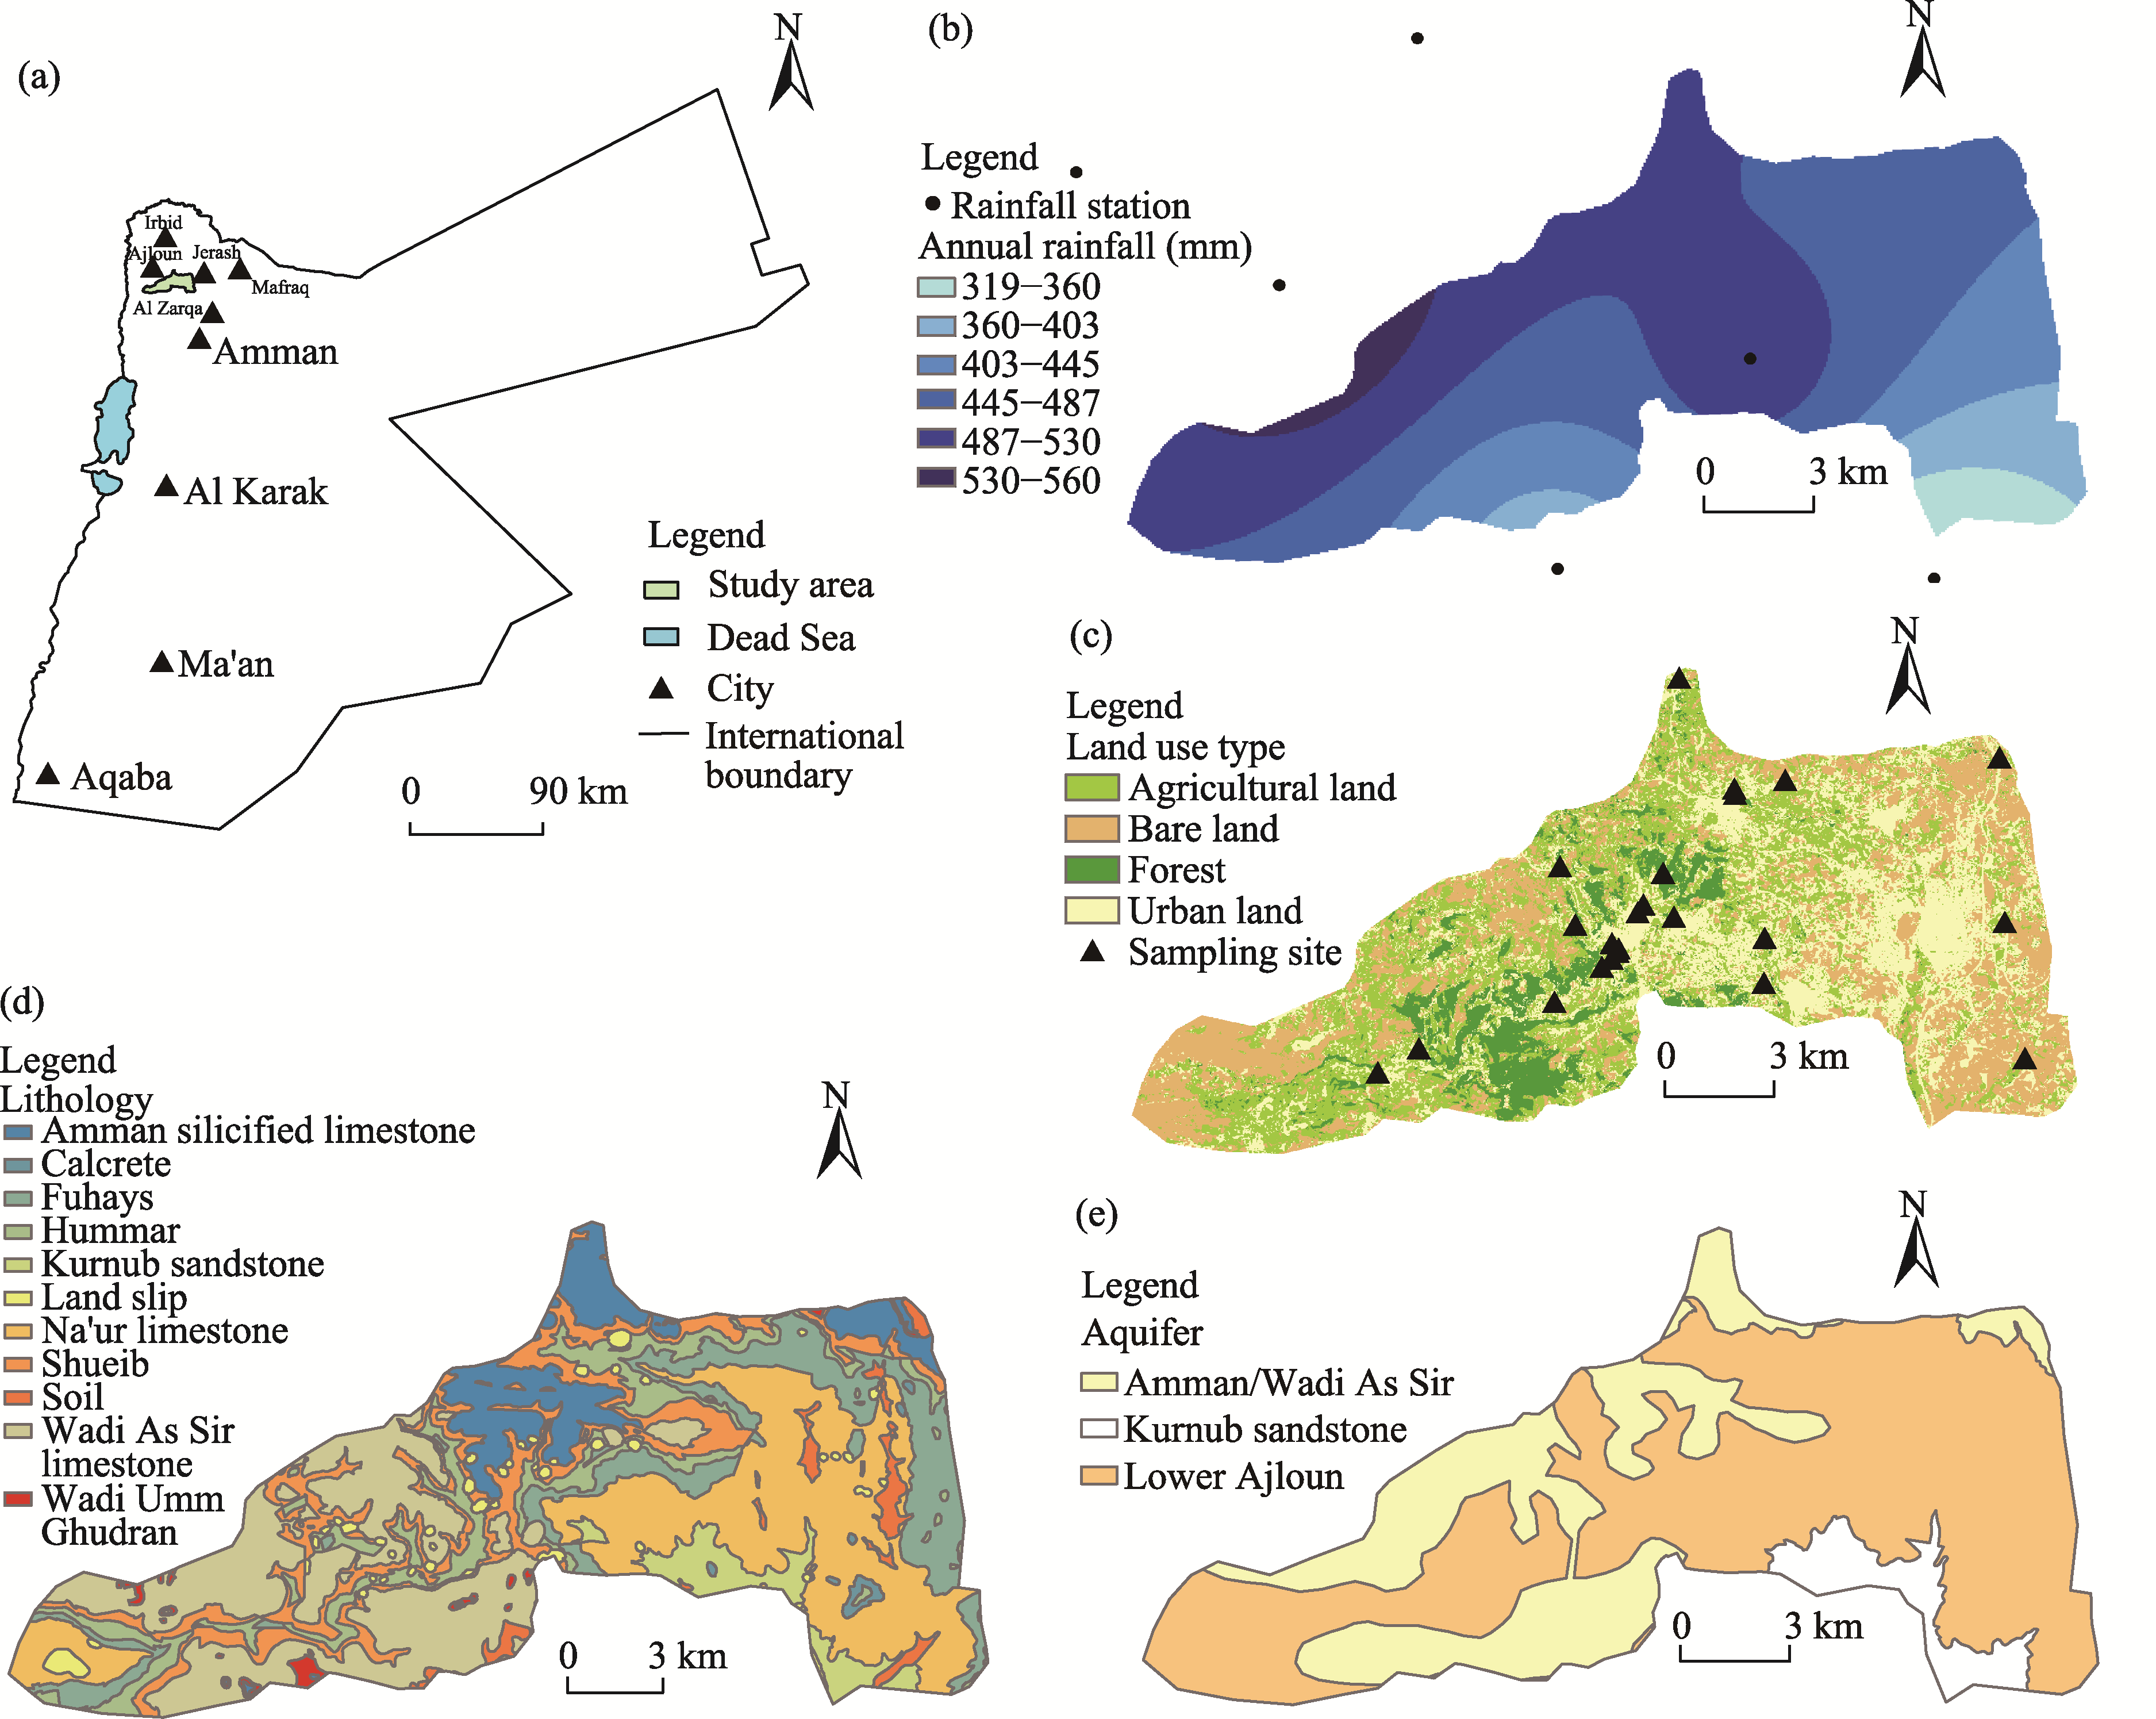
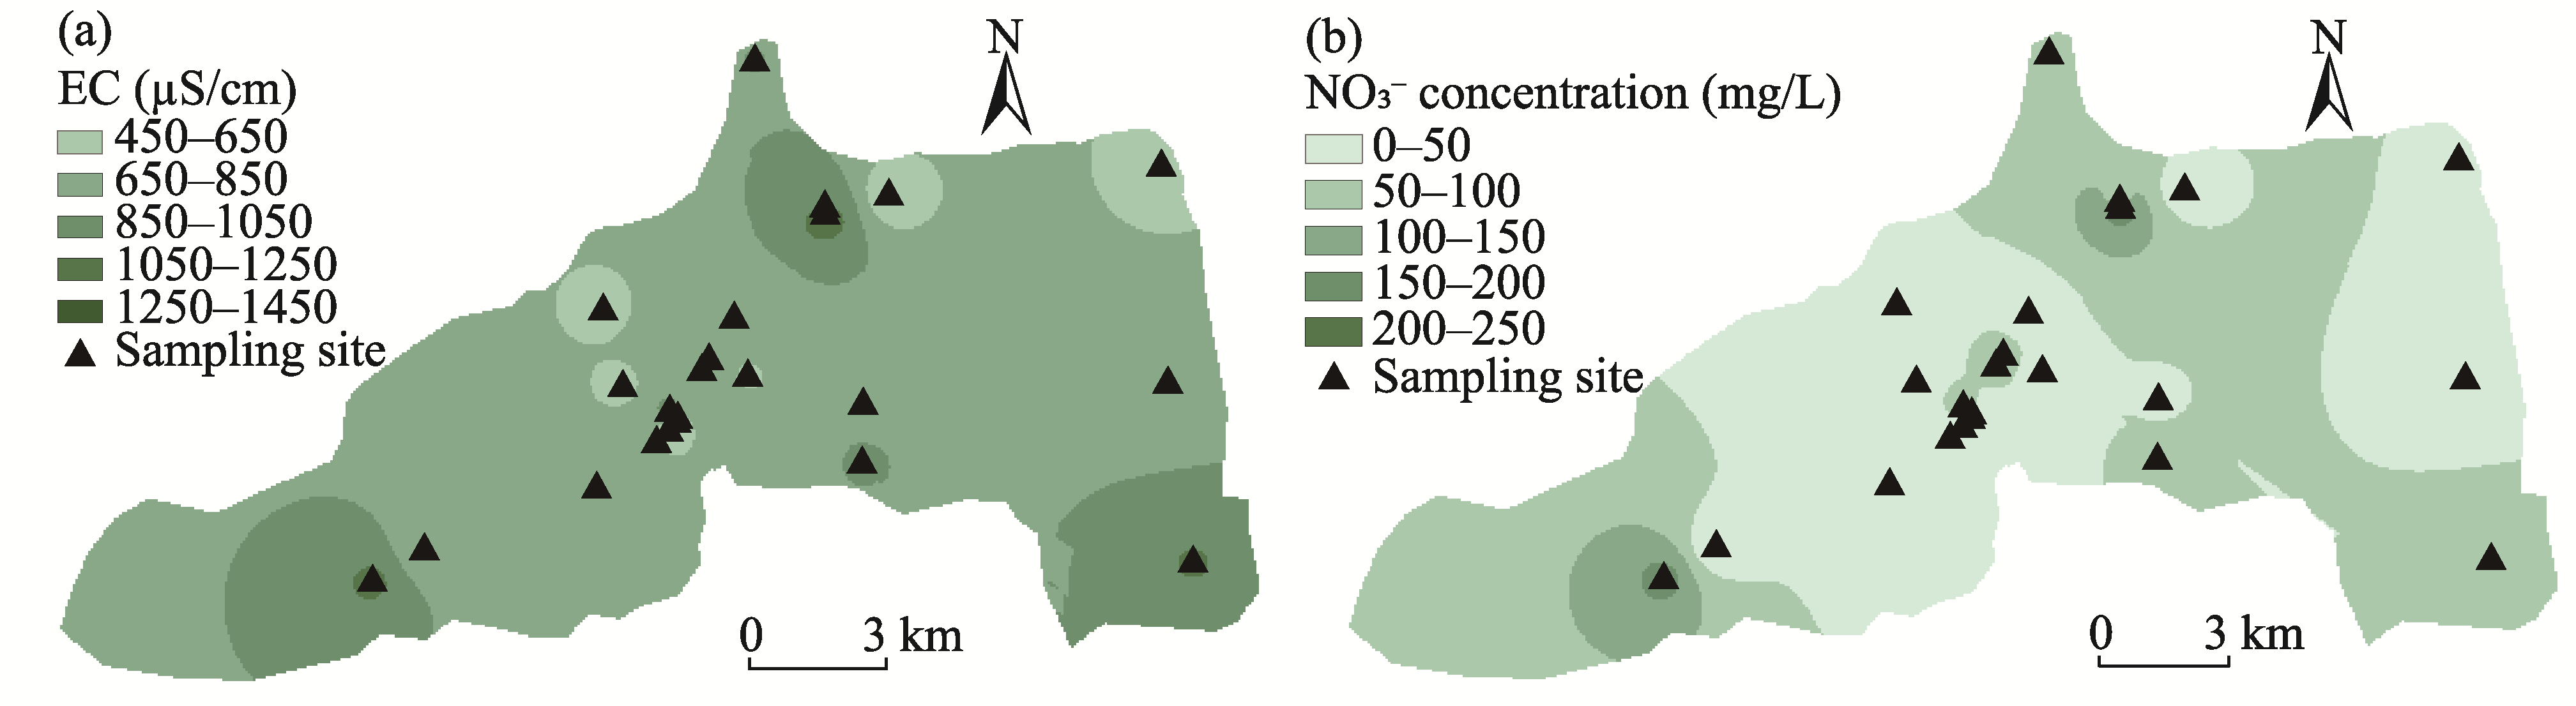
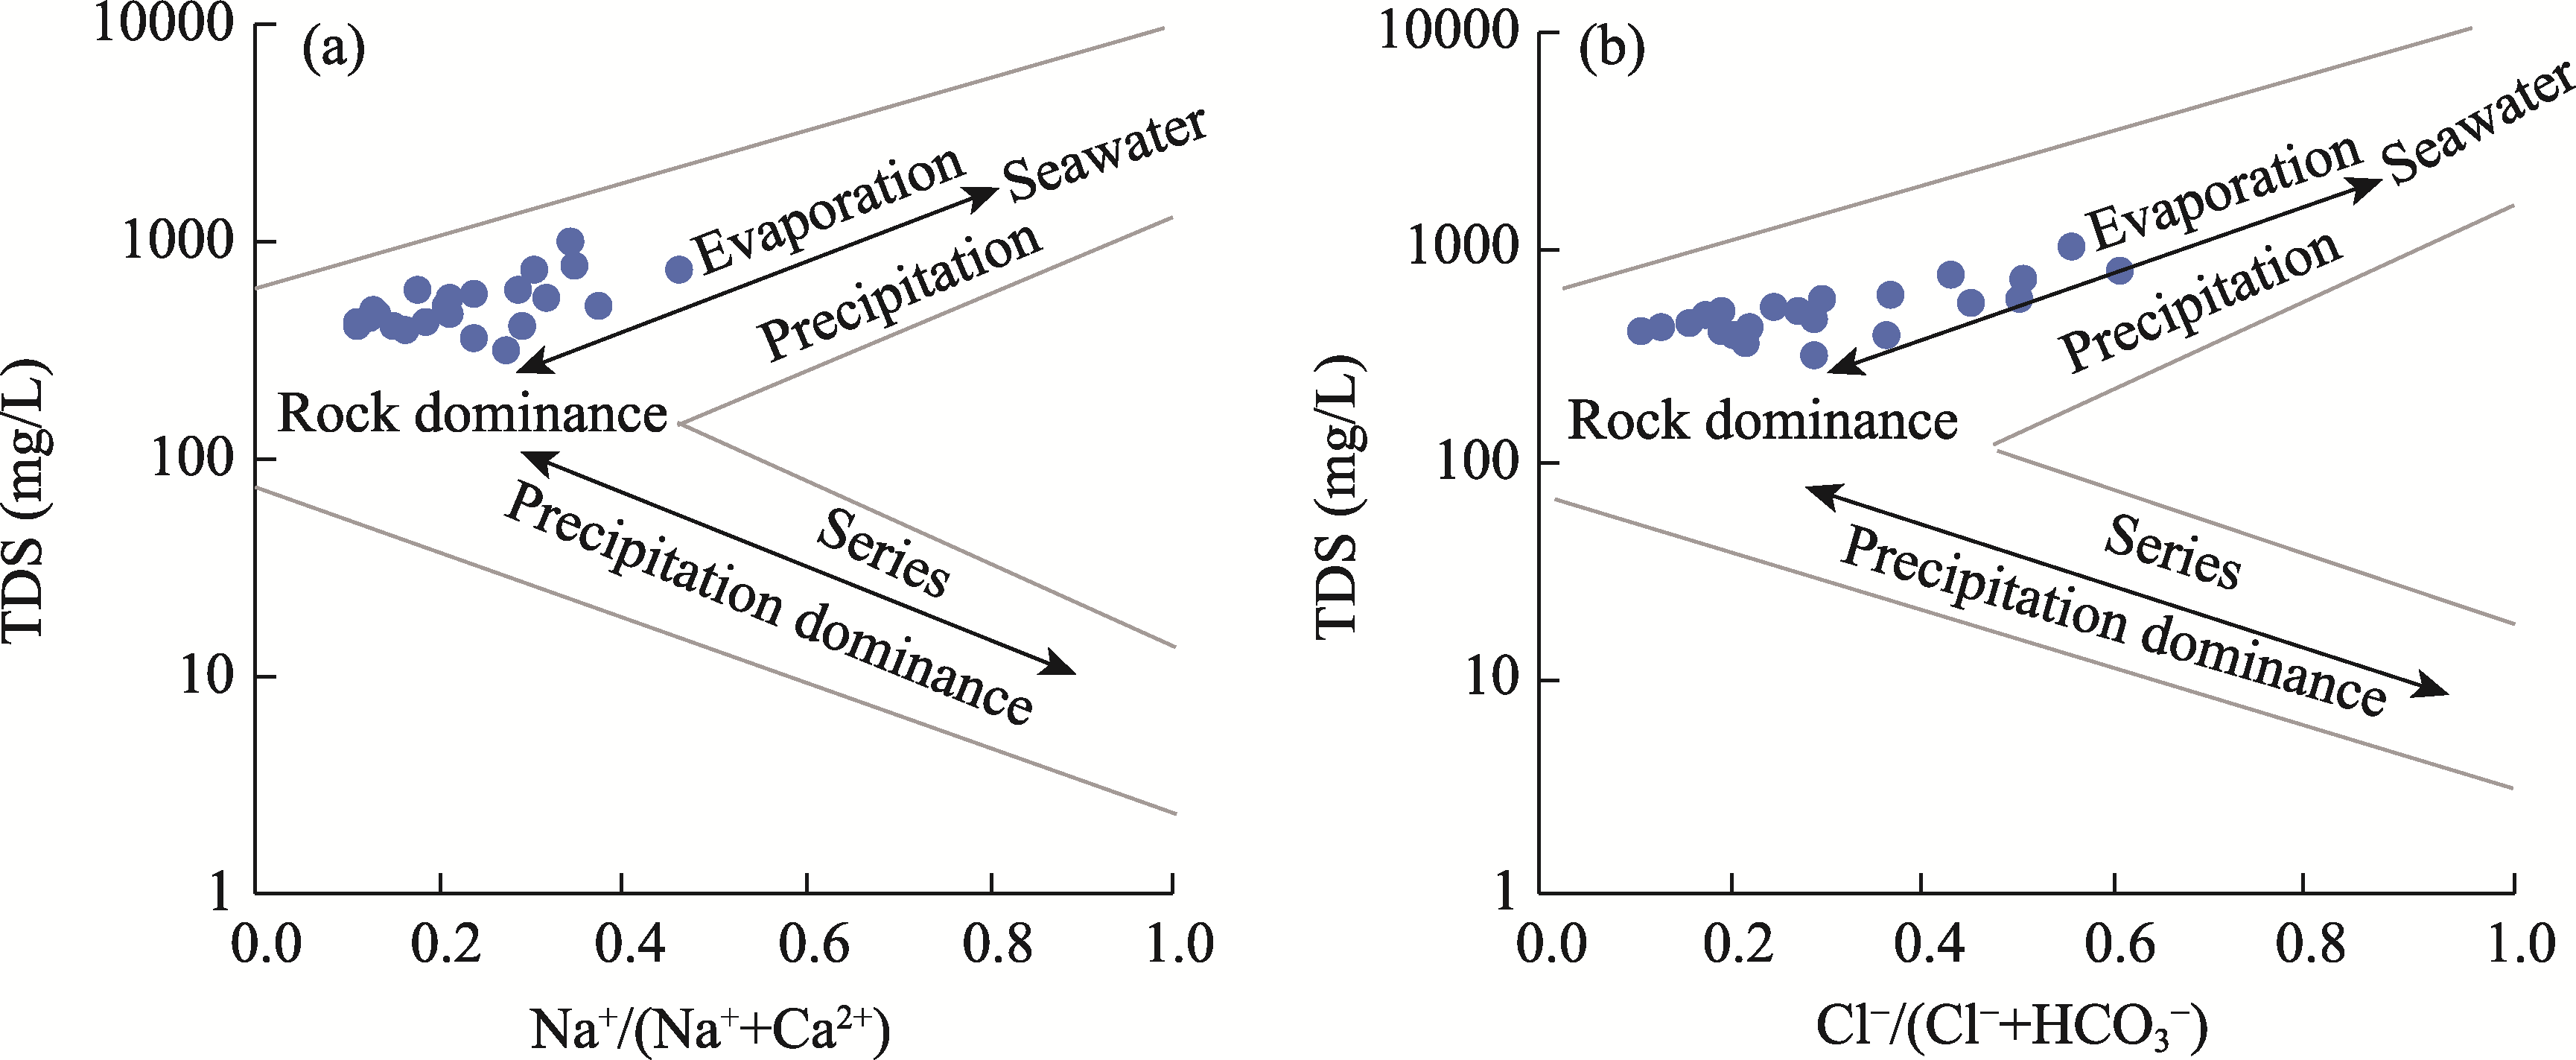
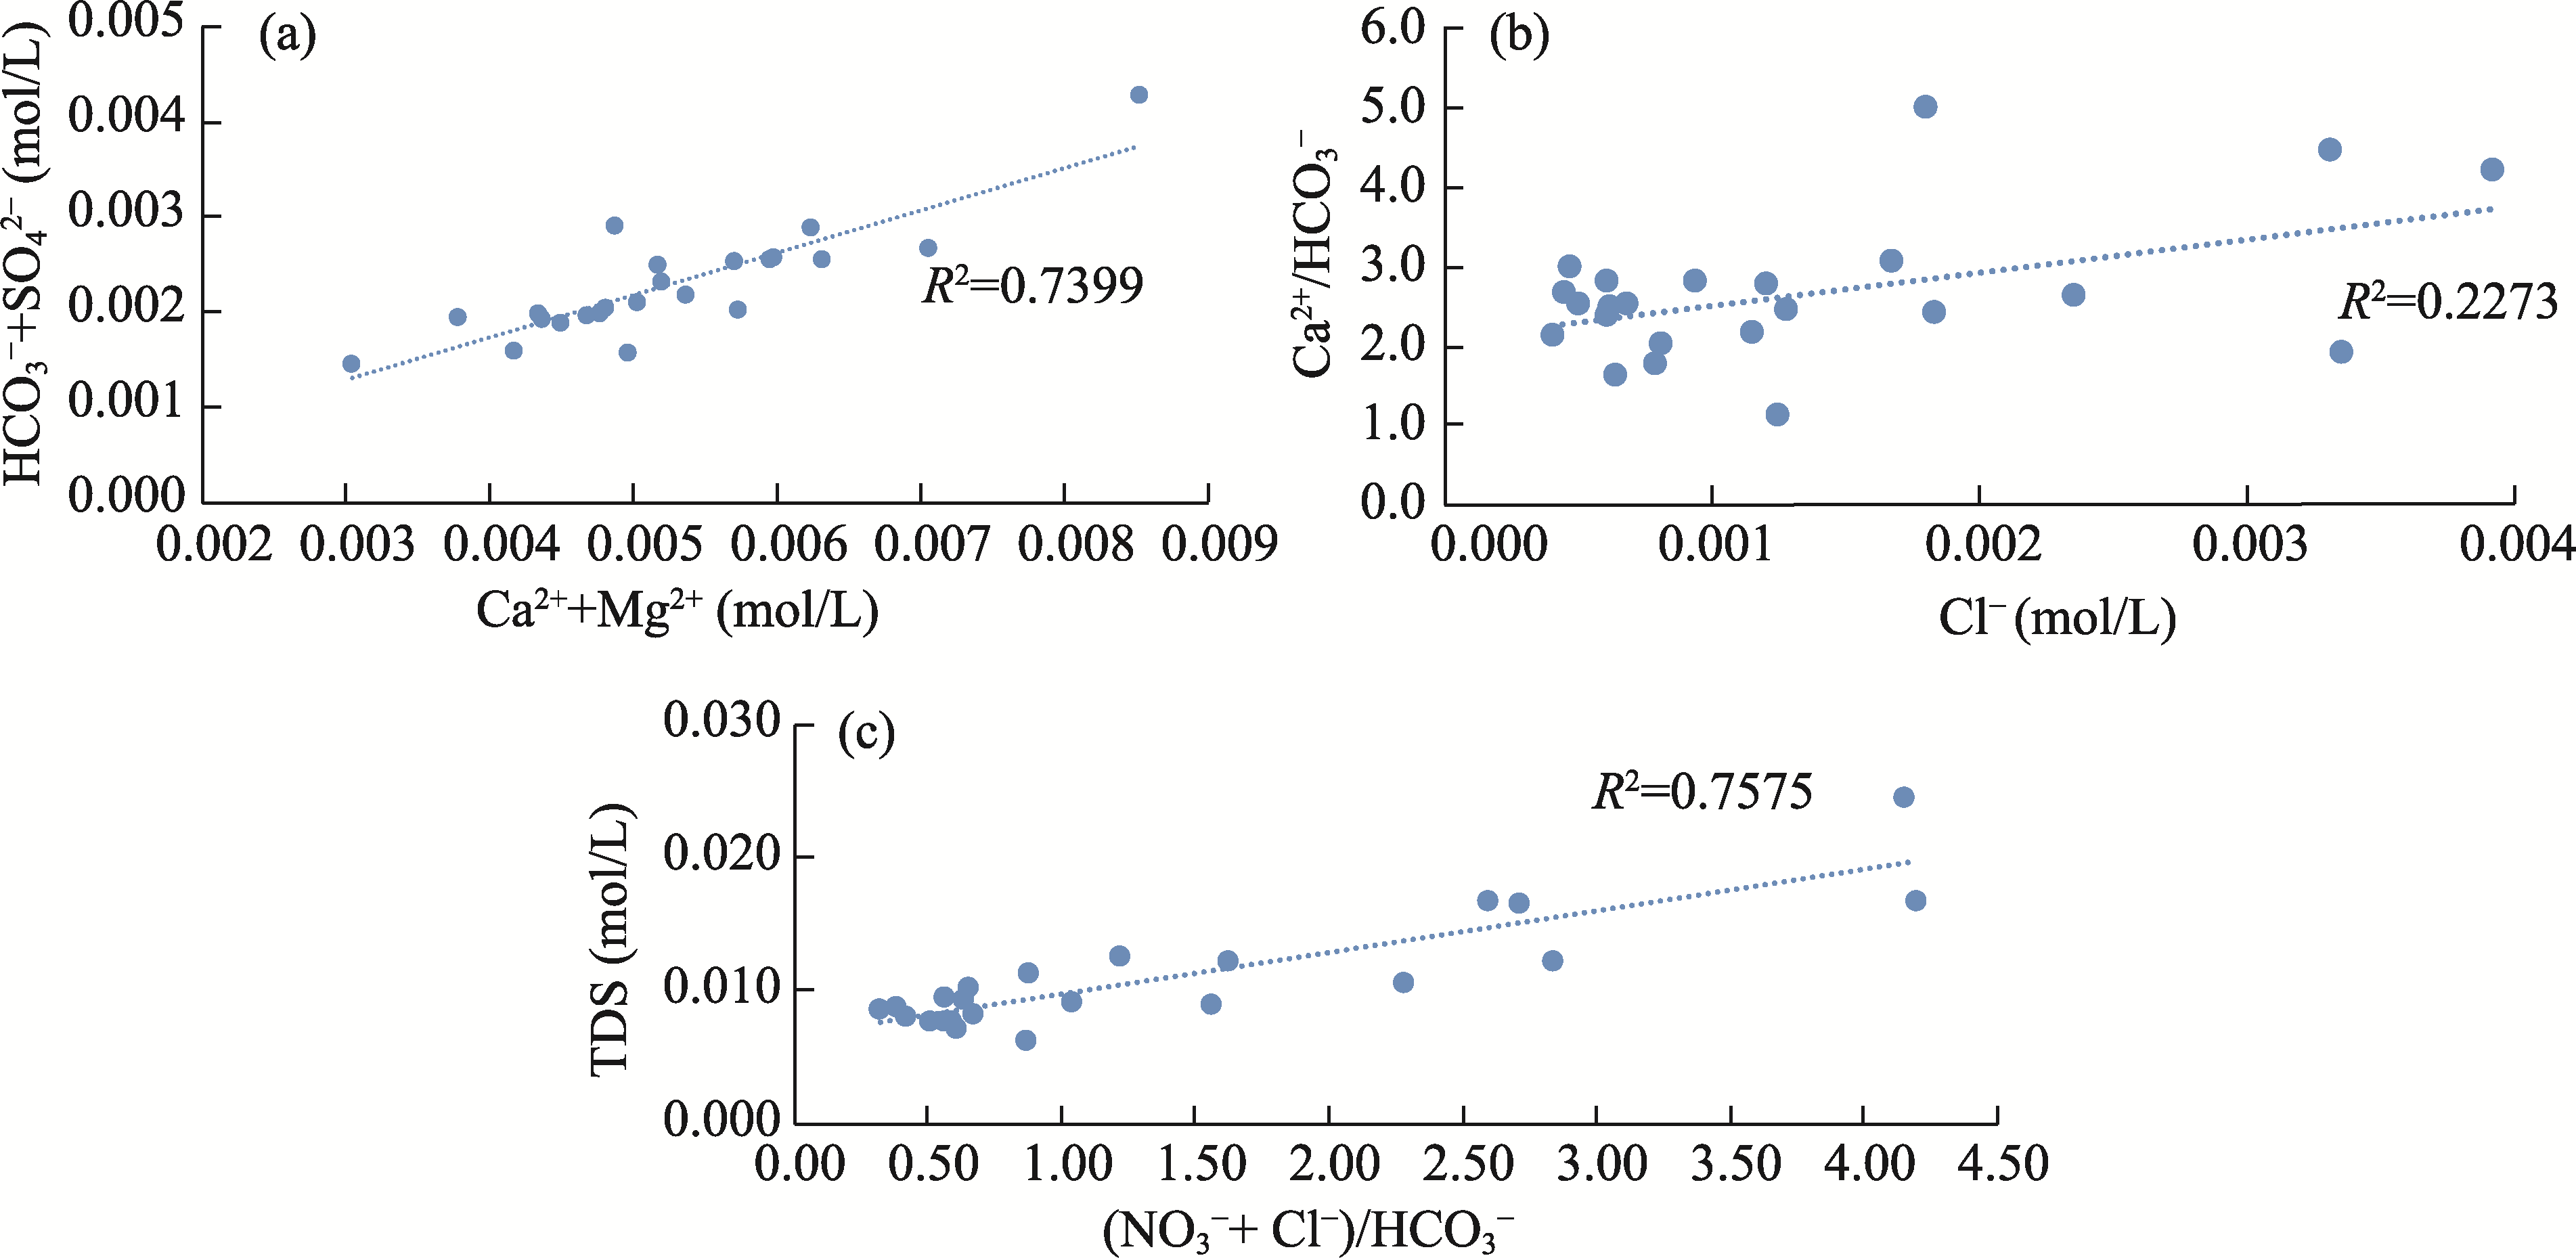
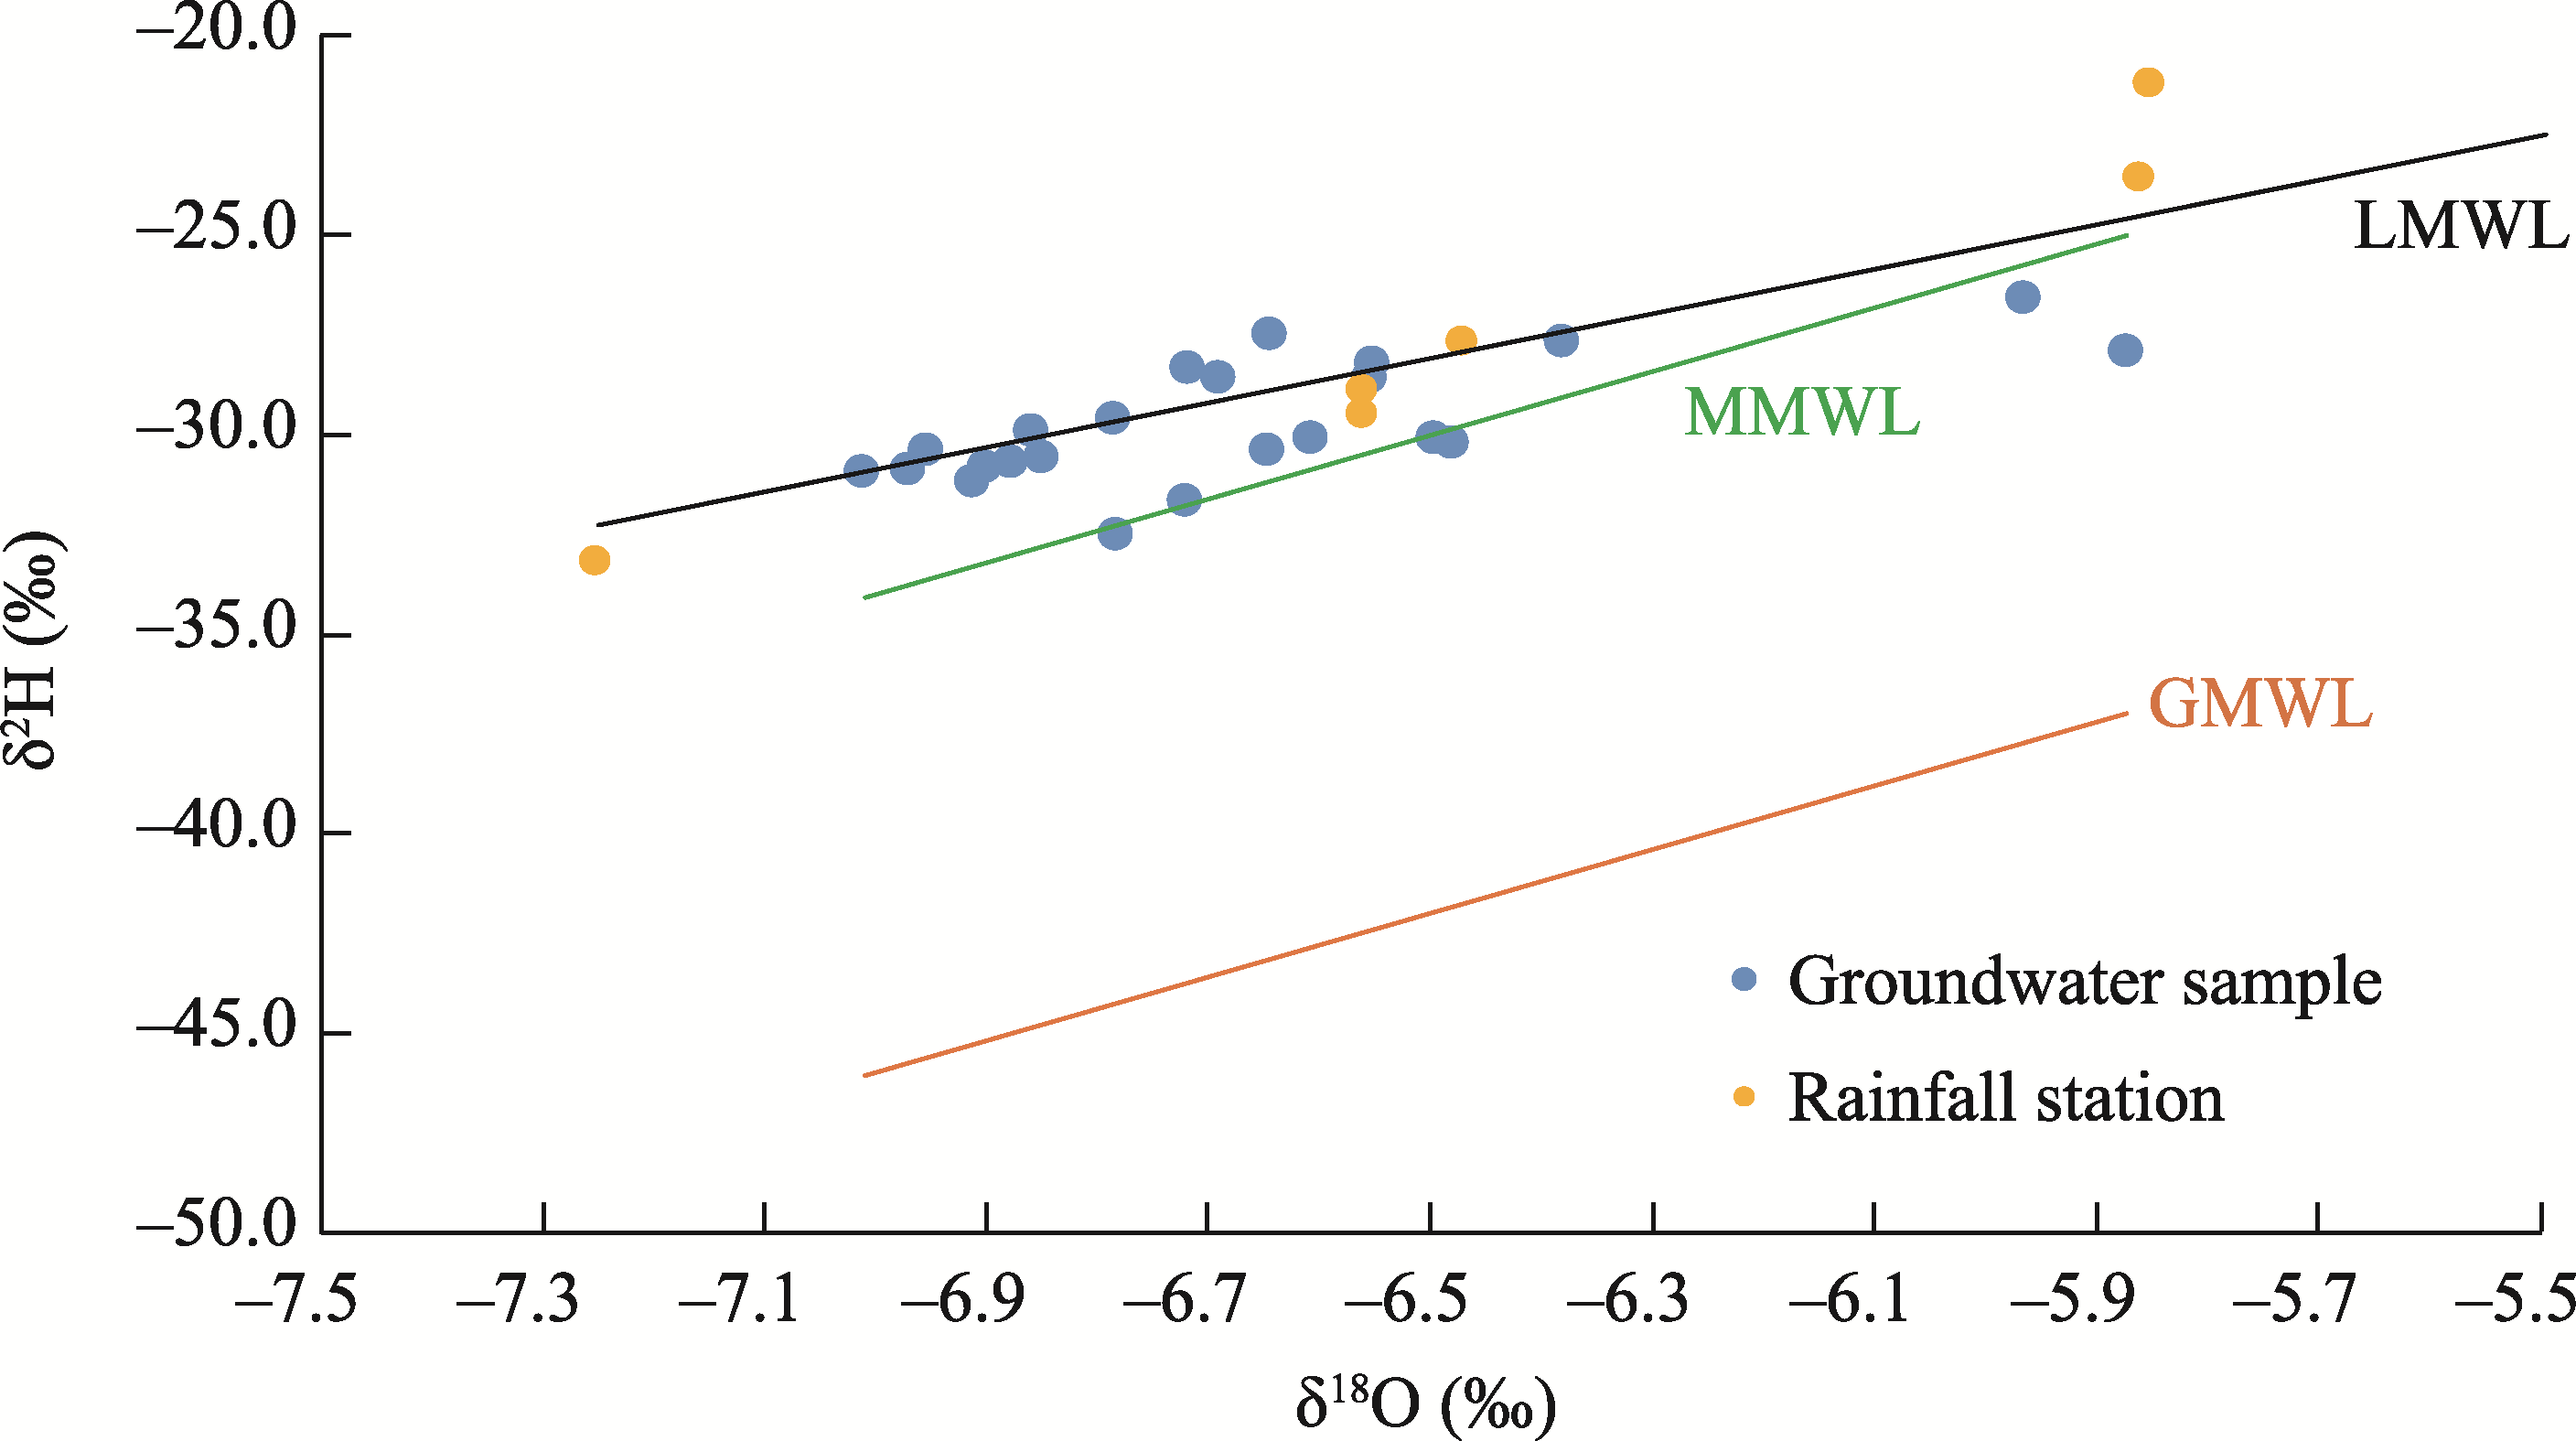
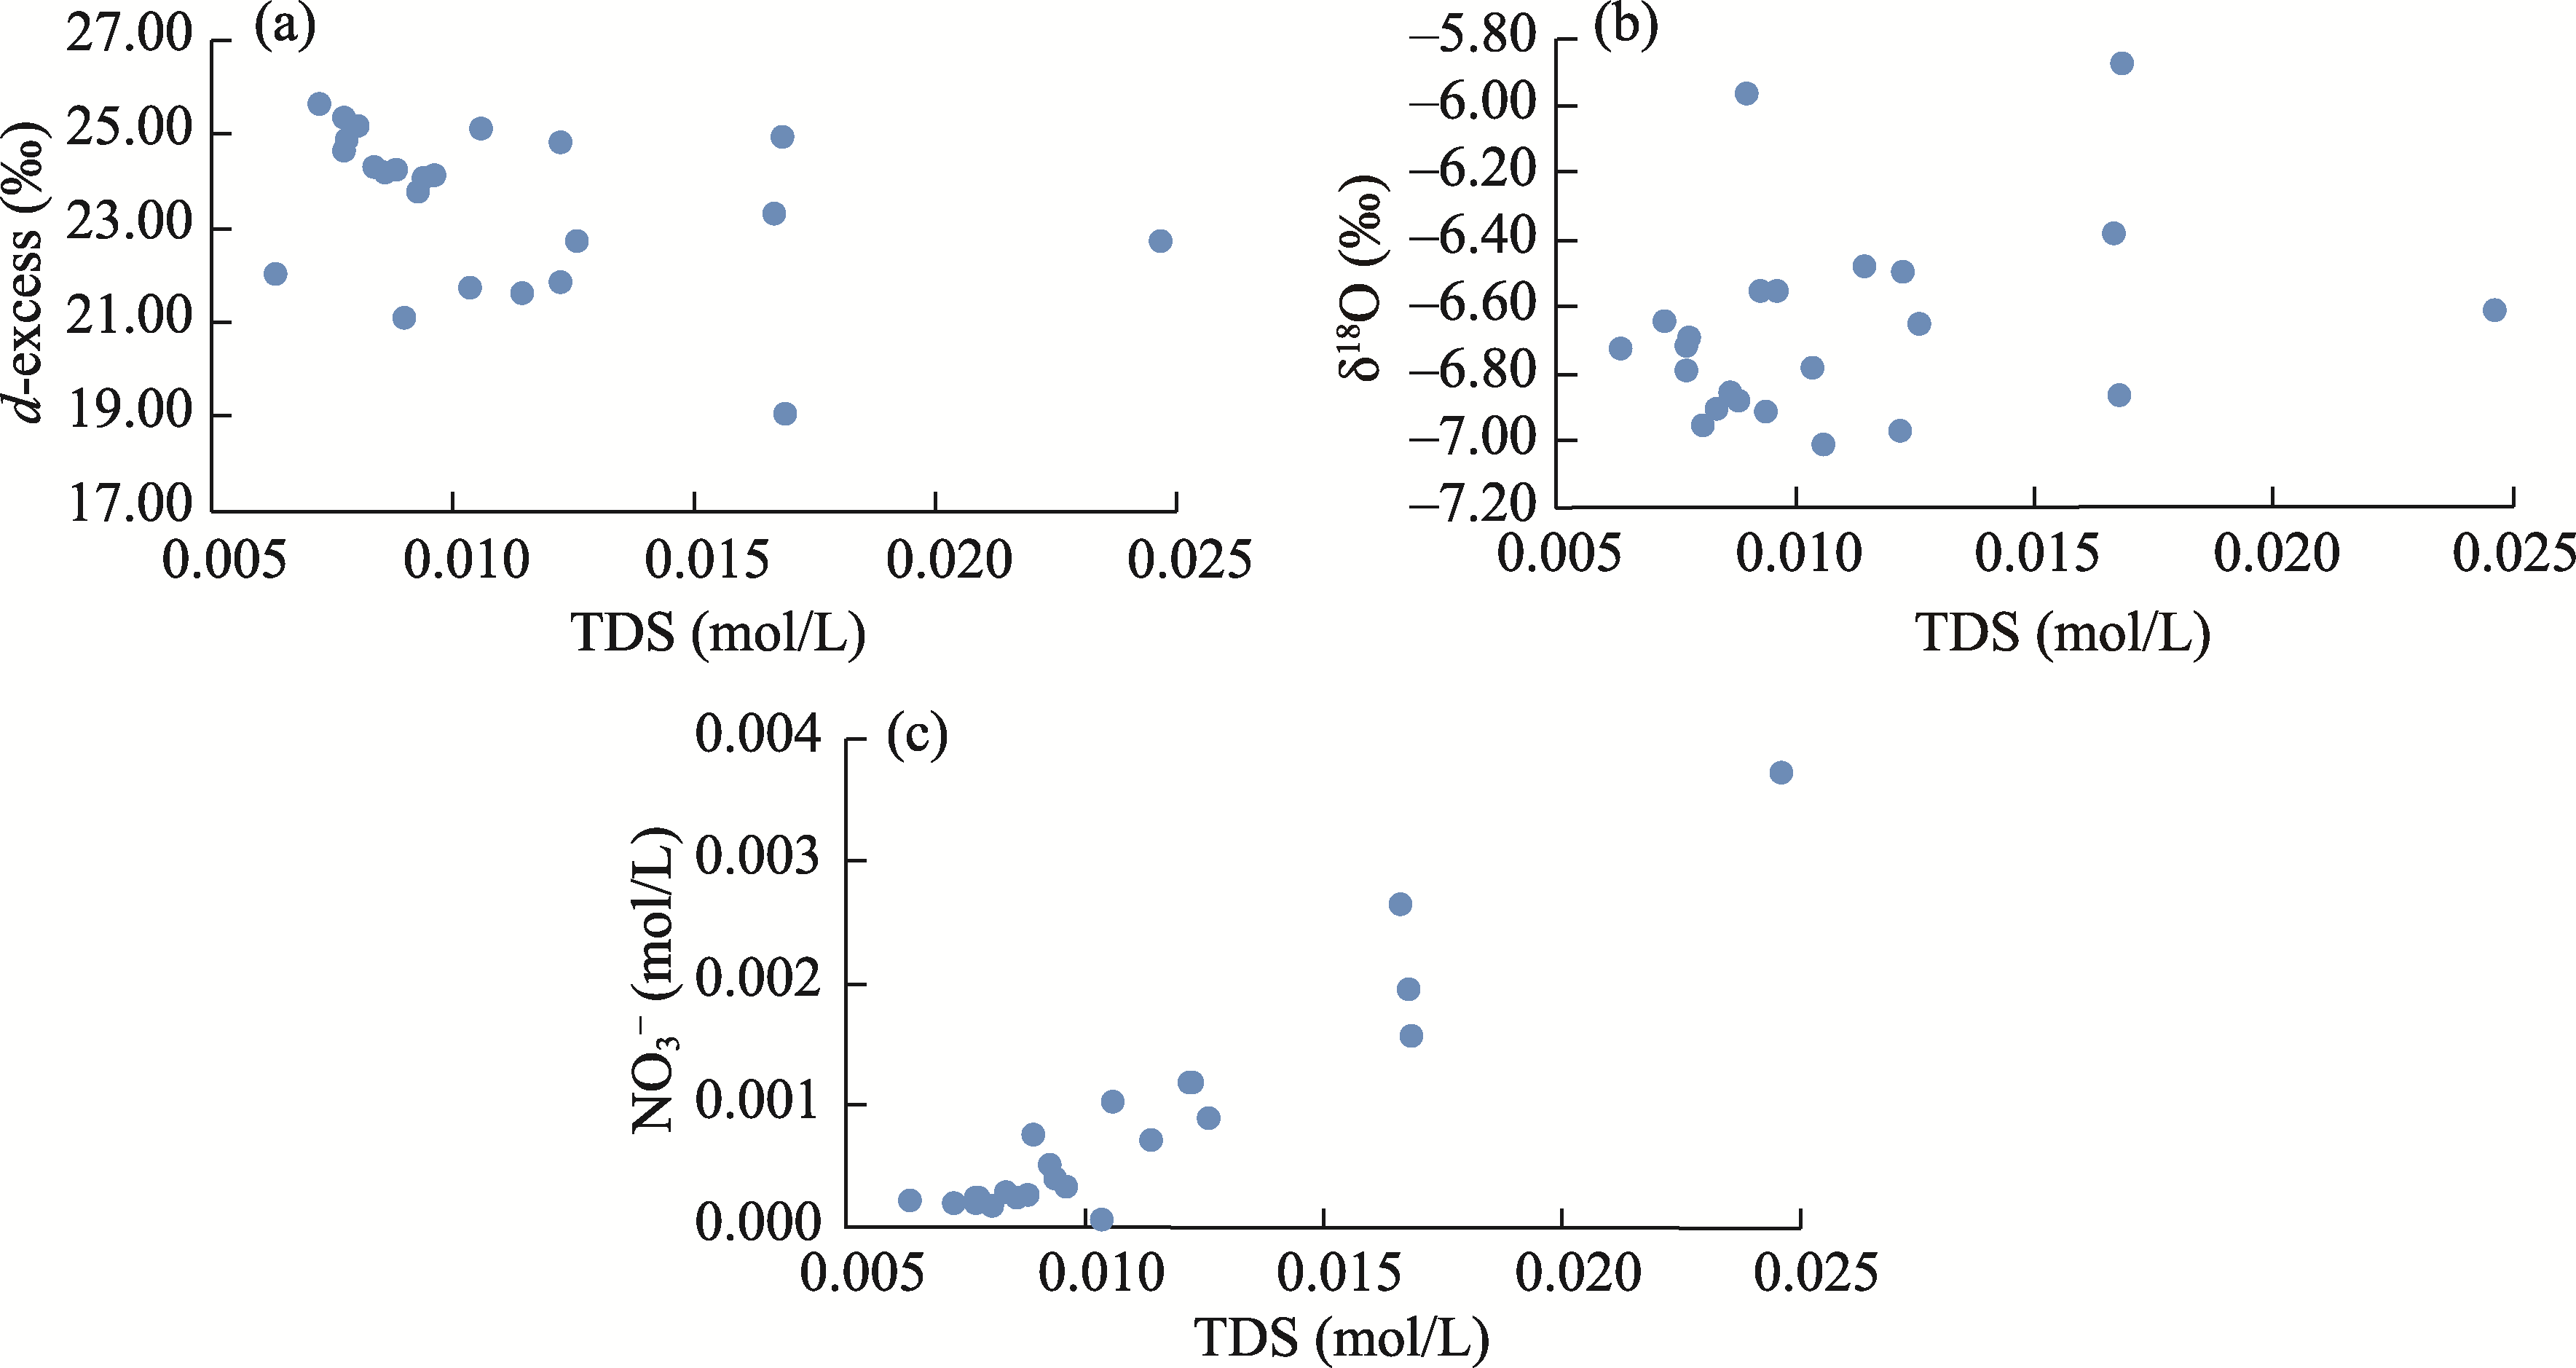
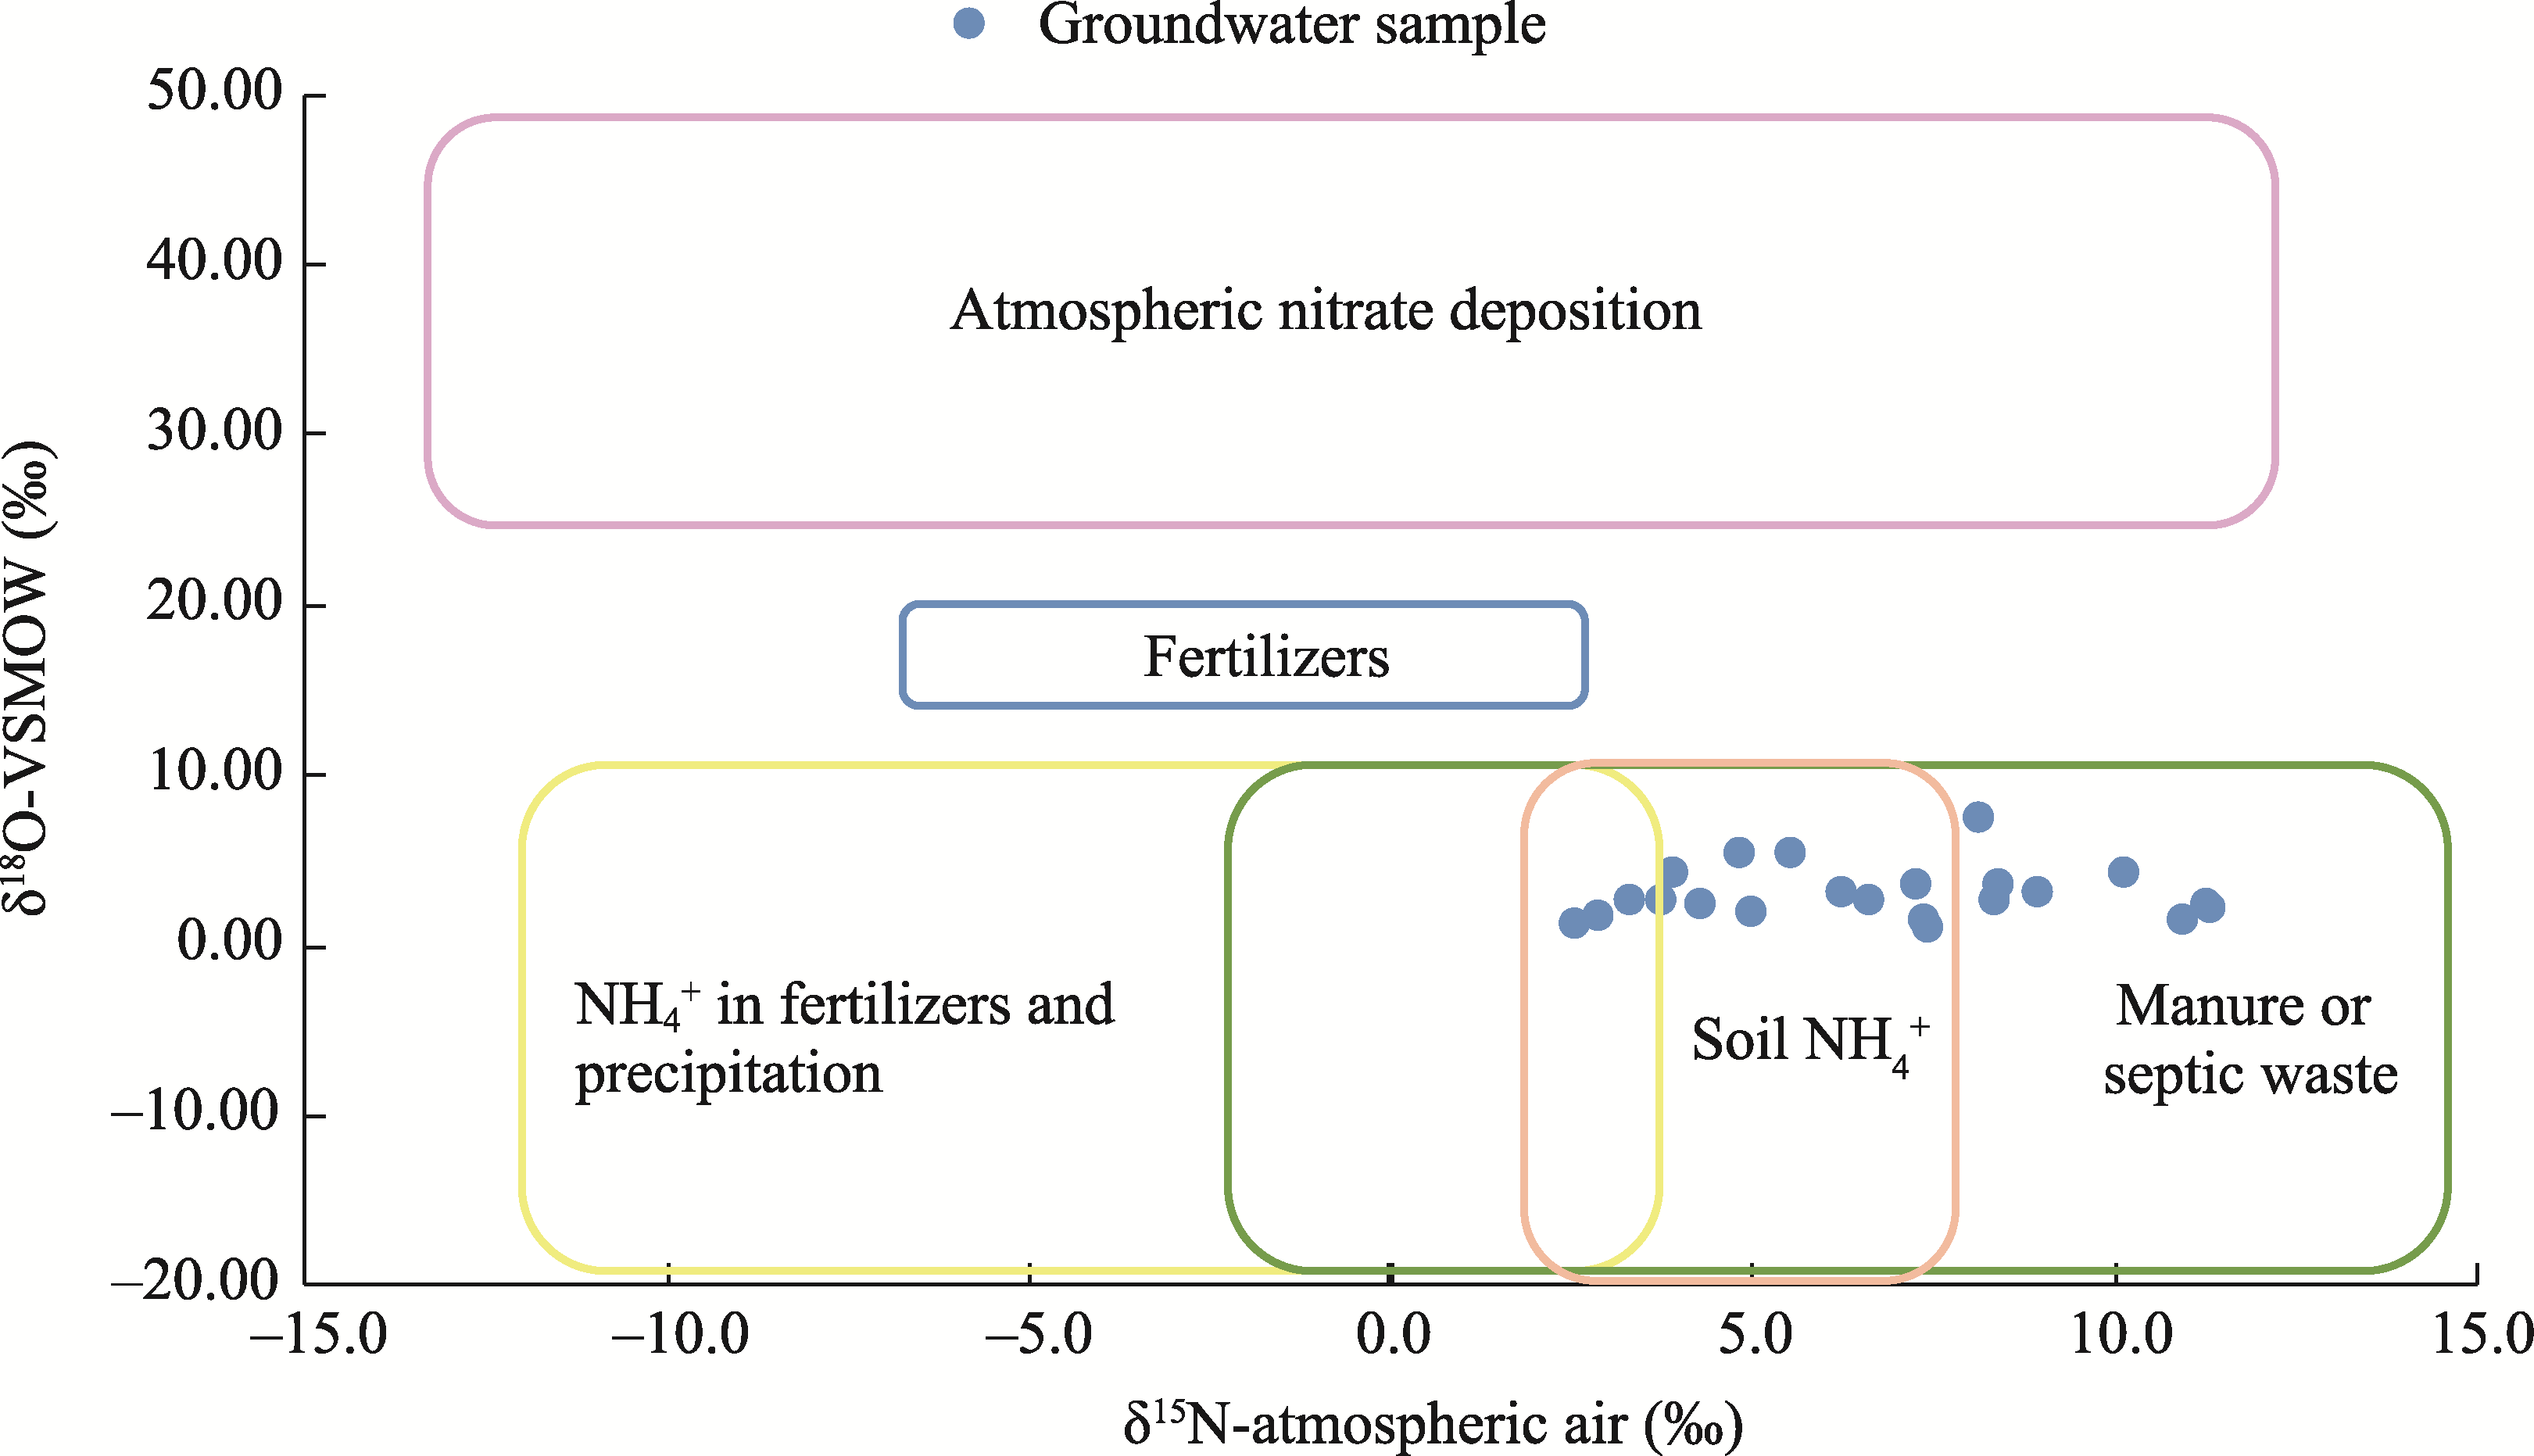
Abstract Globally, groundwater contamination by nitrate is one of the most widespread environmental problems, particularly in arid and semiarid areas, which are characterized by low amounts of rainfall and groundwater recharge. The stable isotope composition of groundwater (δ2H-H2O and δ18O-H2O) and dissolved nitrate (δ15N-NO3- and δ18O-NO3-) and factor analysis (FA) were applied to explore groundwater provenance, pollution, and chemistry evolution in the northwestern part of the Amman-Al Zarqa Basin, Jordan. In this study, we collected 23 samples from the Lower Ajloun aquifer in 2021, including 1 sample from a groundwater well and 22 samples from springs. These samples were tested for electrical conductivity, total dissolved solids, pH, temperature, dissolved oxygen, the concentration of major ions (Ca2+, Mg2+, Na+, K+, HCO3-, Cl-, SO42-, and NO3-), and the stable isotope composition of groundwater and dissolved nitrate. The results revealed that groundwater in the study area is mainly Ca-Mg-HCO3 type and can be classified as fresh water, hard water, and very hard water. The range and average concentration of NO3- were 3.5-230.8 and 50.9 mg/L, respectively. Approximately 33% of the sampling points showed NO3- levels above the maximum allowable concentration of 50.0 mg/L set by the World Health Organization (WHO) guidelines for drinking water quality. The values of δ18O-H2O and δ2H-H2O showed that groundwater in the study area is part of the current water cycle, originating in the Mediterranean Sea, with significant evaporation, orographic, and amount effects. The values of the stable isotope composition of NO3- corresponded to δ15N-NO3- and δ18O-NO3- values produced by the nitrification process of manure or septic waste and soil NH4+. The FA performed on the hydrochemical parameters and isotope data resulted in three main factors, with Factor 1, Factor 2, and Factor 3, accounting for 50%, 21%, and 11% of the total variance, respectively. Factor 1 was considered human-induced factor, named "pollution factor", whereas Factor 2, named "conservative fingerprint factor", and Factor 3, named "hardness factor", were considered natural factors. This study will help local researchers manage groundwater sustainably in the study area and other similar arid and semiarid areas in the world.
|
|
Received: 18 February 2023
Published: 31 December 2023
|
Corresponding Authors:
*Mutawakil OBEIDAT (E-mail: mobeidat@just.edu.jo)
|
|
|
| [1] |
Abascal E, Gómez-Coma L, Ortiz I, et al. 2022. Global diagnosis of nitrate pollution in groundwater and review of removal technologies. Science of The Total Environment, 810: 152233, doi: 10.1016/j.scitotenv.2021.15223.
|
|
|
| [2] |
Abu-Alnaeem M F, Yusoff I, Ng T F, et al. 2018. Assessment of groundwater salinity and quality in Gaza coastal aquifer, Gaza Strip, Palestine: An integrated statistical, geostatistical and hydrogeochemical approaches study. Science of The Total Environment, 615: 972-989.
doi: 10.1016/j.scitotenv.2017.09.320
|
|
|
| [3] |
Adimalla N, Qian H, Nandan M J. 2020. Groundwater chemistry integrating the pollution index of groundwater and evaluation of potential human health risk: A case study from hard rock terrain of south India. Ecotoxicology and Environmental Safety, 206: 111217, doi: 10.1016/j.ecoenv.2020.111217.
|
|
|
| [4] |
Aeschbach-Hertig W, El-Gamal H, Dahab K, et al. 2007. Identifying and dating the origin of groundwater resources in reclamation areas of Egypt. In: Advances in Isotope Hydrology and its Role in Sustainable Water Resources Management. Vienna, Austria.
|
|
|
| [5] |
Afroza R, Mazumder Q H, Jahan C S, et al. 2009. Hydrochemistry and origin of salinity in groundwater in parts of lower Tista floodplain, Northwest Bangladesh. Journal of the Geological Society of India, 74(2): 223-232.
doi: 10.1007/s12594-009-0124-7
|
|
|
| [6] |
Alam S M, Li P, Fida M. 2023. Groundwater nitrate pollution due to excessive use of N-fertilizers in rural areas of Bangladesh: pollution status, health risk, source contribution, and future impacts. Exposure and Health, doi: 10.1007/s12403-023-00545-0.
|
|
|
| [7] |
Al-Alawneh M. 1998. Hydrology and hydrochemistry of Wadi Jerash catchment area. MSc Thesis. Baghdad: University of Baghdad.
|
|
|
| [8] |
Al-Fugara A k, Ahmadlou M, Al-Shabeeb A R, et al. 2022. Spatial mapping of groundwater springs potentiality using grid search-based and genetic algorithm-based support vector regression. Geocarto International, 37(1): 284-303.
doi: 10.1080/10106049.2020.1716396
|
|
|
| [9] |
Al-Kharabsheh A. 2020. Challenges to sustainable water management in Jordan. Jordan Journal of Earth and Environmental Sciences, 11(1): 38-48.
|
|
|
| [10] |
Al Mahamid J. 2005. Integration of water resources of the upper aquifer in Amman-Zarqa basin based on mathematical modeling and GIS, Jordan. Freiberg Online Geology, doi: 10.23689/fidgeo-879.
|
|
|
| [11] |
Al Wreikat M A, Al-Kharabsheh A A. 2020. Impact of over-pumping on groundwater resources sustainability at Amman Zarqa basin, Jordan: A case study of arid areas affected by Syrian refugees crisis. Environmental Earth Sciences, 79(1): 1-8.
doi: 10.1007/s12665-019-8746-6
|
|
|
| [12] |
APHA (American Public Health Association). 1998. Standard Methods for the Examination of Water and Wastewater (20th ed.). Washington DC: American Public Health Association, American Water Works Association, and Water Environmental Federation.
|
|
|
| [13] |
Appelo C A J, Postma D. 2005. Geochemistry, Groundwater and Pollution (2nd ed.). London: A. A. Balkema Publishers.
|
|
|
| [14] |
Aravinthasamy P, Karunanidhi D, Subramani T, et al. 2020. Fluoride contamination in groundwater of the Shanmuganadhi River basin (south India) and its association with other chemical constituents using geographical information system and multivariate statistics. Geochemistry, 80(4): 125555, doi: 10.1016/j.chemer.2019.125555.
|
|
|
| [15] |
Ayadi Y, Mokadem N, Besser H, et al. 2018. Statistical and geochemical assessment of groundwater quality in Teboursouk area (Northwestern Tunisian Atlas). Environmental Earth Sciences, 77(9): 1-20.
doi: 10.1007/s12665-017-7169-5
|
|
|
| [16] |
Bajjali W. 2012. Spatial variability of environmental isotope and chemical content of precipitation in Jordan and evidence of slight change in climate. Applied Water Science, 2(4): 271-283.
doi: 10.1007/s13201-012-0046-1
|
|
|
| [17] |
Barzegar R, Asghari Moghaddam A, Tziritis E. 2017. Hydrogeochemical features of groundwater resources in Tabriz plain, northwest of Iran. Applied Water Science, 7(7): 3997-4011.
doi: 10.1007/s13201-017-0550-4
|
|
|
| [18] |
Bender F. 1974. Geology of Jordan. Berlin: Gebrueder Borntraeger.
|
|
|
| [19] |
Brandes J A, Devol A H. 1997. Isotopic fractionation of oxygen and nitrogen in coastal marine sediments. Geochimica et Cosmochimica Acta, 61(9): 1793-1801.
doi: 10.1016/S0016-7037(97)00041-0
|
|
|
| [20] |
Buzeta R K. 2019. Nitrate contaminant tracing in surface and groundwater in the Great Miami River Watershed:Environmental isotope approach. PhD Dissertation. Dayton: University of Dayton.
|
|
|
| [21] |
Carrey R, Ballesté E, Blanch A R, et al. 2021. Combining multi-isotopic and molecular source tracking methods to identify nitrate pollution sources in surface and groundwater. Water Research, 188: 116537, doi: 10.1016/j.watres.2020.116537.
|
|
|
| [22] |
Chadha D. 1999. A proposed new diagram for geochemical classification of natural waters and interpretation of chemical data. Hydrogeology Journal, 7(5): 431-439.
doi: 10.1007/s100400050216
|
|
|
| [23] |
Craig H. 1961. Isotopic variations in meteoric waters. Science, 133(3465): 1702-1703.
pmid: 17814749
|
|
|
| [24] |
Dansgaard W. 1964. Stable isotopes in precipitation. Tellus, 16(4): 436-468.
|
|
|
| [25] |
Das S, Nag S. 2017. Application of multivariate statistical analysis concepts for assessment of hydrogeochemistry of groundwater—a study in Suri I and II blocks of Birbhum District, West Bengal, India. Applied Water Science, 7(2): 873-888.
doi: 10.1007/s13201-015-0299-6
|
|
|
| [26] |
Durka W, Schulze E D, Gebauer G, et al. 1994. Effects of forest decline on uptake and leaching of deposited nitrate determined from 15N and 18O measurements. Nature, 372(6508): 765-767.
doi: 10.1038/372765a0
|
|
|
| [27] |
Dutton A, Wilkinson B H, Welker J M, et al. 2005. Spatial distribution and seasonal variation in 18O/16O of modern precipitation and river water across the conterminous USA. Hydrological Processes: An International Journal, 19(20): 4121-4146.
|
|
|
| [28] |
El Yaouti F, El Mandour A, Khattach D, et al. 2009. Salinization processes in the unconfined aquifer of Bou-Areg (NE Morocco): A geostatistical, geochemical, and tomographic study. Applied Geochemistry, 24(1): 16-31.
doi: 10.1016/j.apgeochem.2008.10.005
|
|
|
| [29] |
Elmeknassi M, Bouchaou L, El Mandour A, et al. 2022. Multiple stable isotopes and geochemical approaches to elucidate groundwater salinity and contamination in the critical coastal zone: A case from the Bou-areg and Gareb aquifers (North-Eastern Morocco). Environmental Pollution, 300: 118942, doi: 10.1016/j.envpol.2022.118942.
|
|
|
| [30] |
Gat J, Carmi I. 1970. Evolution of the isotopic composition of atmospheric waters in the Mediterranean Sea area. Journal of Geophysical Research, 75(15): 3039-3048.
doi: 10.1029/JC075i015p03039
|
|
|
| [31] |
Gibbs R J. 1970. Mechanisms controlling world water chemistry. Science, 170(3962): 1088-1090.
doi: 10.1126/science.170.3962.1088
pmid: 17777828
|
|
|
| [32] |
Gibrilla A, Fianko J R, Ganyaglo S, et al. 2020. Nitrate contamination and source apportionment in surface and groundwater in Ghana using dual isotopes (15N and 18O-NO3) and a Bayesian isotope mixing model. Journal of Contaminant Hydrology, 233: 103658, doi: 10.1016/j.jconhyd.2020.103658.
|
|
|
| [33] |
Gutiérrez M, Biagioni R N, Alarcón-Herrera M T, et al. 2018. An overview of nitrate sources and operating processes in arid and semiarid aquifer systems. Science of The Total Environment, 624: 1513-1522.
doi: 10.1016/j.scitotenv.2017.12.252
|
|
|
| [34] |
Hammouri N, El-Naqa A. 2007. Hydrological modeling of ungauged wadis in arid environments using GIS: A case study of Wadi Madoneh in Jordan. Revista Mexicana de Ciencias Geológicas, 24(2): 185-196.
|
|
|
| [35] |
Hammouri N, El-Naqa A. 2008. GIS based hydrogeological vulnerability mapping of groundwater resources in Jerash area-Jordan. Geofísica Internacional, 47(2): 85-97.
|
|
|
| [36] |
He S, Li P, Su F, et al. 2022. Identification and apportionment of shallow groundwater nitrate pollution in Weining Plain, northwest China, using hydrochemical indices, nitrate stable isotopes, and the new Bayesian stable isotope mixing model (MixSIAR). Environmental Pollution, 298: 118852, doi: 10.1016/j.envpol.2022.118852.
|
|
|
| [37] |
Hem J D. 1985. Study and Interpretation of the Chemical Characteristics of Natural Water (3rd ed.). Charlottesville: University of Virginia.
|
|
|
| [38] |
Jalali M. 2009. Geochemistry characterization of groundwater in an agricultural area of Razan, Hamadan, Iran. Environmental Geology, 56(7): 1479-1488.
doi: 10.1007/s00254-008-1245-9
|
|
|
| [39] |
Jasechko S, Perrone D, Befus K M, et al. 2016. Global aquifers dominated by fossil groundwaters but wells vulnerable to modern contamination. Nature Geoscience, 10: 425-429.
doi: 10.1038/ngeo2943
|
|
|
| [40] |
Jia H, Howard K, Qian H. 2020. Use of multiple isotopic and chemical tracers to identify sources of nitrate in shallow groundwaters along the northern slope of the Qinling Mountains, China. Applied Geochemistry, 113: 104512, doi: 10.1016/j.apgeochem.2019.104512.
|
|
|
| [41] |
Jordan Standards, and Metrology Organization. 2015. Water-Drinking Water, Technical Regulation. [2023-01-27]. https://www.unhcr.org/jo/wp-ontent/uploads/sites/60/2019/08/Annex-A-1-Technical-Regulation-of-Jordan-Standards-and-Metrology-Organization.pdf.
|
|
|
| [42] |
Jung H, Koh D-C, Kim Y S, et al. 2020. Stable isotopes of water and nitrate for the identification of groundwater flowpaths: A review. Water, 12(1): 138, doi: 10.3390/w12010138.
|
|
|
| [43] |
Kaown D, Koh D-C, Mayer B, et al. 2009. Identification of nitrate and sulfate sources in groundwater using dual stable isotope approaches for an agricultural area with different land use (Chuncheon, mid-eastern Korea). Agriculture, Ecosystems & Environment, 132(3-4): 223-231.
doi: 10.1016/j.agee.2009.04.004
|
|
|
| [44] |
Kattan Z. 2019. Factors controlling stable isotopes variability in precipitation in Syria: Statistical analysis approach. Journal of Earth System Science, 128(6): 1-25.
doi: 10.1007/s12040-018-1037-x
|
|
|
| [45] |
Kendall C. 1998. Tracing Nitrogen Sources and Cycling in Catchments. Amsterdam: Elsevier.
|
|
|
| [46] |
Kendall C, Elliott E M, Wankel S D. 2007. Tracing anthropogenic inputs of nitrogen to ecosystems. In: Michener R, Lajtha K. Stable Isotopes in Ecology and Environmental Science (2nd ed.). doi: 10.1002/9780470691854.ch12.
|
|
|
| [47] |
Koba K, Tokuchi N, Wada E, et al. 1997. Intermittent denitrification: the application of a 15N natural abundance method to a forested ecosystem. Geochimica et Cosmochimica Acta, 61(23): 5043-5050.
doi: 10.1016/S0016-7037(97)00284-6
|
|
|
| [48] |
Kou X, Ding J, Li Y, et al. 2021. Tracing nitrate sources in the groundwater of an intensive agricultural region. Agricultural Water Management, 250: 106826, doi: 10.1016/j.agwat.2021.106826.
|
|
|
| [49] |
Lee K S, Bong Y S, Lee D, et al. 2008. Tracing the sources of nitrate in the Han River watershed in Korea, using δ15N-NO3- and δ18O-NO3- values. Science of The Total Environment, 395(2-3): 117-124.
doi: 10.1016/j.scitotenv.2008.01.058
|
|
|
| [50] |
Li P, Qian H. 2018. Water resouorces research to support as sustinable China. International Journal of Water Resources Development, 34(3): 327-336.
doi: 10.1080/07900627.2018.1452723
|
|
|
| [51] |
Li P, Wang D, Li W, et al. 2022. Sustainable water resources development and management in large river basins: An introduction. Environmental Earth Sciences, 81: 179, doi: 10.1007/s12665-022-10298-9.
pmid: 35280111
|
|
|
| [52] |
Linhoff B. 2022. Deciphering natural and anthropogenic nitrate and recharge sources in arid region groundwater. Science of The Total Environment, 848: 157345, doi: 10.1016/j.scitotenv.2022.157345.
|
|
|
| [53] |
Liu J, Gao Z, Feng J, et al. 2023. Identification of the hydrochemical features, genisis, water quality and potential health hazards of groundwater in Dawen River Basin, North China. Ecological Indicators, 149: 110175, doi: 10.1016/j.ecolind. 2023.110175.
|
|
|
| [54] |
Machiwal D, Cloutier V, Güler C, et al. 2018. A review of GIS-integrated statistical techniques for groundwater quality evaluation and protection. Environmental Earth Sciences, 77(19): 1-30.
doi: 10.1007/s12665-017-7169-5
|
|
|
| [55] |
Marandi A, Shand P. 2018. Groundwater chemistry and Gibbs diagram. Applied Geochemistry, 97: 209-212.
doi: 10.1016/j.apgeochem.2018.07.009
|
|
|
| [56] |
Mayer B, Bollwerk S M, Mansfeldt T, et al. 2001. The oxygen isotope composition of nitrate generated by nitrification in acid forest floors. Geochimica et Cosmochimica Acta, 65(16): 2743-2756.
doi: 10.1016/S0016-7037(01)00612-3
|
|
|
| [57] |
Mayer B, Boyer E W, Goodale C, et al. 2002. Sources of nitrate in rivers draining sixteen watersheds in the northeastern US: Isotopic constraints. Biogeochemistry, 57(1): 171-197.
|
|
|
| [58] |
Mcilvin M R, Altabet M A. 2005. Chemical conversion of nitrate and nitrite to nitrous oxide for nitrogen and oxygen isotopic analysis in freshwater and seawater. Analytical Chemistry, 77(17): 5589-5595.
doi: 10.1021/ac050528s
pmid: 16131070
|
|
|
| [59] |
Meybeck M. 1987. Global chemical weathering of surficial rocks estimated from river dissolved loads. American Journal of Science, 287(5): 401-428.
doi: 10.2475/ajs.287.5.401
|
|
|
| [60] |
MWI (Ministry of Water and Irrigation). 2023. National Water Strategy 2023-2040: Summary. Jordan: Ministry of Water and Irrigation.
|
|
|
| [61] |
Obeidat M M, Massadeh A M, Al-Ajlouni A M, et al. 2007. Analysis and evaluation of nitrate levels in groundwater at Al-Hashimiya area, Jordan. Environmental Monitoring and Assessment, 135: 475-486.
pmid: 17492487
|
|
|
| [62] |
Obeidat M, Awawdeh M, Abu Al-Rub F, et al. 2012. An innovative nitrate pollution index and multivariate statistical investigations of groundwater chemical quality of Umm Rijam Aquifer (B4), North Yarmouk River Basin, Jordan. In: Voudouris V. Water Quality Monitoring and Assessment. Croatia: InTech.
|
|
|
| [63] |
Obeidat M, Awawdeh M, Abu Al-Rub F. 2013. Multivariate statistical analysis and environmental isotopes of Amman/Wadi Sir (B2/A7) groundwater, Yarmouk river Basin, Jordan. Hydrological Processes, 27(17): 2449-2461.
doi: 10.1002/hyp.v27.17
|
|
|
| [64] |
Obeidat M, Awawdeh M, Matiatos I, et al. 2021a. Identification and apportionment of nitrate sources in the phreatic aquifers in Northern Jordan using a dual isotope method (δ15N and δ18O of NO3-). Groundwater for Sustainable Development, 12: 100505, doi: 10.1016/j.gsd.2020.100505.
|
|
|
| [65] |
Obeidat M, Awawdeh M, Al-Kharabsheh N, et al. 2021b. Source identification of nitrate in the upper aquifer system of the Wadi Shueib catchment area in Jordan based on stable isotope composition. Journal of Arid Land, 13(4): 350-374.
doi: 10.1007/s40333-021-0055-8
|
|
|
| [66] |
Panno S, Kelly W, Martinsek A, et al. 2006. Estimating background and threshold nitrate concentrations using probability graphs. Groundwater, 44(5): 697-709.
pmid: 16961492
|
|
|
| [67] |
Popescu R, Mimmo T, Dinca O R, et al. 2015. Using stable isotopes in tracing contaminant sources in an industrial area: A case study on the hydrological basin of the Olt River, Romania. Science of The Total Environment, 533: 17-23.
doi: 10.1016/j.scitotenv.2015.06.078
|
|
|
| [68] |
Prasanna M V, Chidambaram S, Srinivasamoorthy K. 2010. Statistical analysis of the hydrogeochemical evolution of groundwater in hard and sedimentary aquifers system of Gadilam river basin, South India. Journal of King Saud University-Science, 22(3): 133-145.
doi: 10.1016/j.jksus.2010.04.001
|
|
|
| [69] |
Qu S, Duan L, Mao H, et al. 2023. Hydrochemical and isotopic fingerprints of groundwater origin and evolution in the Urangulan River Basin, China's Loess Plateau. Science of The Total Environment, 866: 161377, doi: 10.1016/j.scitotenv.2022.161377.
|
|
|
| [70] |
Reddy A G S, Niranjan Kumar K, Subba Rao D, et al. 2009. Assessment of nitrate contamination due to groundwater pollution in north eastern part of Anantapur District, A.P. India. Environmental Monitoring and Assessment, 148(1): 463-476.
doi: 10.1007/s10661-008-0176-y
|
|
|
| [71] |
Ren X, Li P, He X, et al. 2021. Hydrogeochemical processes affecting groundwater chemistry in the central part of the Guanzhong Basin, China. Archives of Environmental Contamination and Toxicology, 80(1): 74-91.
doi: 10.1007/s00244-020-00772-5
pmid: 33146757
|
|
|
| [72] |
Rezaei A, Hassani H, Tziritis E, et al. 2020. Hydrochemical characterization and evaluation of groundwater quality in Dalgan basin, SE Iran. Groundwater for Sustainable Development, 10: 100353, doi: 10.1016/j.gsd.2020.100353.
|
|
|
| [73] |
Rimawi O. 1985. Hydrochemistry and isotope hydrology of groundwater and surface water in the north-east of Mafraq, Dhuleil, Hallabat, Azraq basin. PhD Dissertation. Munich: Technical University of Munich.
|
|
|
| [74] |
Rozanski K, Araguás-Araguás L, Gonfiantini R. 1993. Isotopic patterns in modern global precipitation. Geophysical Monograph-American Geophysical Union, 78, doi: 10.1029/GM078p0001.
|
|
|
| [75] |
Sajil Kumar P, James E. 2016. Identification of hydrogeochemical processes in the Coimbatore district, Tamil Nadu, India. Hydrological Sciences Journal, 61(4): 719-731.
|
|
|
| [76] |
Salameh E, Alraggad M, Tarawneh A. 2014. Natural salinity sources in the groundwaters of Jordan-importance of sustainable aquifer management. Geochemistry, 74(4): 735-747.
doi: 10.1016/j.chemer.2014.04.007
|
|
|
| [77] |
Salameh E, Bannayan H. 1993. Water Resources of Jordan. Future and Future Potentials. Amman: Friedrich Ebert Stiftung.
|
|
|
| [78] |
Salman A, Al-Qinna M, Al-Kuisi M. 2014. Spatial analysis of soil and shallow groundwater physiochemical parameters in El-Mujib Basin-central Jordan. Journal of Asian Earth Sciences, 79: 366-381.
doi: 10.1016/j.jseaes.2013.10.008
|
|
|
| [79] |
Samtio M S, Hakro A A A, Jahangier T M, et al. 2023. Impact of rock-water interaction on hydrogeochemical characteristcs of groundwater: using multivariate statistical, water quality idex and irrigation indices of chachro sub-district, thar desert, sindh, Pakistan. Groundwater for Sustainable Development, 20: 1008878, doi: 10.1016/j.gsd.2022.100878.
|
|
|
| [80] |
Schoeller H. 1977. Geochemistry of Groundwater. Groundwater Studies, An International Guide for Research and Practice. Paris: UNESCO.
|
|
|
| [81] |
Selvam S, Venkatramanan S, Chung S. 2016. Identification of groundwater contamination sources in Dindugal district of Tamil Nadu, India using GIS and multivariate statistical analyses. Arabian Journal of Geosciences, 9(5): 1-14.
doi: 10.1007/s12517-015-2098-7
|
|
|
| [82] |
Silva S, Kendall C, Wilkison D, et al. 2000. A new method for collection of nitrate from fresh water and the analysis of nitrogen and oxygen isotope ratios. Journal of Hydrology, 228(1-2): 22-36.
doi: 10.1016/S0022-1694(99)00205-X
|
|
|
| [83] |
Su F, Wu J, Wang D, et al. 2022. Moisture movement, soil salt migration, and nitrogen transformation under different irrigation conditions: field experimental research. Chemosphere, 300: 134569, doi: 10.1016/j.chemosphere.2022.134569.
|
|
|
| [84] |
Tarawneh M S M, Janardhana M, Ahmed M M. 2019. Hydrochemical processes and groundwater quality assessment in North eastern region of Jordan valley, Jordan. HydroResearch, 2: 129-145.
doi: 10.1016/j.hydres.2020.02.001
|
|
|
| [85] |
Tiwari A K, Pisciotta A,De Maio M. 2019. Evaluation of groundwater salinization and pollution level on Favignana Island, Italy. Environmental Pollution, 249: 969-981.
doi: S0269-7491(18)34059-4
pmid: 31146317
|
|
|
| [86] |
Todd D K. 1980. Groundwater Hydrology. New York: Wiley.
|
|
|
| [87] |
Torres-Martínez J A, Mora A, Knappett P S, et al. 2020. Tracking nitrate and sulfate sources in groundwater of an urbanized valley using a multi-tracer approach combined with a Bayesian isotope mixing model. Water Research, 182: 115962, doi: 10.1016/j.watres.2020.115962.
|
|
|
| [88] |
Toumi N, Hussein B H, Rafrafi S. 2015. Groundwater quality and hydrochemical properties of Al-Ula region, Saudi Arabia. Environmental Monitoring and Assessment, 187(3): 1-16.
doi: 10.1007/s10661-014-4167-x
|
|
|
| [89] |
UN (United Nations). 2019. The Sustainable Development Goals Report. New York: United Nations.
|
|
|
| [90] |
Venkatesan S, Arumugam S, Bagyaraj M, et al. 2021. Spatial assessment of groundwater quantity and quality: A case study in parts of Chidambaram Taluk, Cuddalore District, Tamil Nadu, India. Sustainable Water Resources Management, 7(6): 1-17.
|
|
|
| [91] |
Wang S, Zheng W, Currell M, et al. 2017. Relationship between land-use and sources and fate of nitrate in groundwater in a typical recharge area of the North China Plain. Science of The Total Environment, 609: 607-620.
doi: 10.1016/j.scitotenv.2017.07.176
|
|
|
| [92] |
Weyhenmeyer G A, Hartmann J, Hessen D O, et al. 2019. Widespread diminishing anthropogenic effects on calcium in freshwaters. Scientific Reports, 9: 10450, doi: 10.1038/s41598-019-46838-w.
pmid: 31320731
|
|
|
| [93] |
WHO (World Health Organization). 2011. Guidelines for drinking-water quality. WHO Chronicle, 38(4): 104-108.
|
|
|
| [94] |
Wu J, Li P, Qian H, et al. 2014. Using correlation and multivariate statistical analysis to identify hydrogeochemical processes affecting the major ion chemistry of waters: A case study in Laoheba phosphorite mine in Sichuan, China. Arabian Journal of Geosciences, 7: 3973-3982.
doi: 10.1007/s12517-013-1057-4
|
|
|
| [95] |
Xue D, Botte J, De Baets B, et al. 2009. Present limitations and future prospects of stable isotope methods for nitrate source identification in surface-and groundwater. Water Research, 43(5): 1159-1170.
doi: 10.1016/j.watres.2008.12.048
|
|
|
| [96] |
Yang H, Xiao Y, Hao Q, et al. 2023. Geochemical characteristics, mechanisms and suitability for sustainable municipal and agricultural water supply of confined groundwater in central North China plain. Urban Climate, 49: 101459, doi: 10.1016/j.uclim.2023.101459.
|
|
|
| [97] |
Zaidi F K, Nazzal Y, Jafri M K, et al. 2015. Reverse ion exchange as a major process controlling the groundwater chemistry in an arid environment: A case study from northwestern Saudi Arabia. Environmental Monitoring and Assessment, 187(10): 1-18.
doi: 10.1007/s10661-014-4167-x
|
|
|
| [98] |
Zhang Q, Shu W, Li F, et al. 2022. Nitrate source apportionment and risk assessment: A study in the largest ion-adsorption rare earth mine in China. Environmental Pollution, 302: 119052, doi: 10.1016/j.envpol.2022.119052.
|
|
|
| [99] |
Zhang Y, Zhang Q, Chen W, et al. 2023. Hydrochemical analysis and groundwater pollution source identification based on self-organizing map at a contaminated site. Journal of Hydrology, 616: 128839, doi: 10.1016/j.jhydrol.2022.128839.
|
|
|
| [100] |
Zhu A, Chen J, Gao L, et al. 2019. Combined microbial and isotopic signature approach to identify nitrate sources and transformation processes in groundwater. Chemosphere, 228: 721-734.
doi: S0045-6535(19)30817-3
pmid: 31071559
|
|
|
|
Viewed |
|
|
|
Full text
|
|
|
|
|
Abstract
|
|
|
|
|
Cited |
|
|
|
|
| |
Shared |
|
|
|
|
| |
Discussed |
|
|
|
|