| Research article |
|


|
|
|
| Host plant traits play a crucial role in shaping the composition of epiphytic microbiota in the arid desert, Northwest China |
ZHANG Jun1,2,3, ZHANG Yuanming1,2,3,*( ), ZHANG Qi4 ), ZHANG Qi4 |
1State Key Laboratory of Desert and Oasis Ecology, Key Laboratory of Ecological Safety and Sustainable Development in Arid Lands, Xinjiang Institute of Ecology and Geography, Chinese Academy of Sciences, Urumqi 830011, China
2Xinjiang Key Laboratory of Biodiversity Conservation and Application in Arid Lands, Xinjiang Institute of Ecology and Geography, Chinese Academy of Sciences, Urumqi 830011, China
3Xinjiang Field Scientific Observation Research Station of Tianshan Wild Fruit Forest Ecosystem, Yili Botanical Garden, Xinjiang Institute of Ecology and Geography, Chinese Academy of Sciences, Urumqi 830011, China
4College of Life Sciences, Shihezi University, Shihezi 832003, China |
|
|
|
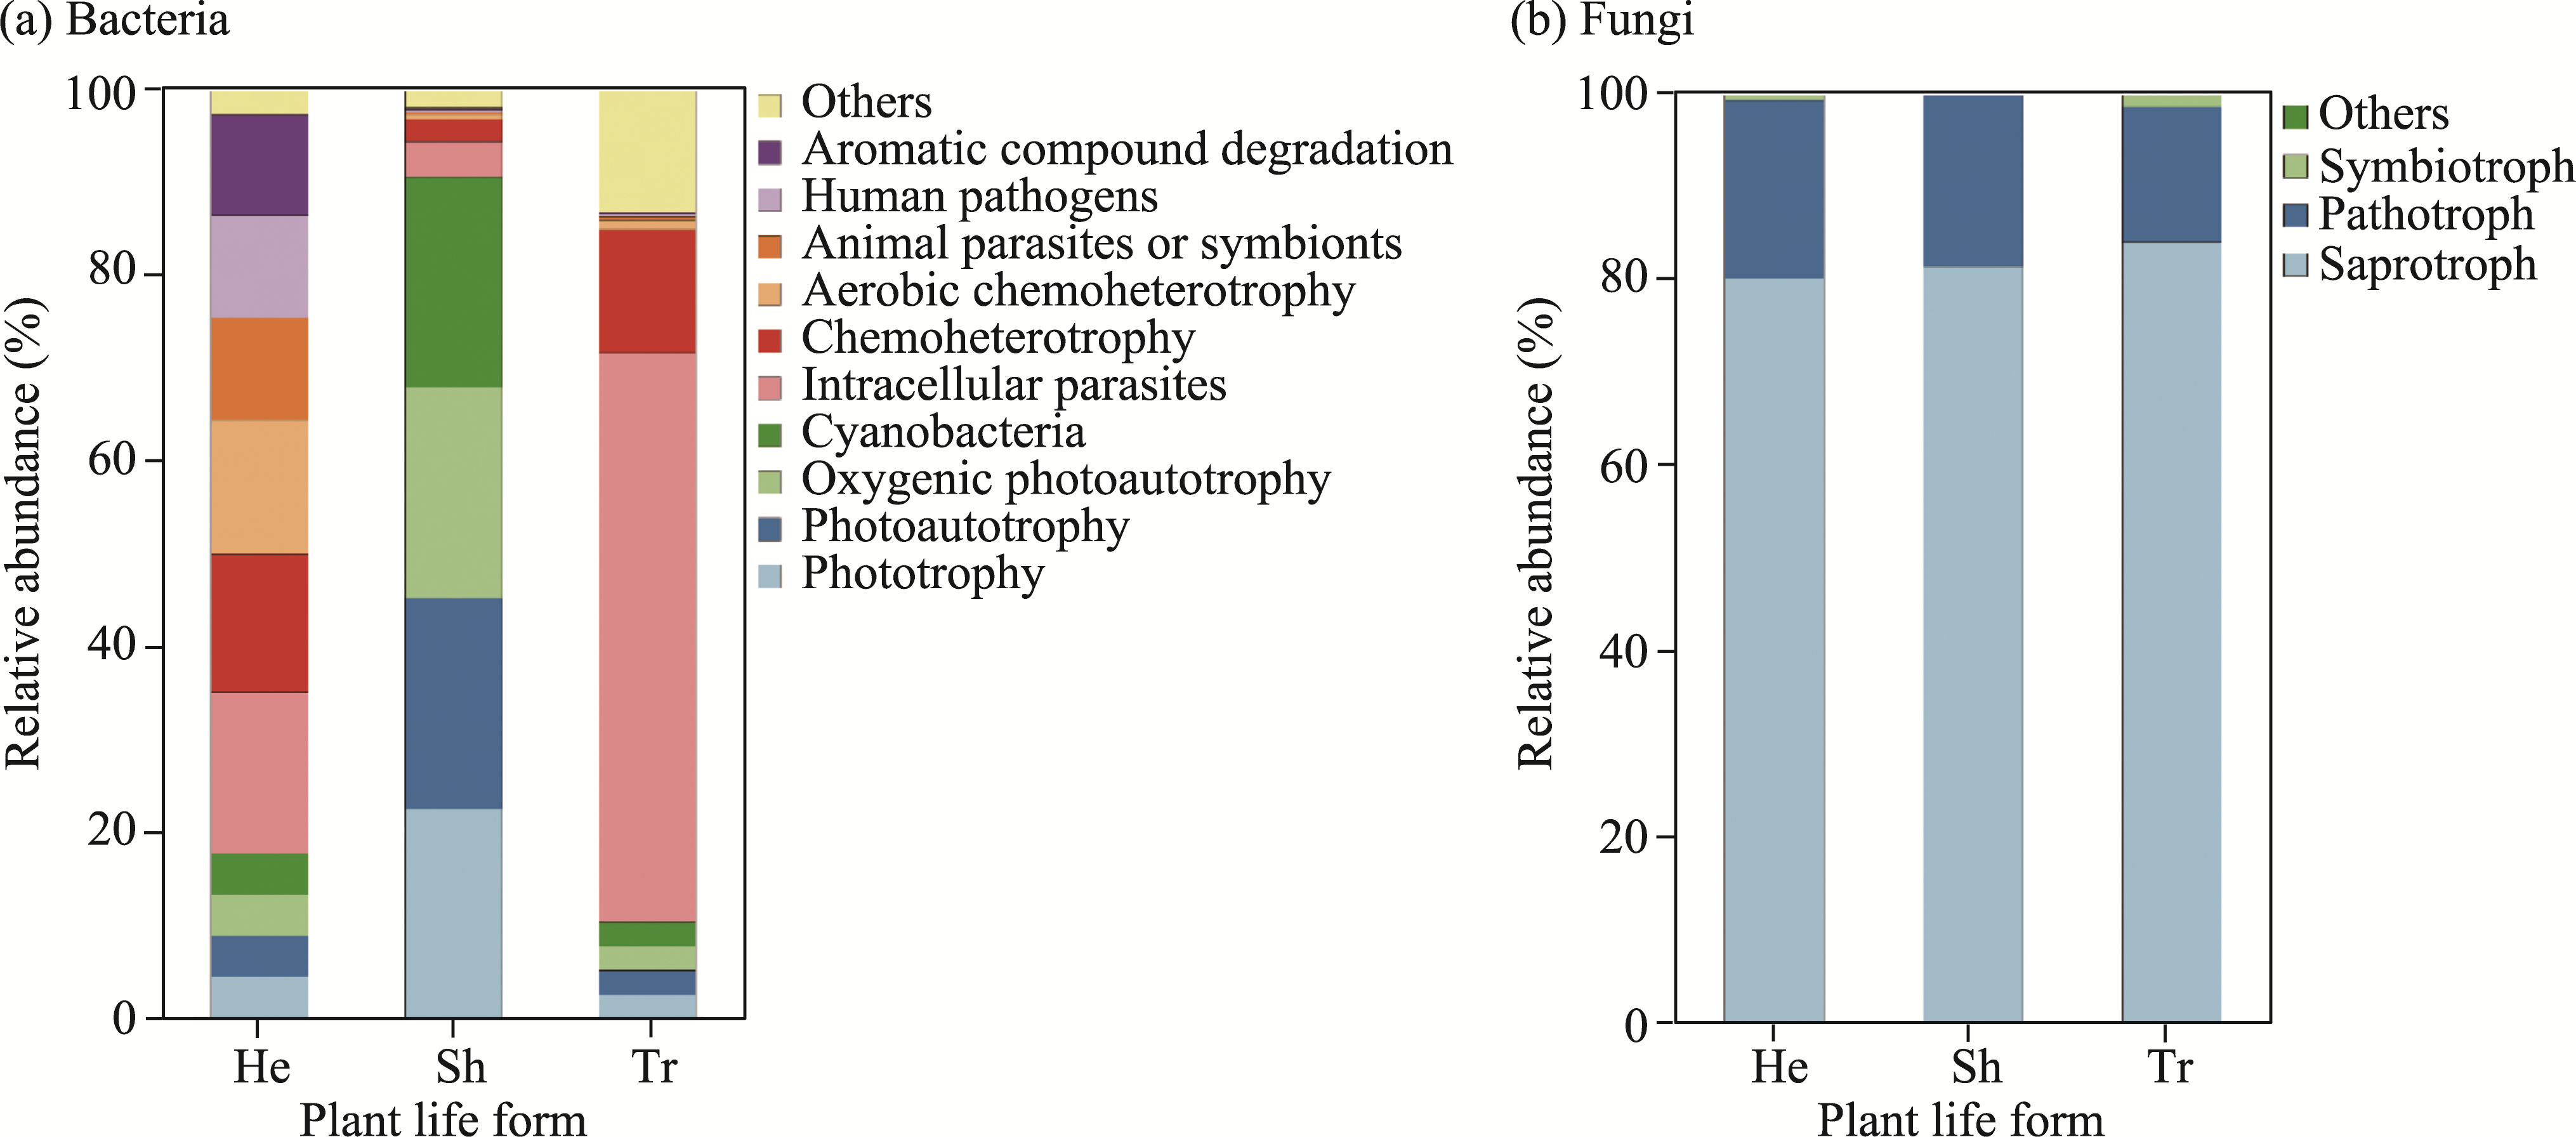
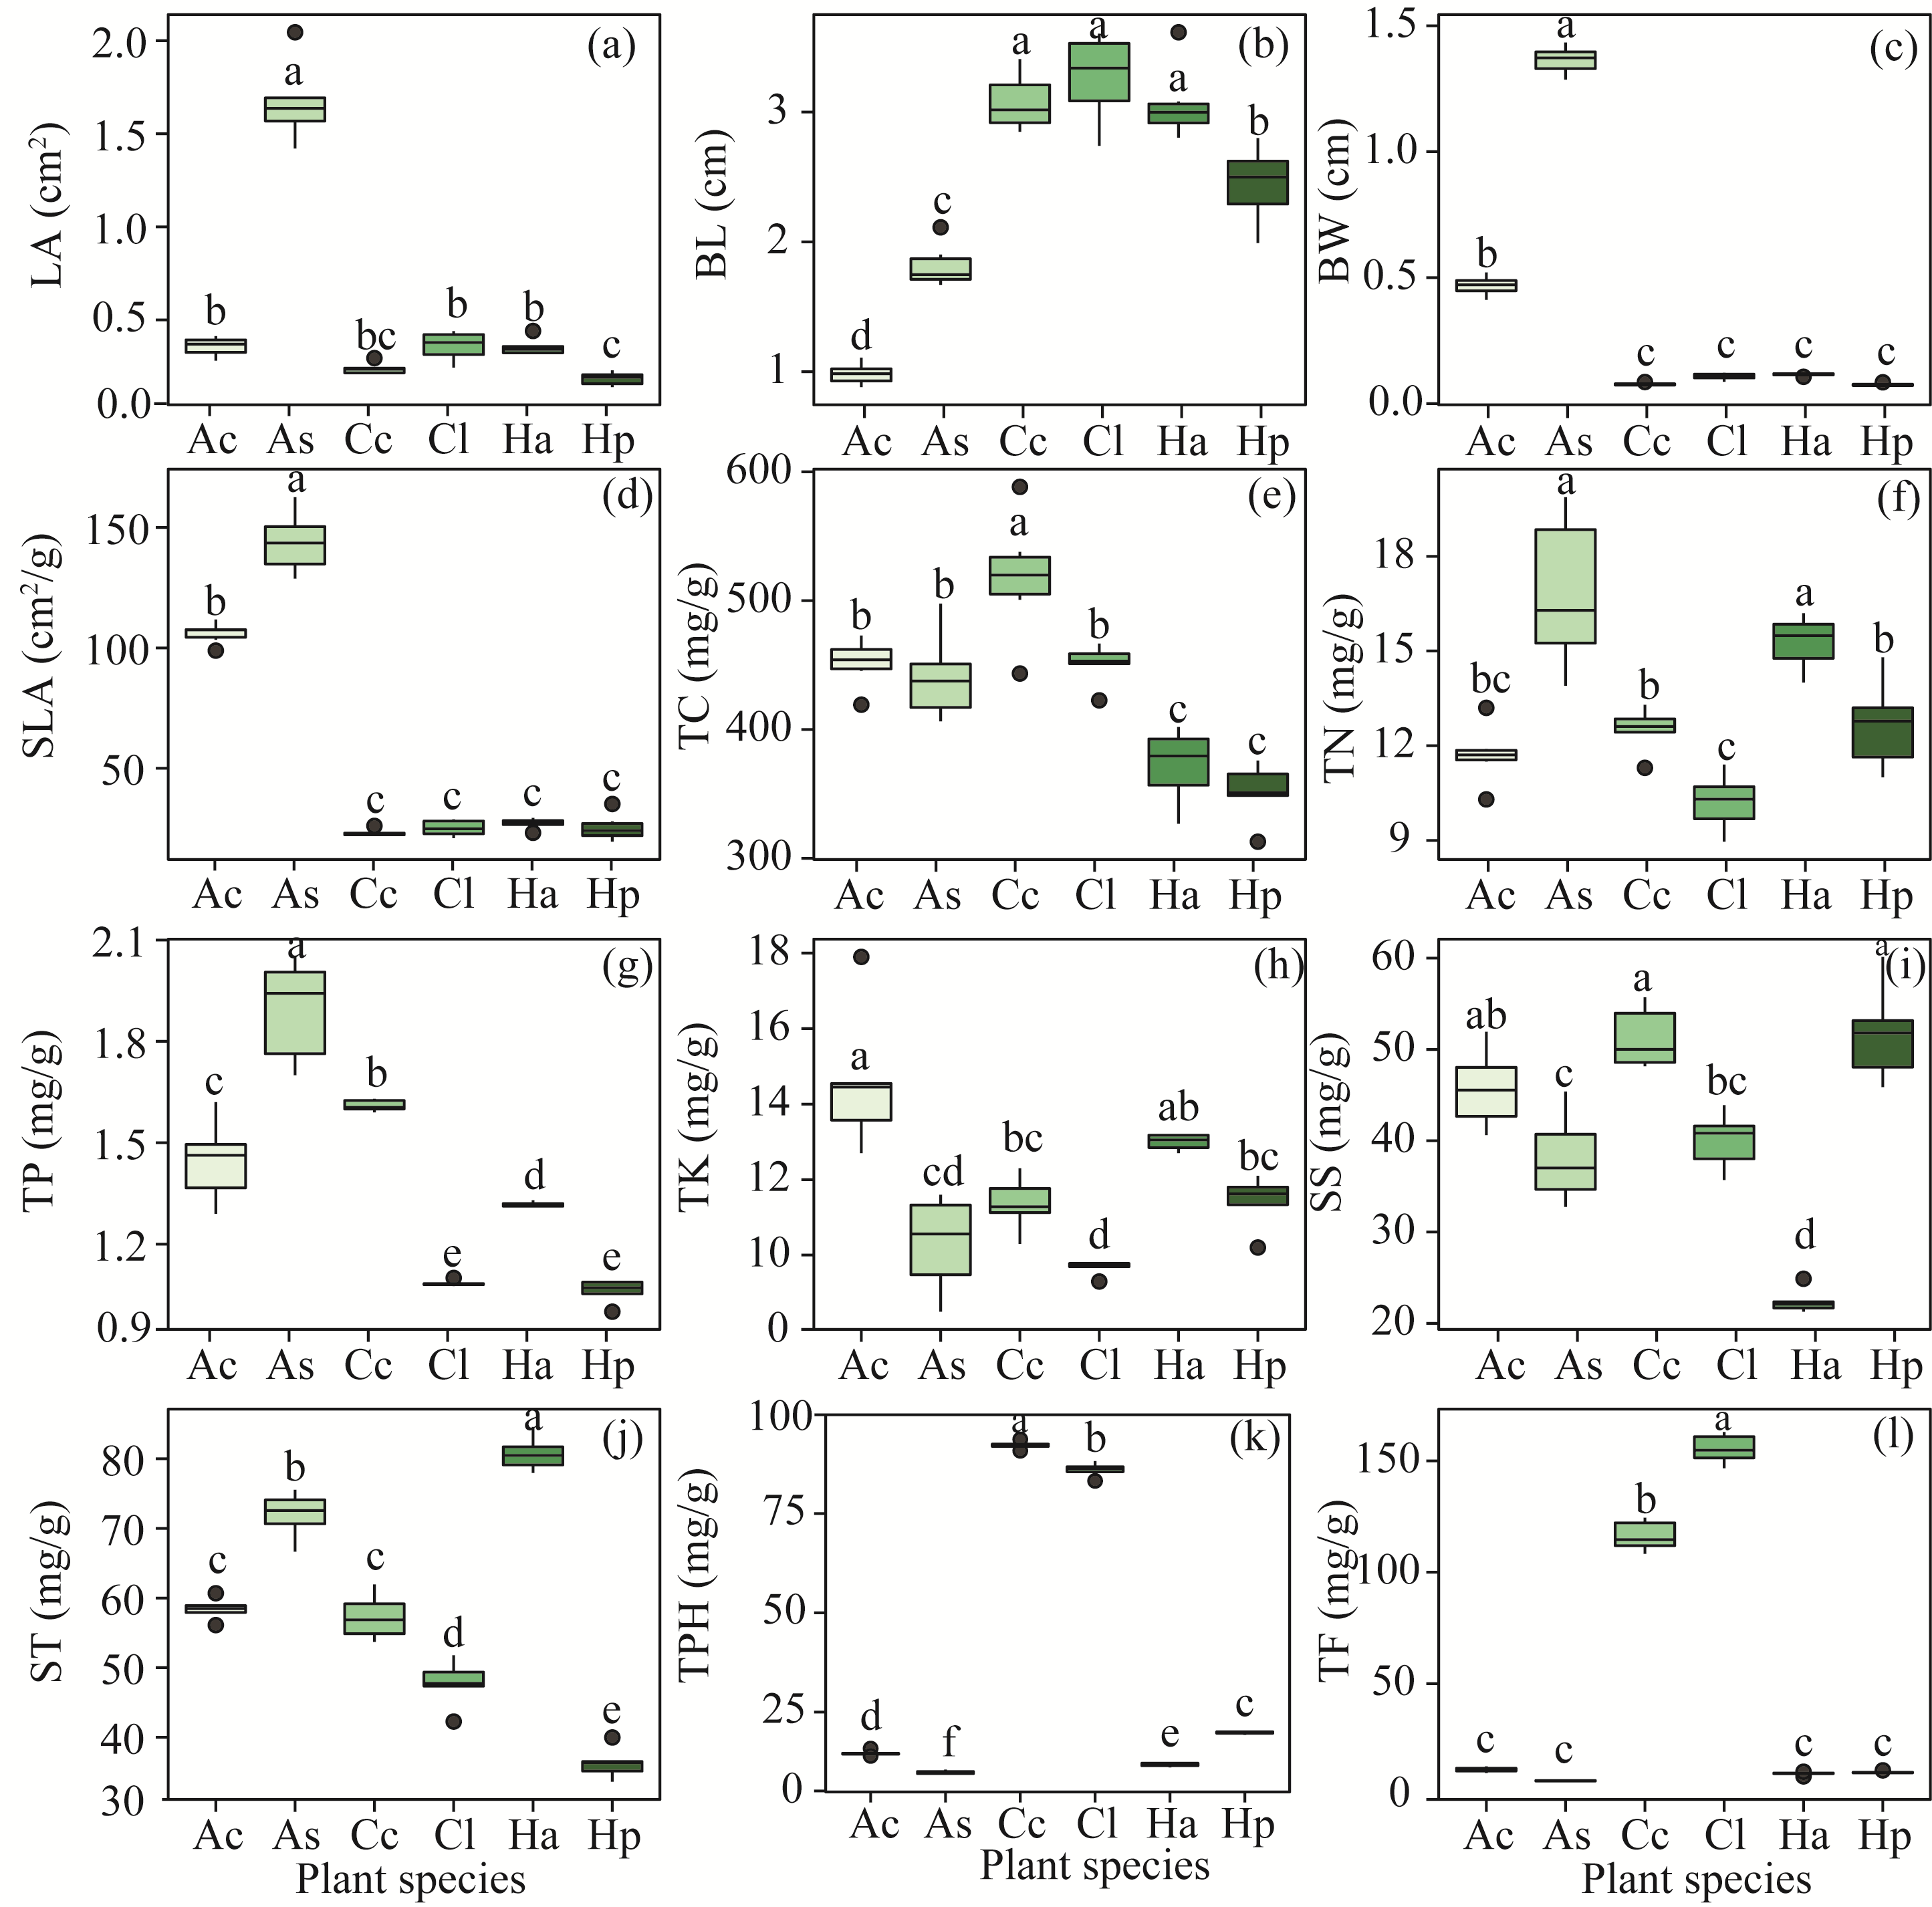
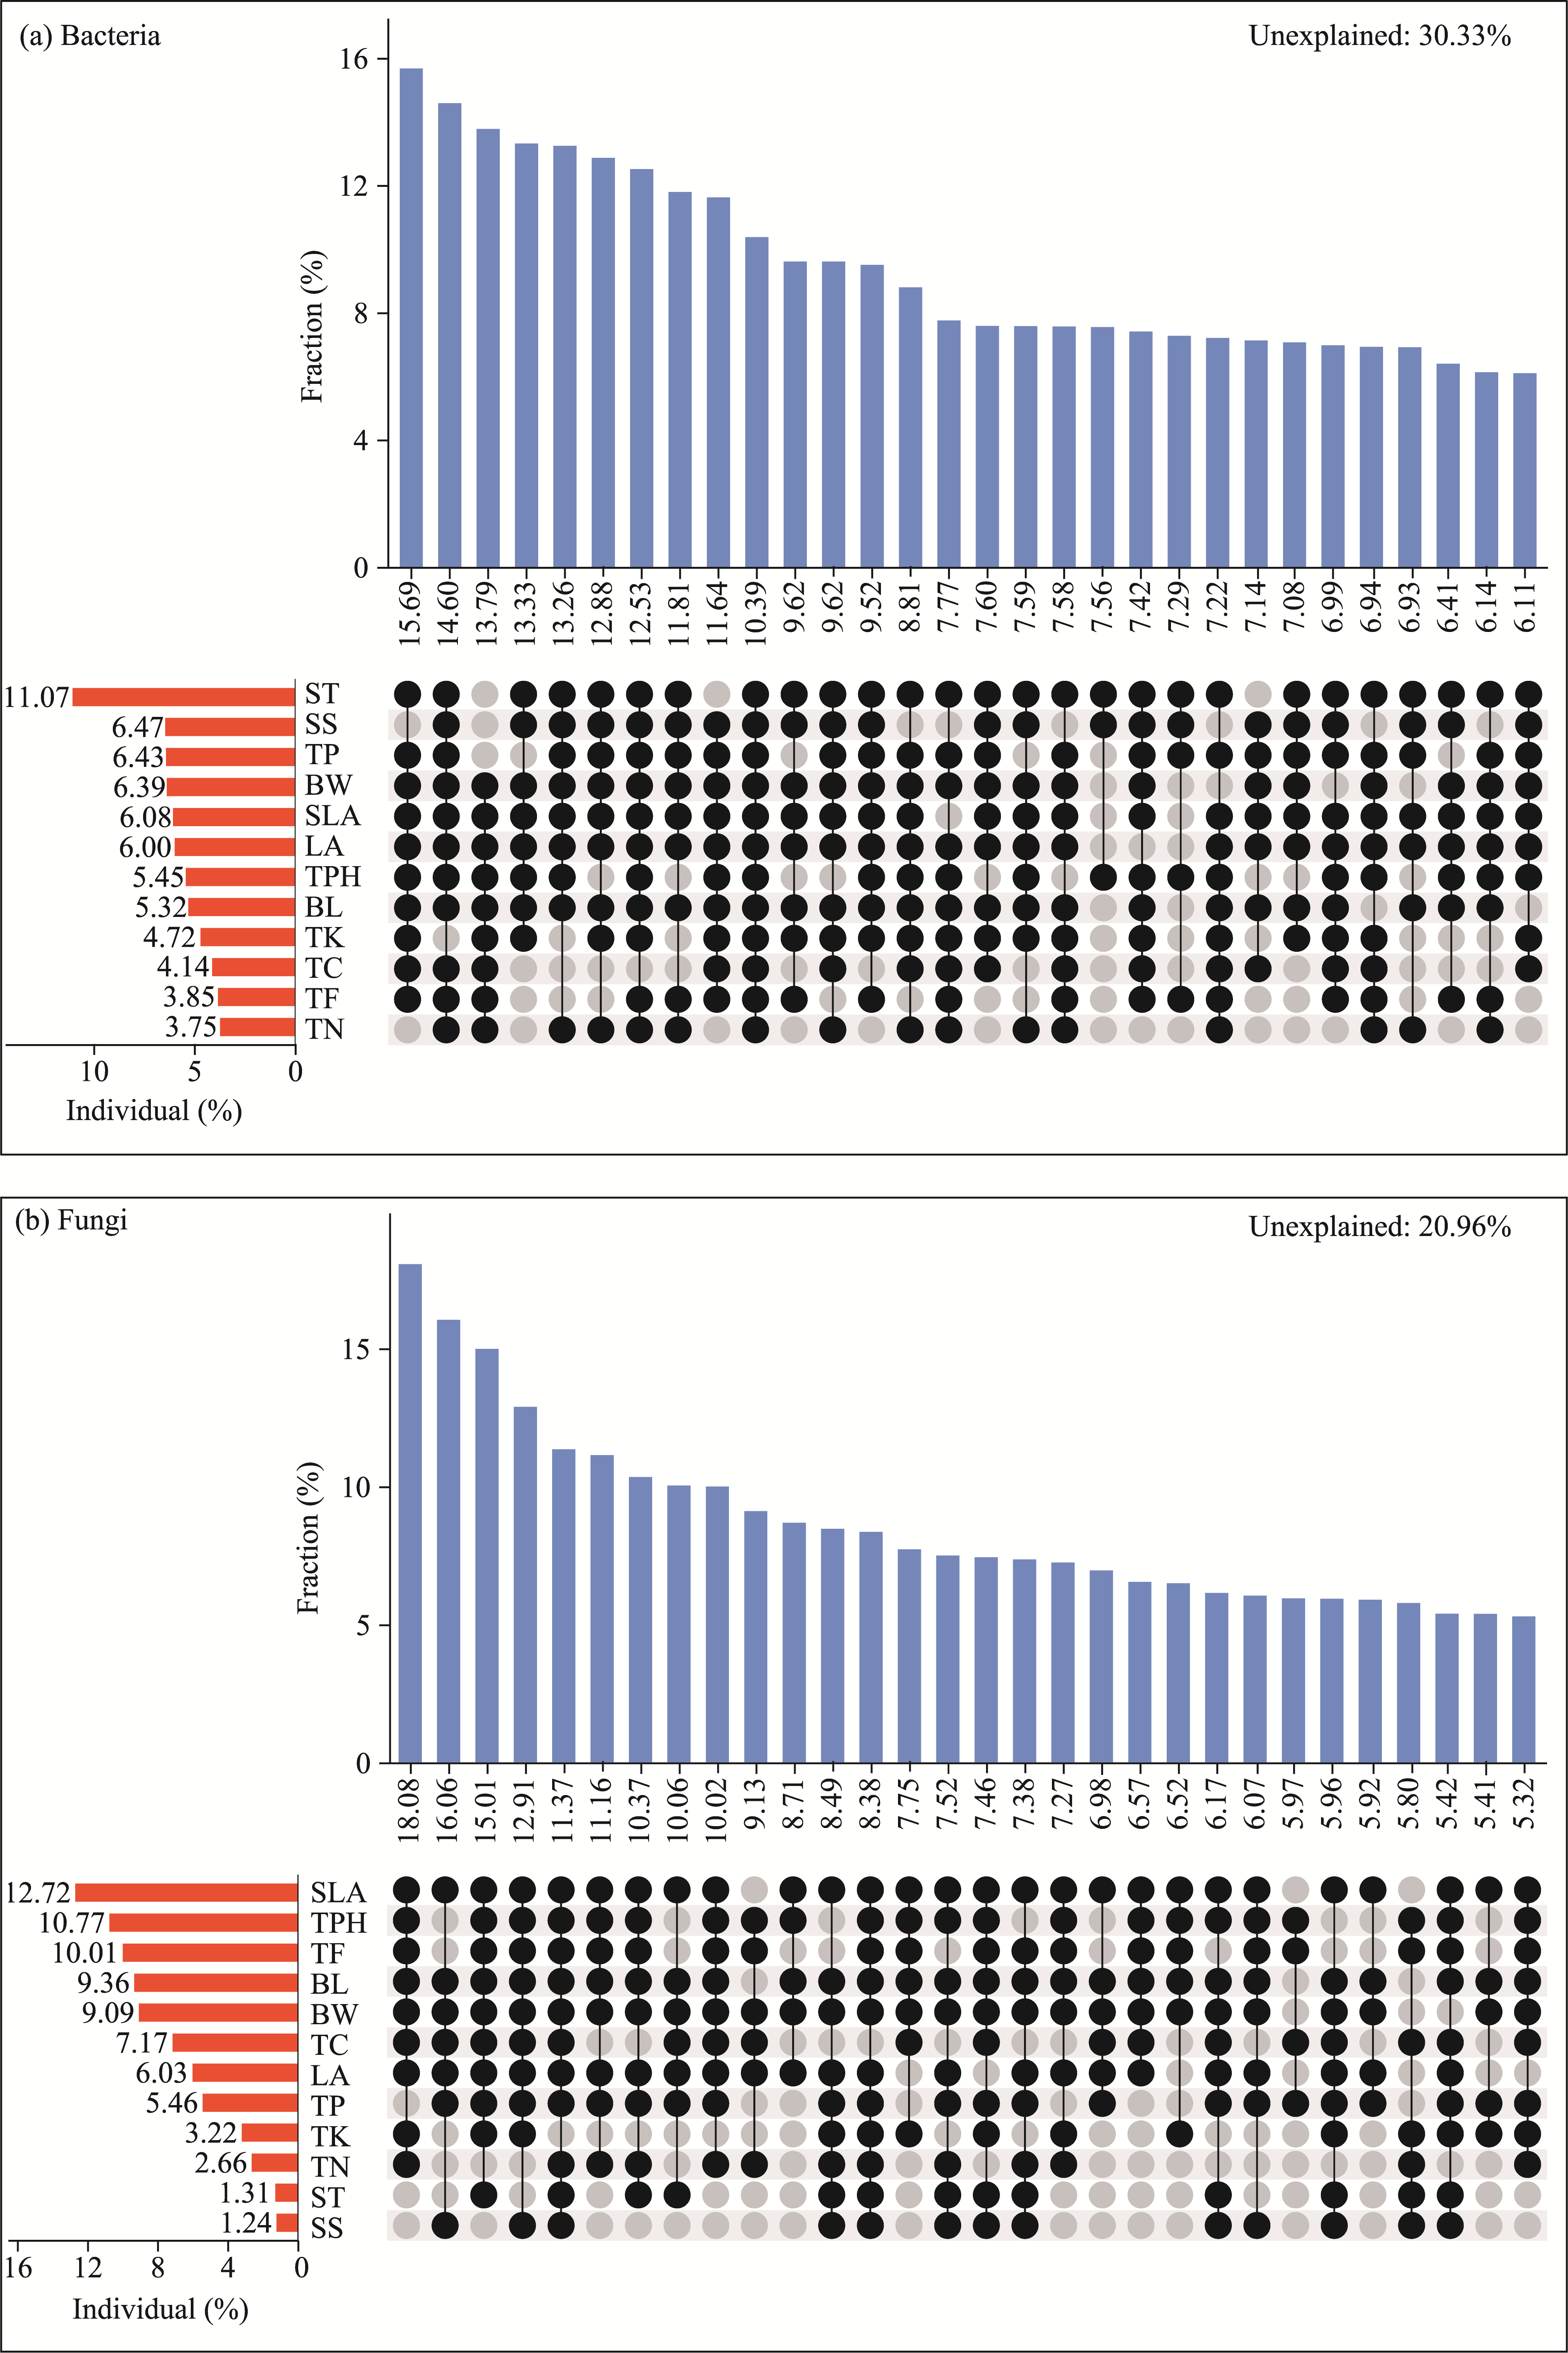
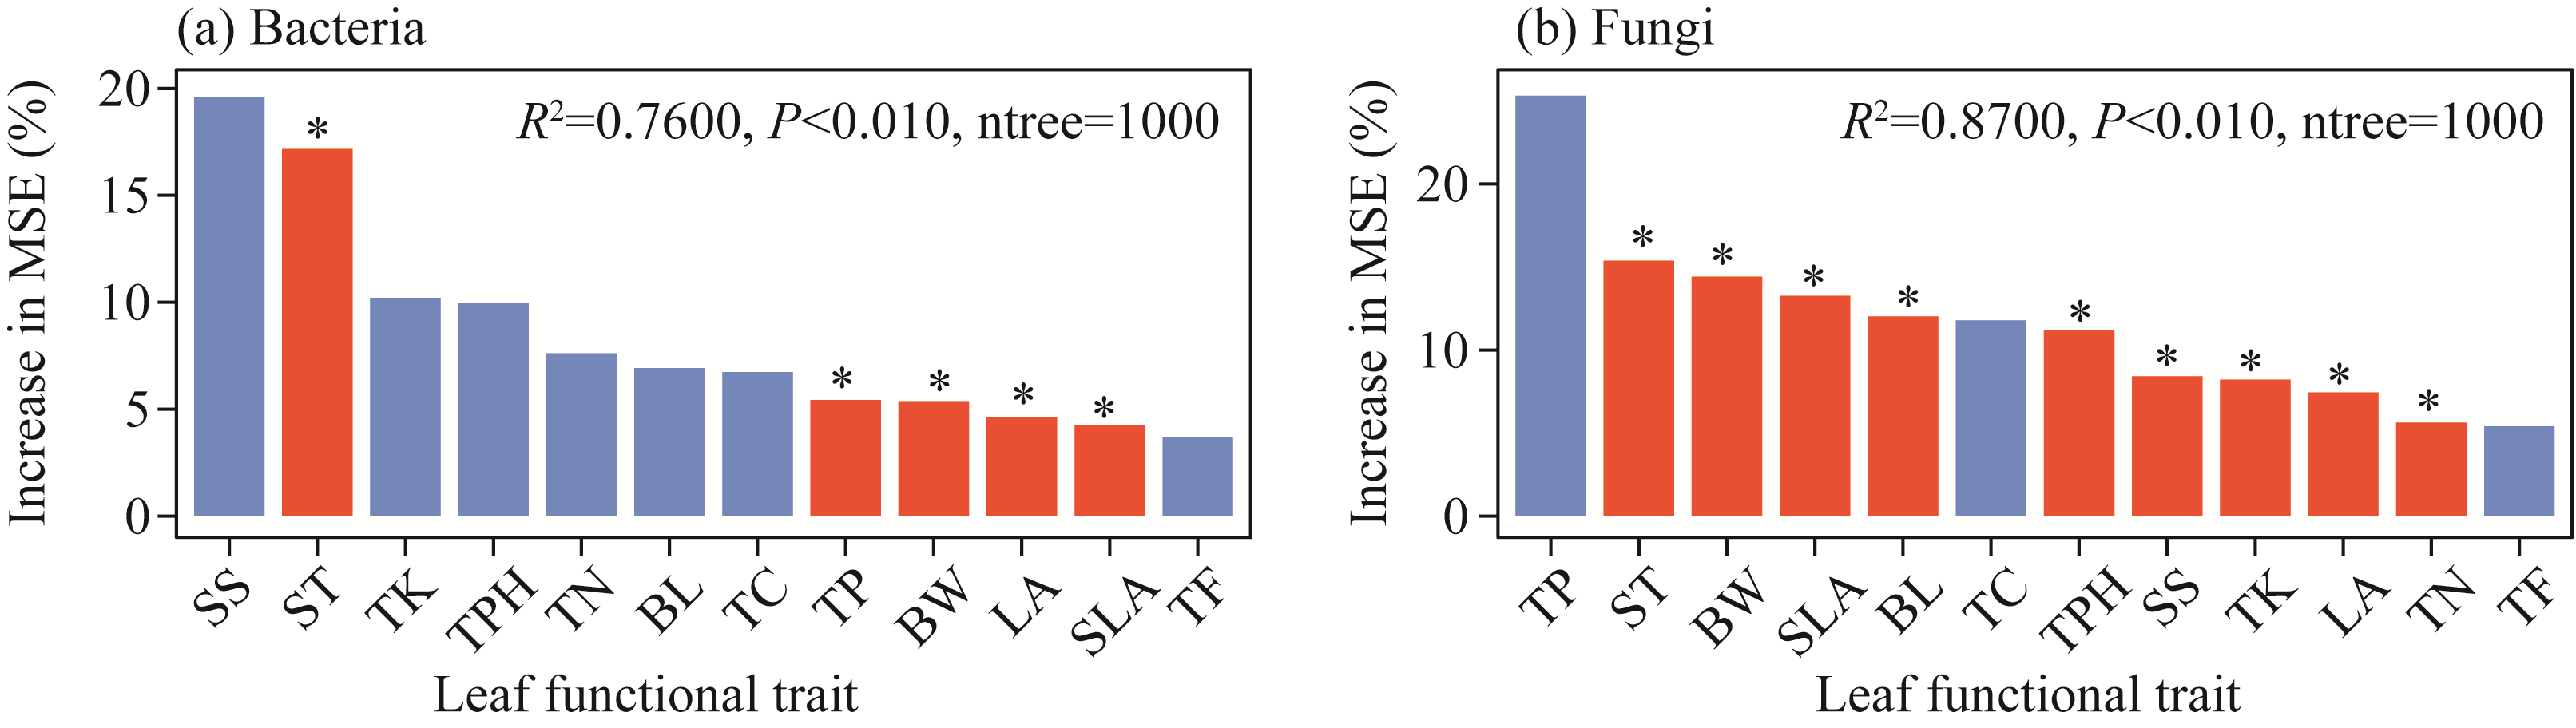
Abstract Phyllosphere microorganisms are a crucial component of environmental microorganisms, highly influenced by host characteristics, and play a significant role in plant health and productivity. Nonetheless, the impact of host characteristics on shaping phyllosphere microbial communities of plants with different life forms remains ambiguous. Utilizing high-throughput sequencing technology, this study analyzed the diversity and community composition of phyllosphere epiphytic microorganisms (e.g., bacteria and fungi) of various plant life forms in the hinterland of the Gurbantunggut Desert, Northwest China. Functional annotation of prokaryotic taxa (FAPROTAX) and fungi function guild (FUNGuild) were employed to assess the ecological functions of microorganisms and to investigate the role of stochastic and deterministic processes in shaping phyllosphere microbial communities. Result showed a diverse array of phyllosphere epiphytic microorganisms in the desert plants, with Proteobacteria, Cyanobacteria, and Actinobacteriota dominating bacterial community, while Ascomycota and Basidiomycota were prevalent in fungal community. Comparison across different plant life forms highlighted distinct microbial communities, indicating strong filtering effects by plant characteristics. FAPROTAX prediction identified intracellular parasites (accounting for 27.44% of bacterial community abundance), chemoheterotrophy (10.12%), and phototrophy (17.41%) as the main functions of epiphytic bacteria on leaves of different life form plants. FUNGuild prediction indicated that phyllosphere epiphytic fungi primarily served as Saprotrophs (81.77%), Pathotrophs (17.41%), and Symbiotrophs (0.82%). Co-occurrence network analysis demonstrated a predominance of positive correlations among different microbial taxa. Raup-Crick dissimilarity index analysis revealed that deterministic processes predominantly influenced phyllosphere bacterial and fungal community assembly. Variance partitioning analysis and random forest modeling suggested that plant leaf functional traits significantly impacted both bacterial and fungal community composition, with fungal community composition showing a closer association with leaf nutrients and physiology compared with bacterial community composition. The distinct responses of bacterial and fungal communities to plant traits were attributed to the differing properties of bacteria and fungi, such as bacteria having higher potential dispersal rates and broader ecological niches than fungi. Overall, the results indicate that phyllosphere bacterial and fungal communities undergo similar community assembly processes, with fungi being more influenced by plant characteristics than bacteria. These findings offer novel insights into the ecology of phyllosphere microbial communities of desert plants.
|
|
Received: 09 January 2024
Published: 31 May 2024
|
|
Corresponding Authors:
*ZHANG Yuanming (E-mail: zhangym@ms.xjb.ac.cn)
|
|
|
| [1] |
Agoussar A, Yergeau E. 2021. Engineering the plant microbiota in the context of the theory of ecological communities. Current Opinion in Biotechnology, 70: 220-225.
doi: 10.1016/j.copbio.2021.06.009
pmid: 34217124
|
|
|
| [2] |
Al Ashhab A, Meshner S, Alexander-Shani R, et al. 2021. Temporal and spatial changes in phyllosphere microbiome of acacia trees growing in super arid environments. Frontiers in Microbiology, 12: 656269, doi: 10.3389/fmicb.2021.656269.
|
|
|
| [3] |
Asis C A, Shimizu T, Khan M K, et al. 2003. Organic acid and sugar contents in sugarcane stem apoplast solution and their role as carbon source for endophytic diazotrophs. Journal of Soil Science and Plant Nutrition, 49(6): 915-920.
|
|
|
| [4] |
Barberán A, Bates S T, Casamayor E O, et al. 2012. Using network analysis to explore co-occurrence patterns in soil microbial communities. The ISME Journal, 6: 343-351.
|
|
|
| [5] |
Bechtold E K, Ryan S, Moughan S E, et al. 2021. Phyllosphere community assembly and response to drought stress on common tropical and temperate forage grasses. Applied and Environmental Microbiology, 87(17): e00895-21, doi:10.1128/AEM.00895-21.
|
|
|
| [6] |
Borruso L, Wellstein C, Bani A, et al. 2018. Temporal shifts in endophyte bacterial community composition of sessile oak (Quercus petraea) are linked to foliar nitrogen, stomatal length, and herbivory. Peer Journal, 6: e5769, doi: 10.7717/peerj.5769.
|
|
|
| [7] |
Bulgarelli D, Schlaeppi K, Spaepen S, et al. 2013. Structure and functions of the bacterial microbiota of plants. Annual Review of Plant Biology, 64: 807-838.
doi: 10.1146/annurev-arplant-050312-120106
pmid: 23373698
|
|
|
| [8] |
Coyte K Z, Schluter J, Foster K R. 2015. The ecology of the microbiome: Networks, competition, and stability. Science, 350(6261): 663-666.
doi: 10.1126/science.aad2602
pmid: 26542567
|
|
|
| [9] |
Faust K, Raes J. 2012. Microbial interactions: From networks to models. Nature Reviews Microbiology, 10(8): 538-550.
doi: 10.1038/nrmicro2832
pmid: 22796884
|
|
|
| [10] |
Finkel O M, Burch A Y, Lindow S E, et al. 2011. Geographical location determines the population structure in phyllosphere microbial communities of a salt-excreting desert tree. Applied and Environmental Microbiology, 77(21): 7647-7655.
doi: 10.1128/AEM.05565-11
pmid: 21926212
|
|
|
| [11] |
Fonseca-García C, Coleman-Derr D, Garrido E, et al. 2016. The cacti microbiome: Interplay between habitat-filtering and host-specificity. Frontiers in Microbiology, 7: 150, doi: 10.3389/fmicb.2016.00150.
pmid: 26904020
|
|
|
| [12] |
Gao J N, Uwiringiyimana E, Zhang D. 2023. Microbial composition and diversity of the tobacco leaf phyllosphere during plant development. Frontiers in Microbiology, 14: 1199241, doi: 10.3389/fmicb.2023.1199241.
|
|
|
| [13] |
Gong T Y, Xin X F. 2021. Phyllosphere microbiota: Community dynamics and its interaction with plant hosts. Journal of Integrative Plant Biology, 63(2): 297-304.
doi: 10.1111/jipb.13060
|
|
|
| [14] |
Gong W C, Zhuang L, Zhao W Q, et al. 2011. Ecological adaptation of morphological and anatomical structure of photosynthetic organs of Tarmarix ramosissima and Haloxylon ammodendron. Journal of Desert Research, 31(1): 129-136. (in Chinese)
|
|
|
| [15] |
Guo D L, Mitchell R J, Hendricks J J. 2004. Fine root branch orders respond differentially to carbon source-sink manipulations in a longleaf pine forest. Oecologia, 140(3): 450-457.
pmid: 15179577
|
|
|
| [16] |
Hakobyan A, Velte S, Sickel W, et al. 2023. Tillandsia landbeckii phyllosphere and laimosphere as refugia for bacterial life in a hyper-arid desert environment. Microbiome, 11: 246, doi: 10.1186/s40168-023-01684-x.
pmid: 37936139
|
|
|
| [17] |
He D, Shen W J, Eberwein J, et al. 2017. Diversity and co-occurrence network of soil fungi are more responsive than those of bacteria to shifts in precipitation seasonality in a subtropical forest. Soil Biology and Biochemistry, 115: 499-510.
|
|
|
| [18] |
HilleRisLambers J, Adler P B, Harpole W S, et al. 2012. Rethinking community assembly through the lens of coexistence theory. Annual Review of Ecology, Evolution and Systematics, 43: 227-248.
|
|
|
| [19] |
Huang G, Li Y. 2015. Phenological transition dictates the seasonal dynamics of ecosystem carbon exchange in a desert steppe. Journal of Vegetation Science, 26(2): 337-347.
|
|
|
| [20] |
Huang H, Nguyen T N Y, He X H, et al. 2017. Increase of fungal pathogenicity and role of plant glutamine in nitrogen-induced susceptibility (NIS) to rice blast. Frontiers in Plant Science, 8: 265, doi: 10.3389/fpls.2017.00265.
pmid: 28293247
|
|
|
| [21] |
Hunter P J, Hand P, Pink D, et al. 2010. Both leaf properties and microbe-microbe interactions influence within-species variation in bacterial population diversity and structure in the lettuce (Lactuca species) phyllosphere. Applied and Environmental Microbiology, 76(24): 8117-8125.
doi: 10.1128/AEM.01321-10
pmid: 20952648
|
|
|
| [22] |
Jose P A, Jebakumar S R D. 2013. Non-streptomycete actinomycetes nourish the current microbial antibiotic drug discovery. Frontiers in Microbiology, 4: 240, doi: 10.3389/fmicb.2013.00240.
pmid: 23970883
|
|
|
| [23] |
Kembel S W, O'Connor T K, Arnold H K, et al. 2014. Relationships between phyllosphere bacterial communities and plant functional traits in a neotropical forest. Proceedings of the National Academy of Sciences of the United States of America, 111(38): 13715-13720.
|
|
|
| [24] |
Kinkel L L, Andrews J H, Berbee F M, et al. 1987. Leaves as islands for microbes. Oecologia, 71(3): 405-408.
doi: 10.1007/BF00378714
pmid: 28312988
|
|
|
| [25] |
Korkina L G. 2007. Phenylpropanoids as naturally occurring antioxidants: From plant defense to human health. Cellular & Molecular Biology Letters, 53(1): 15-25.
|
|
|
| [26] |
Koskella B. 2020. The phyllosphere. Current Biology, 30(19): 1143-1146.
|
|
|
| [27] |
Reich P B. 2014. The world-wide 'fast-slow' plant economics spectrum: A traits manifesto. Journal of Ecology, 102: 275-301.
|
|
|
| [28] |
Laforest-Lapointe I, Messier C, Kembel S W. 2016. Host species identity, site and time drive temperate tree phyllosphere bacterial community structure. Microbiome, 4(1): 27, doi: 10.1186/s40168-016-0174-1.
pmid: 27316353
|
|
|
| [29] |
Laforest-Lapointe I, Whitaker B K. 2019. Decrypting the phyllosphere microbiota: Progress and challenges. American Journal of Botany, 106(2): 171-173.
doi: 10.1002/ajb2.1229
pmid: 30726571
|
|
|
| [30] |
Lajoie G, Kembel S W. 2021. Plant-bacteria associations are phylogenetically structured in the phyllosphere. Molecular Ecology, 30(21): 5572-5587.
doi: 10.1111/mec.16131
pmid: 34411359
|
|
|
| [31] |
Li M J, Hong L, Ye W H, et al. 2022. Phyllosphere bacterial and fungal communities vary with host species identity, plant traits and seasonality in a subtropical forest. Environmental Microbiome, 17(1): 29, doi: 10.1186/s40793-022-00423-3.
pmid: 35681245
|
|
|
| [32] |
Li S J, Wang H, Gou W, et al. 2021. Leaf functional traits of dominant desert plants in the Hexi Corridor, northwestern China: Trade-off relationships and adversity strategies. Global Ecology and Conservation, 28: e01666, doi: 10.1016/j.gecco.2021.e01666.
|
|
|
| [33] |
Lindow S E, Leveau J H J. 2002. Phlyllosphere microbiology. Current Opinion in Biotechnology, 13(3): 238-243.
|
|
|
| [34] |
Lindow S E, Brandl M T. 2003. Microbiology of the phyllosphere. Applied and Environmental Microbiology, 69(4): 1875-1883.
doi: 10.1128/AEM.69.4.1875-1883.2003
pmid: 12676659
|
|
|
| [35] |
Liu J Q, Sun X, Zuo Y L, et al. 2023. Plant species shape the bacterial communities on the phyllosphere in a hyper-arid desert. Microbiological Research, 269: 127314, doi: 10.1016/j.micres.2023.127314.
|
|
|
| [36] |
Lyshede O B. 1979. Xeromorphic features of three stem assimilants in relation to their ecology. Botanical Journal of the Linnean Society, 78(2): 85-98.
|
|
|
| [37] |
Mandakovic D, Rojas C, Maldonado J, et al. 2018. Structure and co-occurrence patterns in microbial communities under acute environmental stress reveal ecological factors fostering resilience. Scientific Reports, 8(1): 5875, doi: 10.1038/s41598-018-23931-0.
pmid: 29651160
|
|
|
| [38] |
Muller D B, Vogel C, Bai Y, et al. 2016. The plant microbiota: Systems-level insights and perspectives. The Annual Review Genetics, 50: 211-234.
|
|
|
| [39] |
Neinhuis C, Barthlot W. 1997. Characterization and distribution of water repellent, self-cleaning plant surfaces. Annals of Botany, 79(6): 667-677.
|
|
|
| [40] |
Ottesen A R, Gorham S, Reed E, et al. 2016. Using a control to better understand phyllosphere microbiota. PloS ONE, 11(9): e0163482, doi: 10.1371/journal.pone.0163482.
|
|
|
| [41] |
Proulx S R, Promislow D E, Phillips P C. 2005. Network thinking in ecology and evolution. Trends in Ecology & Evolution, 20: 345-353.
|
|
|
| [42] |
Qian Y B, Wu Z N, Li C S, et al. 2010. Environments of Gurbantunggut Desert. Beijing: Science Press. (in Chinese)
|
|
|
| [43] |
Reich P B. 2014. The world-wide 'fast-slow' plant economics spectrum: A traits manifesto. Journal of Ecology, 102(2): 275-301.
|
|
|
| [44] |
Reisberg E E, Hildebrandt U, Riederer M, et al. 2012. Phyllosphere bacterial communities of trichome-bearing and trichomeless Arabidopsis thaliana leaves. Antonie Van Leeuwenhock, 101(3): 551-560.
|
|
|
| [45] |
Rico L, Ogaya R, Terradas J, et al. 2014. Community structures of N2-fixing bacteria associated with the phyllosphere of a Holm oak forest and their response to drought. Plant Biology, 16(3): 586-593.
doi: 10.1111/plb.12082
pmid: 23952768
|
|
|
| [46] |
Rosado B H P, Almeida L C, Alves L F, et al. 2018. The importance of phyllosphere on plant functional ecology: A phyllo trait manifesto. New Phytologist, 219(4): 1145-1149.
doi: 10.1111/nph.15235
pmid: 29806957
|
|
|
| [47] |
Rottjers L, Faust K. 2018. From hairballs to hypotheses-biological insights from microbial networks. FEMS Microbiology Reviews, 42(6): 761-780.
doi: 10.1093/femsre/fuy030
pmid: 30085090
|
|
|
| [48] |
Schreiber L. 2010. Transport barriers made of cutin, suberin and associated waxes. Trends in Plant Science, 15(10): 546-553.
doi: 10.1016/j.tplants.2010.06.004
pmid: 20655799
|
|
|
| [49] |
Silhavy T J, Kahne D, Walker S. 2010. The bacterial cell envelope. Cold Spring Harbor Perspectives in Biology, 2(5): a000414, doi: 10.1101/cshperspect.a000414.
|
|
|
| [50] |
Sorber K, Chiu C, Webster D, et al. 2008. The long march: a sample preparation technique that enhances contig length and coverage by high-throughput short-read sequencing. PloS ONE, 3(10): e3495, doi: 10.1371/journal.pone.0003495.
|
|
|
| [51] |
Steele J A, Countway P D, Xia L, et al. 2011. Marine bacterial, archaeal and protistan association networks reveal ecological linkages. The ISME Journal, 5(9): 1414-1425.
|
|
|
| [52] |
Stouffer D B, Bascompte J. 2011. Compartmentalization increases food-web persistence. Proceedings of the National Academy Sciences of the United States of America, 108(9): 3648-3652.
|
|
|
| [53] |
Thapa S, Ranjan K, Ramakrishnan B, et al. 2018. Influence of fertilizers and rice cultivation methods on the abundance and diversity of phyllosphere microbiome. Journal of Basic Microbiology, 58(2): 172-186.
doi: 10.1002/jobm.201700402
pmid: 29193162
|
|
|
| [54] |
Thukral A K. 2017. A review on measurement of Alpha diversity in biology. Agricultural Research Journal, 54(1): 1-10, doi: 10.5958/2395-146X.2017.00001.1.
|
|
|
| [55] |
Toju H, Kurokawa H, Kenta T. 2019. Factors influencing leaf- and root-associated communities of bacteria and fungi across 33 plant orders in a grassland. Frontiers in Microbiology, 10: 241, doi: 10.3389/fmicb.2019.00241.
|
|
|
| [56] |
Treutter D. 2006. Significance of flavonoids in plant resistance: A review. Environmental Chemistry Letters, 4: 147-157.
|
|
|
| [57] |
Vacher C, Hampe A, Porte A J, et al. 2016. The phyllosphere: Microbial jungle at the plant-climate interface. Annual Review of Ecology, Evolution, and Systematics, 47: 1-24.
|
|
|
| [58] |
Vidhyasekaran P, Borromeo ES, Mew TW. 1992. Helminthosporium oryzae toxin suppresses phenol metabolism in rice plants and aids pathogen colonization. Physiological and Molecular Plant Pathology, 41(5): 307-315.
|
|
|
| [59] |
Vorholt J A. 2012. Microbial life in the phyllosphere. Nature Reviews Microbiology, 10(12): 828-840.
doi: 10.1038/nrmicro2910
pmid: 23154261
|
|
|
| [60] |
Wagner M R, Lundberg D S, Del Rio T G, et al. 2016. Host genotype and age shape the leaf and root microbiomes of a wild perennial plant. Nature Communications, 7: 12151, doi: 10.1038/ncomms12151.
pmid: 27402057
|
|
|
| [61] |
Walters W, Hyde E R, Berg-Lyons D, et al. 2016. Improved bacterial 16S rRNA gene (V4 and V4-5) and fungal internal transcribed spacer marker gene primers for microbial community surveys. mSystems, 1(1): e00009-15, doi: 10.1128/mSystems.00009-15.
|
|
|
| [62] |
Wei Y Q, Lan G Y, Wu Z X, et al. 2022. Phyllosphere fungal communities of rubber trees exhibited biogeographical patterns, but not bacteria. Environmental Microbiology, 24(8): 3769-3782.
|
|
|
| [63] |
Williams R J, Howe A, Hofmockel K S. 2014. Demonstrating microbial co-occurrence pattern analyses within between ecosystems. Frontiers in Microbiology, 5: 358, doi: 10.3389/fmicb.2014.00358.
pmid: 25101065
|
|
|
| [64] |
Willis A D. 2019. Rarefaction, alpha diversity, and statistics. Frontiers in Microbiology, 10: 2407, doi: 10.3389/fmicb.2019.02407.
pmid: 31708888
|
|
|
| [65] |
Wilson Z E, Brimble M A. 2021. Molecules derived from the extremes of life: A decade later. Natural Product Reports Journal, 38(1): 24-82.
|
|
|
| [66] |
Woyke T, Teeling H, Ivanova N N, et al. 2006. Symbiosis insights through metagenomic analysis of a microbial consortium. Nature, 443(7114): 950-955.
|
|
|
| [67] |
Wu T G, Wang G G, Wu Q T, et al. 2014. Patterns of leaf nitrogen and phosphorus stoichiometry among Quercus acutissima provenances across China. Ecological Complexity, 17: 32-39.
|
|
|
| [68] |
Xiong C, Zhu Y G, Wang J T, et al. 2021. Host selection shapes crop microbiome assembly and network complexity. New Phytologist, 229(2): 1091-1104.
|
|
|
| [69] |
Xu N H, Zhao Q Q, Zhang Z Y, et al. 2022. Phyllosphere microorganisms: sources, drivers, and their interactions with plant hosts. Journal of Agriculture and Food Chemistry, 70(16): 4860-4870.
|
|
|
| [70] |
Xue L, Ren H D, Brodribb T J, et al. 2020. Long term effects of management practice intensification on soil microbial community structure and co-occurrence network in a non-timber plantation. Forest Ecology and Management, 459: 117805, doi: 10.1016/j.foreco.2019.117805.
|
|
|
| [71] |
Yan K, Han W, Zhu Q L, et al. 2022. Leaf surface microtopography shaping the bacterial community in the phyllosphere: Evidence from 11 tree species. Microbiological Research, 254: 126897, doi: 10.1016/j.micres.2021.126897.
|
|
|
| [72] |
Yadav R K P, Karamanoli K, Vokou D. 2005. Bacterial colonization of the phyllosphere of Mediterranean perennial species as influenced by leaf structural and chemical features. Microbial Ecology, 50: 185-196.
pmid: 16215646
|
|
|
| [73] |
Yin Y, Zhu D, Yang G, et al. 2022. Diverse antibiotic resistance genes and potential pathogens inhabit in the phyllosphere of fresh vegetables. Science of the Total Environment, 815: 152851, doi: 10.1016/j.scitotenv.2021.152851.
|
|
|
| [74] |
Yuan M M, Guo X, Wu L W, et al. 2021. Climate warming enhances microbial network complexity and stability. Nature Climate Change, 11: 343-348.
|
|
|
| [75] |
Yue K, Fornara D A, Yang W, et al. 2017. Effects of three global change drivers on terrestrial C:N:P stoichiometry: A global synthesis. Global Change Biology, 23(6): 2450-2463.
doi: 10.1111/gcb.13569
pmid: 27859966
|
|
|
| [76] |
Zhang L Y, Chen C D. 2002. On the general characteristics of plant diversity of Gurbantunggut Desert. Acta Ecological Sinica, 11: 1923-1932. (in Chinese)
|
|
|
| [77] |
Zhao P Y, Liu J X, Jia T, et al. 2019. Environmental filtering drives bacterial community structure and function in a subalpine area of northern China. Journal of Basic Microbiology, 59(3): 337-347.
doi: 10.1002/jobm.201800314
pmid: 30561145
|
|
|
|
Viewed |
|
|
|
Full text
|
|
|
|
|
Abstract
|
|
|
|
|
Cited |
|
|
|
|
| |
Shared |
|
|
|
|
| |
Discussed |
|
|
|
|