| Research article |
|


|
|
|
| Soil bacterial characteristics between surface and subsurface soils along a precipitation gradient in the Alxa Desert, China |
TENG Zeyu1,2,*( ), XIAO Shengchun1, CHEN Xiaohong3, HAN Chao1,2 ), XIAO Shengchun1, CHEN Xiaohong3, HAN Chao1,2 |
1Key Laboratory of Ecohydrology of Inland River Basin, Northwest Institute of Eco-Environmental Resources, Chinese Academy of Sciences, Lanzhou 730000, China
2University of Chinese Academy of Sciences, Beijing 100049, China
3Key Laboratory of Desert and Desertification, Northwest Institute of Eco-Environment and Resources, Chinese Academy of Sciences, Lanzhou 730000, China |
|
|
|
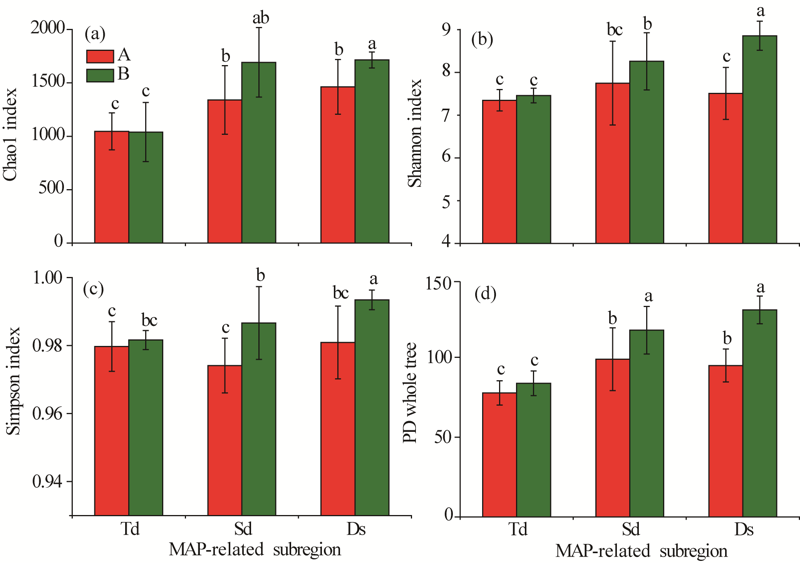
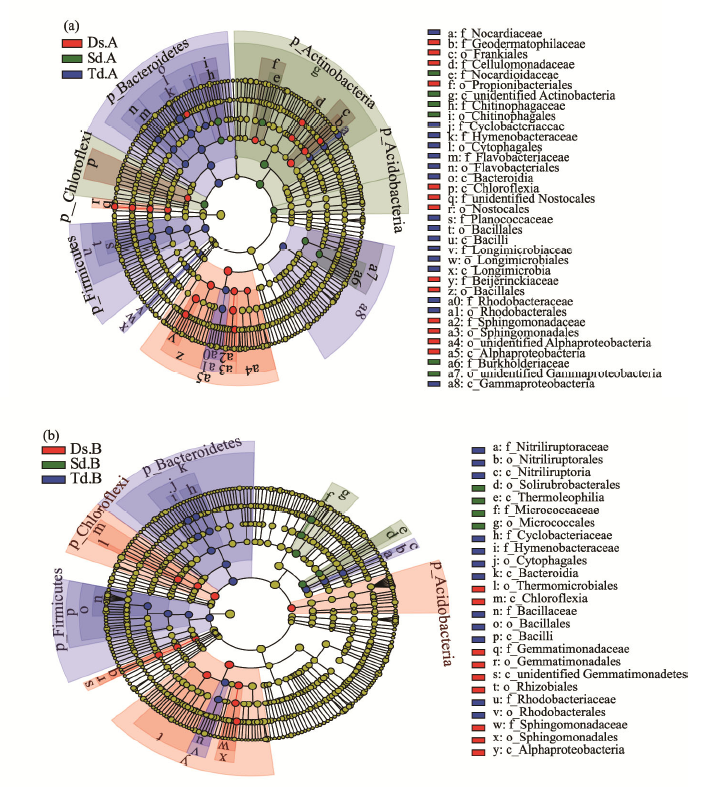
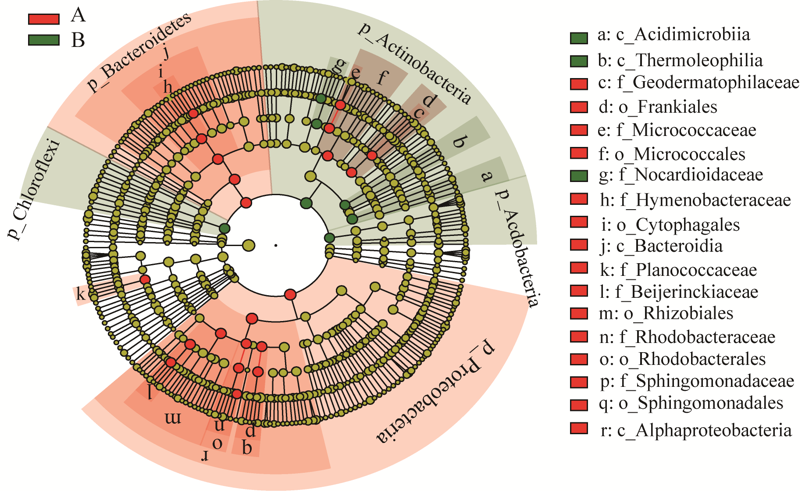
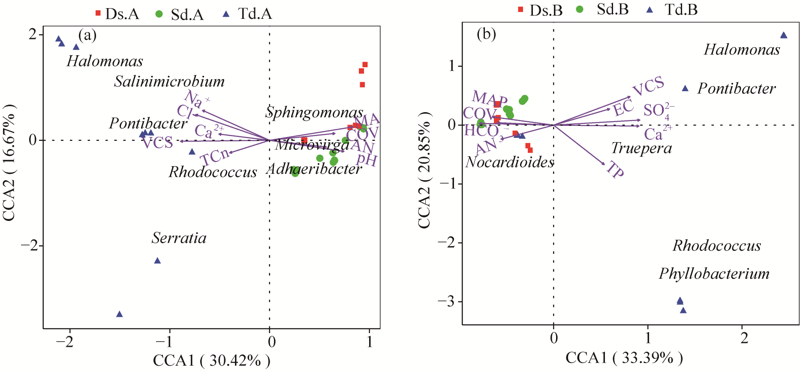
Abstract Bacteria in desert soil have unique phylogeny and important ecological functions, and their responses to changes in precipitation need further attention. However, relevant studies have mainly focused on the surface soil, and studies on the responses of bacteria at different soil depths to variations in precipitation are rare. Thus, we used 16S rDNA high-throughput sequencing to investigate the changes in soil bacterial distribution along a mean annual precipitation gradient (50-150 mm) in the Alxa Desert, China, and compared the variation characteristics in the surface soil layer (0-10 cm) and subsurface soil layer (10-20 cm). Results showed that soil bacterial communities significantly changed along the precipitation gradient in both soil layers. However, the subsurface soil layer could support bacterial communities with higher diversity and closer internal relationships but more internal competition than the surface soil layer. Additionally, compared with the surface soil layer, variations in diversity and co-occurrence patterns in the subsurface soil layer were more in line with the changes in the mean annual precipitation, while bacterial community structure was less variable in the subsurface soil layer. Compared with the mean annual precipitation, soil moisture had little influence on the structure and diversity of soil bacterial community but had a high correlation with intercommunity connectivity. Therefore, soil moisture might play a complex role in mediating environmental conditions and soil bacterial community characteristics. Due to the different responses of surface and subsurface soil bacteria to the changes in precipitation, it is necessary to distinguish different soil layers when predicting the trends in desert soil bacterial conditions associated with precipitation, and prediction of subsurface soil bacteria may be more accurate.
|
|
Received: 22 September 2020
Published: 10 March 2021
|
|
Corresponding Authors:
|
About author: * TENG Zeyu (E-mail: Tengzeyu1990@sina.com)
|
|
|
| [1] |
Angel R, Soares M I M, Ungar E D, et al. 2010. Biogeography of soil archaea and bacteria along a steep precipitation gradient. The International Society for Microbial Ecology Journal, 4(4):553-563.
|
|
|
| [2] |
Azua-Bustos A, Urrejola C, Vicuña R. 2012. Life at the dry edge: Microorganisms of the Atacama Desert. FEBS Letters, 586(18):2939-2945.
doi: 10.1016/j.febslet.2012.07.025
pmid: 22819826
|
|
|
| [3] |
Bachar A, Al-Ashhab A, Soares M I M, et al. 2010. Soil microbial abundance and diversity along a low precipitation gradient. Microbial Ecology, 60:453-461.
doi: 10.1007/s00248-010-9727-1
pmid: 20683588
|
|
|
| [4] |
Bachar A, Soares M I M, Gillor O. 2012. The effect of resource islands on abundance and diversity of bacteria in arid soils. Microbial Ecology, 63(3):694-700.
doi: 10.1007/s00248-011-9957-x
pmid: 22038034
|
|
|
| [5] |
Banerjee S, Helgason B, Wang L, et al. 2016. Legacy effects of soil moisture on microbial community structure and N2O emissions. Soil Biology and Biochemistry, 95:40-50.
|
|
|
| [6] |
Barnard R L, Osborne C A, Firestone M K. 2013. Responses of soil bacterial and fungal communities to extreme desiccation and rewetting. The International Society for Microbial Ecology Journal, 7(11):2229-2241.
|
|
|
| [7] |
Brockett B F T, Prescott C E, Grayston S J. 2012. Soil moisture is the major factor influencing microbial community structure and enzyme activities across seven biogeoclimatic zones in western Canada. Soil Biology and Biochemistry, 44(1):9-20.
|
|
|
| [8] |
Clark J S, Campbell J H, Grizzle H, et al. 2009. Soil microbial community response to drought and precipitation variability in the Chihuahuan Desert. Microbial Ecology, 57(2):248-260.
doi: 10.1007/s00248-008-9475-7
pmid: 19067031
|
|
|
| [9] |
Cregger M A, McDowell N G, Pangle R E, et al. 2014. The impact of precipitation changes on nitrogen cycling in a semi-arid ecosystem. Functional Ecology, 28(5):1534-1544.
|
|
|
| [10] |
Cruz-Martínez K, Suttle K B, Brodie E L, et al. 2009. Despite strong seasonal responses, soil microbial consortia are more resilient to long-term changes in rainfall than overlying grassland. The International Society for Microbial Ecology Journal, 3(6):738-744.
|
|
|
| [11] |
Cui Y X, Fang L C, Guo X B, et al. 2018. Responses of soil microbial communities to nutrient limitation in the desert-grassland ecological transition zone. Science of the Total Environment, 642:45-55.
|
|
|
| [12] |
Dijkstra F A, He M Z, Johansen M P, et al. 2015. Plant and microbial uptake of nitrogen and phosphorus affected by drought using 15N and 32P tracers. Soil Biology and Biochemistry, 82:135-142.
|
|
|
| [13] |
D'Odorico P, Caylor K, Okin G S, et al. 2007. On soil moisture-vegetation feedbacks and their possible effects on the dynamics of dryland ecosystems. Journal of Geophysical Research Atmospheres, 112:G04010.
|
|
|
| [14] |
Easterling D R, Events J L, Groismman P Y, et al. 2000. Observed variability and trends in extreme climate events: A brief review. Bulletin of the American Meteorological Society, 81(3):417-425.
|
|
|
| [15] |
Edgar R C. 2004. MUSCLE: multiple sequence alignment with high accuracy and high throughput. Nucleic Acids Research, 32(5):1792-1797.
pmid: 15034147
|
|
|
| [16] |
Edgar R C, Haas B J, Clemente J C, et al. 2011. UCHIME improves sensitivity and speed of chimera detection. Bioinformatics, 27(16):2194-2200.
doi: 10.1093/bioinformatics/btr381
pmid: 21700674
|
|
|
| [17] |
Epstein H E, Lauenroth W K, Burke I C. 1997. Effects of temperature and soil texture on ANPP in the US Great Plains. Ecology, 78(8):2628-2631.
|
|
|
| [18] |
Excoffier L, Smouse P, Quattro J. 1992. Analysis of molecular variance inferred from metric distances among DNA haplotypes: application to human mitochondrial DNA restriction data. Genetics, 131(2):479– 491.
pmid: 1644282
|
|
|
| [19] |
Fang F, Hu Y K, Gong Y M, et al. 2013. Desert soil organic carbon characterized by the vertical distribution of soil microbial carbon. Journal of Desert Research, 33(3):777-781. (in Chinese)
|
|
|
| [20] |
Fierer N, Leff J W, Adams B J, et al. 2012. Cross-biome metagenomic analyses of soil microbial communities and their functional attributes. Proceedings of the National Academy of Sciences of the United States of America, 109(52):21390-21395.
|
|
|
| [21] |
Haas B J, Gevers D, Earl A M, et al. 2011. Chimeric 16s rRNA sequence formation and detection in Sanger and 454-pyrosequenced PCR amplicons. Genome Research, 21:494-504.
pmid: 21212162
|
|
|
| [22] |
Huang G, Li Y, Su Y G. 2015. Effects of increasing precipitation on soil microbial community composition and soil respiration in a temperate desert, northwestern China. Soil Biology and Biochemistry, 83:52-56.
|
|
|
| [23] |
Johnson R M, Ramond J B, Gunnigle E, et al. 2017. Namib Desert edaphic bacterial, fungal and archaeal communities assemble through deterministic processes but are influenced by different abiotic parameters. Extremophiles, 21(2):381-392.
pmid: 28058513
|
|
|
| [24] |
Jones D L, Olivera-Ardid S, Klumpp E, et al. 2017. Moisture activation and carbon use efficiency of soil microbial communities along an aridity gradient in the Atacama Desert. Soil Biology and Biochemistry, 117:68-71.
|
|
|
| [25] |
Kuzyakov Y, Blagodatskaya E. 2015. Microbial hotspots and hot moments in soil: concept & review. Soil Biology and Biochemistry, 83:184-199.
|
|
|
| [26] |
Li X R, Tan H J, He M Z, et al. 2009. Patterns of shrub species richness and abundance in relation to environmental factors on the Alxa Plateau: Prerequisites for conserving shrub diversity in extreme arid desert regions. Science in China, 52:669-680. (in Chinese)
|
|
|
| [27] |
Loarie S R, Duffy P B, Hamilton H, et al. 2010. The velocity of climate change. Nature, 462:1052-1055.
doi: 10.1038/nature08649
pmid: 20033047
|
|
|
| [28] |
Lozupone C, Lladser M E, Knights D, et al. 2011. UniFrac: an effective distance metric for microbial community comparison. The International Society for Microbial Ecology Journal, 5(2):169-172.
|
|
|
| [29] |
Maestre F T, Delgado-Baquerizo M, Jeffries T C, et al. 2015. Increasing aridity reduces soil microbial diversity and abundance in global drylands. Proceedings of the National Academy of Sciences of the United States of America, 112(51):15684-15689.
|
|
|
| [30] |
Manzoni S, Schimel J P, Porporato A. 2012. Responses of soil microbial communities to water stress: Results from a meta-analysis. Ecology, 93(4):930-938.
doi: 10.1890/11-0026.1
pmid: 22690643
|
|
|
| [31] |
Martin M. 2011. Cutadapt removes adapter sequences from high-throughput sequencing reads. EMBnet Journal, 17(1):10-12.
|
|
|
| [32] |
Michelsen C F, Pedas P, Glaring M A, et al. 2014. Bacterial diversity in Greenlandic soils as affected by potato cropping and inorganic versus organic fertilization. Polar Biology, 37:61-71.
|
|
|
| [33] |
Neilson J W, Califf K, Cardona C, et al. 2017. Significant impacts of increasing aridity on the arid soil microbiome. mSystems, 2(3):224-231.
|
|
|
| [34] |
Noy-Meir I. 1973. Desert ecosystems: Environment and producers. Annual Review of Ecology and Systematics, 4:25-51.
|
|
|
| [35] |
Orlando J, Alfaro M, Bravo L, et al. 2010. Bacterial diversity and occurrence of ammonia-oxidizing bacteria in the Atacama Desert soil during a "desert bloom" event. Soil Biology and Biochemistry, 42(7):1183-1188.
|
|
|
| [36] |
Pei H, Zhu Z Y, Liang C Z. 2011. Ecological Environment Characteristics and Ecological Protection in Alxa Desert Area. Beijing: China Meteorological Press, 12-13. (in Chinese)
|
|
|
| [37] |
Pointing S B, Belnap J. 2012. Microbial colonization and controls in dryland systems. Nature Reviews Microbiology, 10(8):551-562.
doi: 10.1038/nrmicro2831
pmid: 22772903
|
|
|
| [38] |
Quast C, Pruesse E, Yilmaz P, et al. 2013 The Silva ribosomal RNA gene database project: improved data processing and web-based tools. Nucleic Acids Research, 41:590-596.
|
|
|
| [39] |
Rath K M, Maheshwari A, Rousk J. 2017. The impact of salinity on the microbial response to drying and rewetting in soil. Soil Biology and Biochemistry, 108:17-26.
|
|
|
| [40] |
Rivas M N, Burton O T, Wise P, et al. 2013. A microbiota signature associated with experimental food allergy promotes allergic sensitization and anaphylaxis. Journal of Allergy and Clinical, 131(1):201-212.
|
|
|
| [41] |
Rodriguez-Zaragoza S, Mayzlish E, Steinberger Y. 2005. Vertical distribution of the free-living amoeba population in soil under desert shrubs in the Negev Desert, Israel. Applied and Environmental Microbiology, 71(4):2053-2060.
doi: 10.1128/AEM.71.4.2053-2060.2005
pmid: 15812038
|
|
|
| [42] |
Schimmel J P. 2018. Life in dry soils: effects of drought on soil microbial communities and processes. Annual Review of Ecology Evolution and Systematics, 49:409-432.
|
|
|
| [43] |
Scholes R J, Archer S R. 1997. Tree-grass interactions in Savannas. Annual Review of Ecology and Systematics, 28:517-544.
doi: 10.1146/annurev.ecolsys.28.1.517
|
|
|
| [44] |
Segata N, Lzard J, Waldron L, et al. 2011. Metagenomic biomarker discovery and explanation. Genome Biology, 12(6):R60.
doi: 10.1186/gb-2011-12-6-r60
pmid: 21702898
|
|
|
| [45] |
Shamir I, Steinberger Y. 2007. Vertical distribution and activity of soil microbial population in a sandy desert ecosystem. Microbial Ecology, 53:340-347.
doi: 10.1007/s00248-006-9137-6
pmid: 17265001
|
|
|
| [46] |
Šťovíček A, Kim M, Or D, et al. 2017. Microbial community response to hydration-desiccation cycles in desert soil. Scientific Reports, 7:45735.
pmid: 28383531
|
|
|
| [47] |
Tomiolo S, van der Putten W H, Tielbörger K. 2015. Separating the role of biotic interactions and climate in determining adaptive response of plants to climate change. Ecology, 96(5):1298-1308.
doi: 10.1890/14-1445.1
pmid: 26236843
|
|
|
| [48] |
Tripathi B M, Moroenyane I, Chen S, et al. 2017. Trends in taxonomic and functional composition of soil microbiome along a precipitation gradient in Israel. Microbial Ecology, 74:168-176.
pmid: 28074247
|
|
|
| [49] |
Xiao S C, Chen X H, Ding A J. 2017. Study process of climate changes, environment evolution and its driving mechanism in the last two centuries in the Alxa Desert. Journal of Desert Research, 37:1102-1110. (in Chinese)
|
|
|
| [50] |
Yao Z Y, Xiao J H, Li C X, et al. 2011. Regional characteristics of dust storms observed in the Alxa Plateau of China from 1961 to 2005. Environmental Earth Sciences, 64:255-267.
|
|
|
| [51] |
Yi C X, Wei S H, Hendrey G. 2014. Warming climate extends dryness-controlled areas of terrestrial carbon sequestration. Scientific Reports, 4:5472-5477.
pmid: 24980649
|
|
|
| [52] |
Zahran H H. 1997. Diversity, adaptation and activity of the bacterial flora in saline environments. Biology and Fertility of Soils, 25:211-223.
|
|
|
| [53] |
Zhang L H, Xie Z K, Zhao R F, et al. 2018. Plant, microbial community and soil property responses to an experimental precipitation gradient in a desert grassland. Applied Soil Ecology, 127:87-95.
|
|
|
| [54] |
Zhou J Z, Xia B C, Huang H S, et al. 2004. Microbial diversity and heterogeneity in sandy subsurface soils. Applied and Environmental Microbiology, 70:1723-1734.
doi: 10.1128/aem.70.3.1723-1734.2004
pmid: 15006798
|
|
|
| [55] |
Zvyagintsev D G, Ritz K, Dighton J, et al. 1994. Vertical Distribution of Microbial Communities in Soils. Hoboken, New Jersey: John Wiley & Sons Ltd., 29-37.
|
|
|
|
Viewed |
|
|
|
Full text
|
|
|
|
|
Abstract
|
|
|
|
|
Cited |
|
|
|
|
| |
Shared |
|
|
|
|
| |
Discussed |
|
|
|
|