|
|
|
| Long-term light grazing does not change soil organic carbon stability and stock in biocrust layer in the hilly regions of drylands |
MA Xinxin1,2,3, ZHAO Yunge1,2, YANG Kai4, MING Jiao1,2,3, QIAO Yu4, XU Mingxiang1,2,3,*( ), PAN Xinghui5 ), PAN Xinghui5 |
1Research Center of Soil and Water Conservation and Ecological Environment, Chinese Academy of Sciences and Ministry of Education, Yangling 712100, China
2Institute of Soil and Water Conservation, Chinese Academy of Sciences and Ministry of Water Resources, Yangling 712100, China
3University of Chinese Academy of Sciences, Beijing 100049, China
4College of Natural Resources and Environment, Northwest A&F University, Yangling 712100, China
5College of Life Sciences, Northwest A&F University, Yangling 712100, China |
|
|
|
Abstract
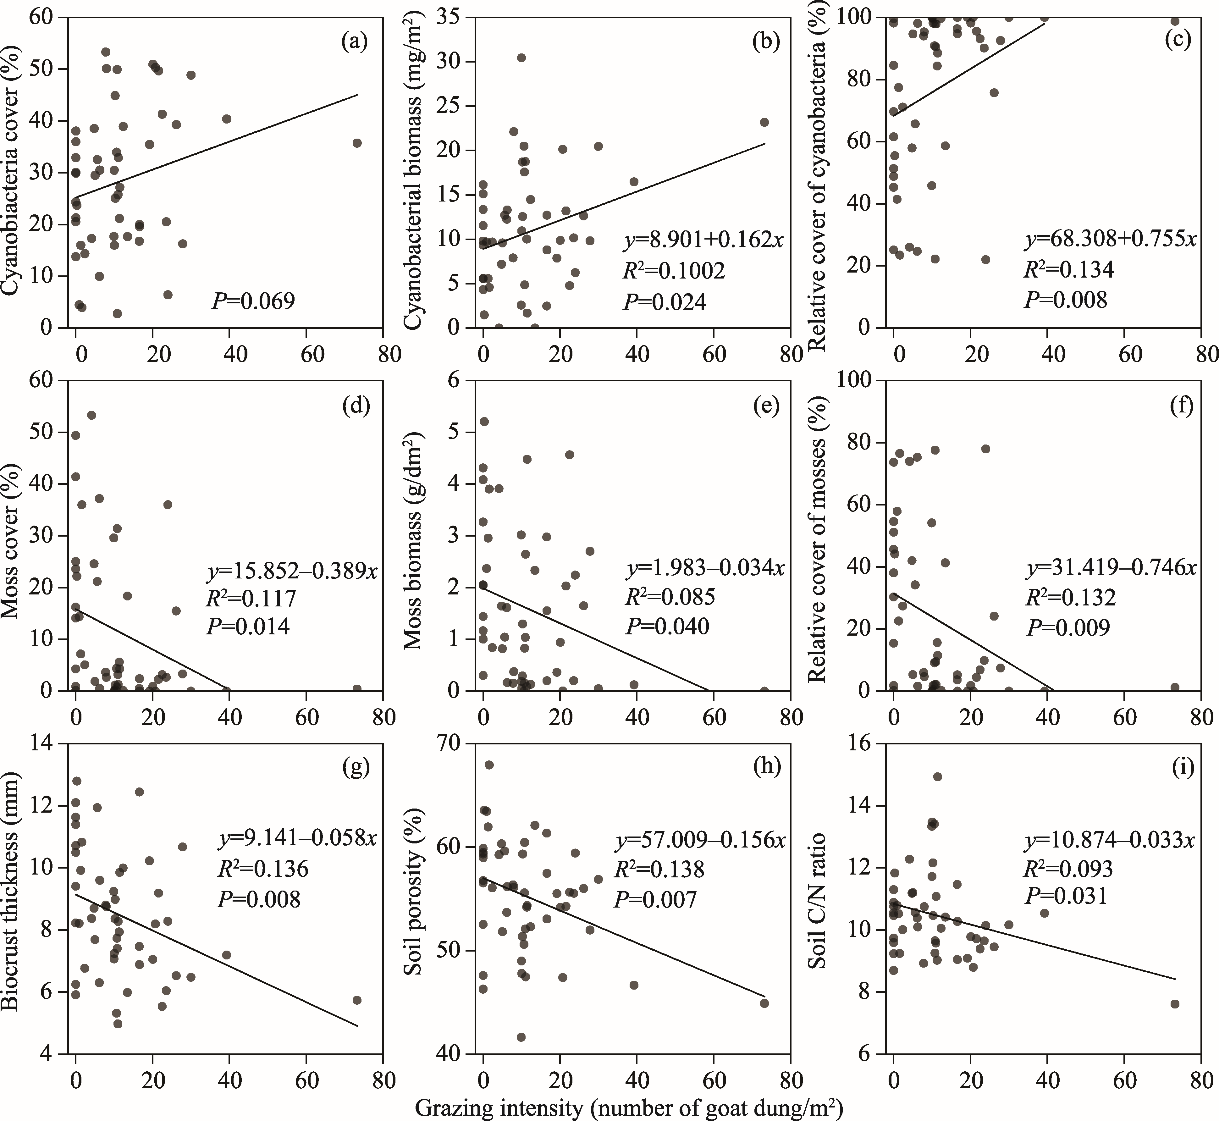
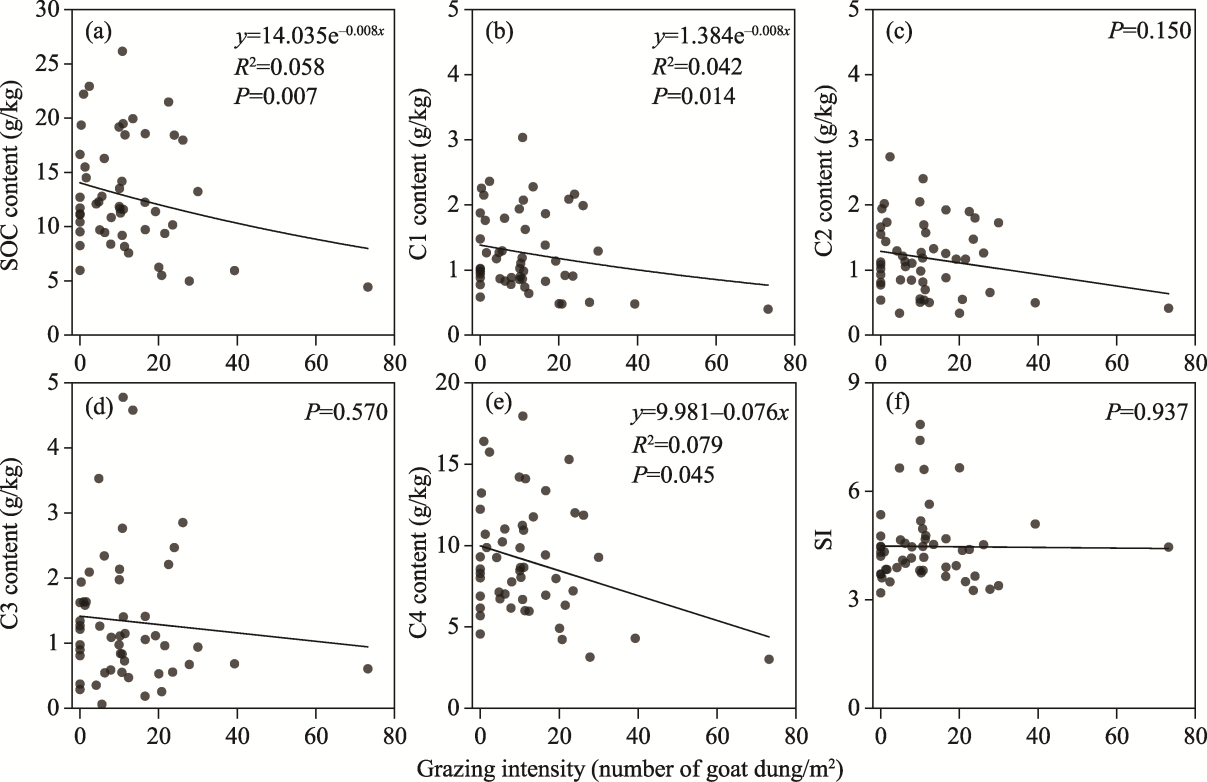
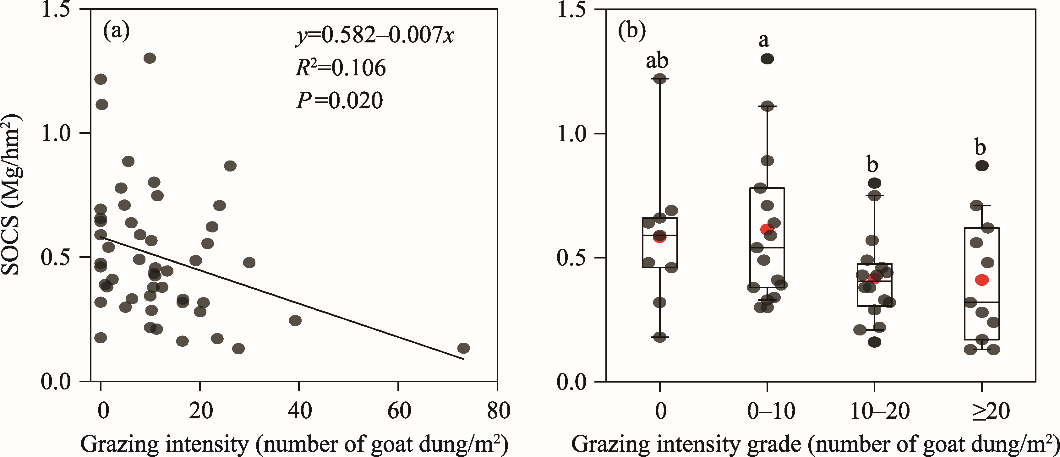
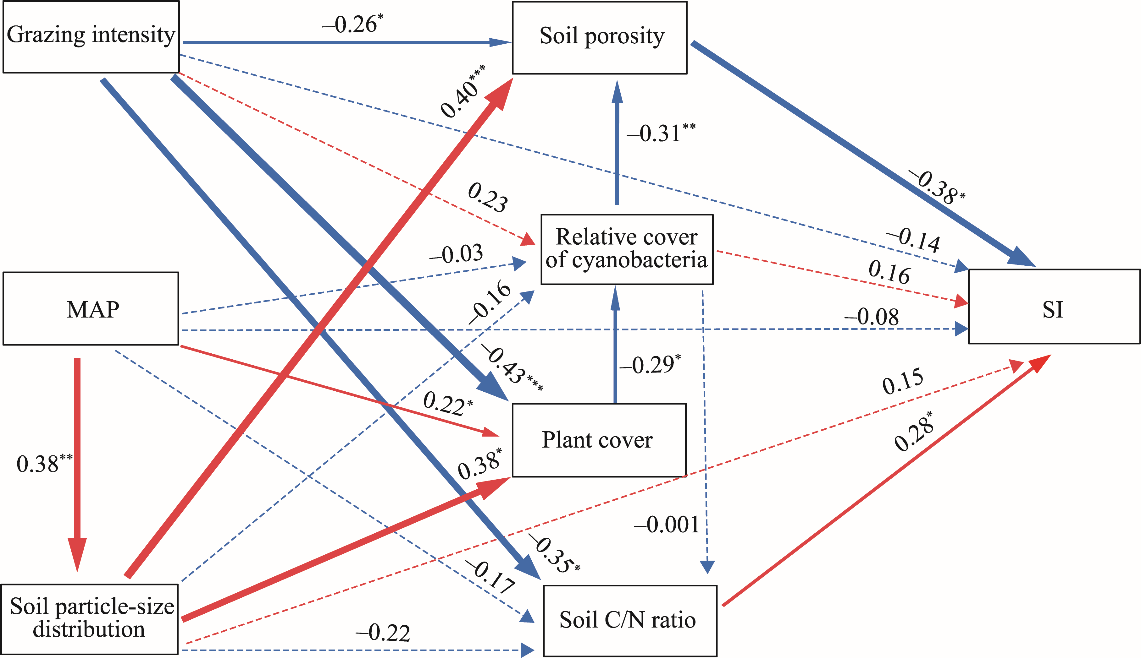
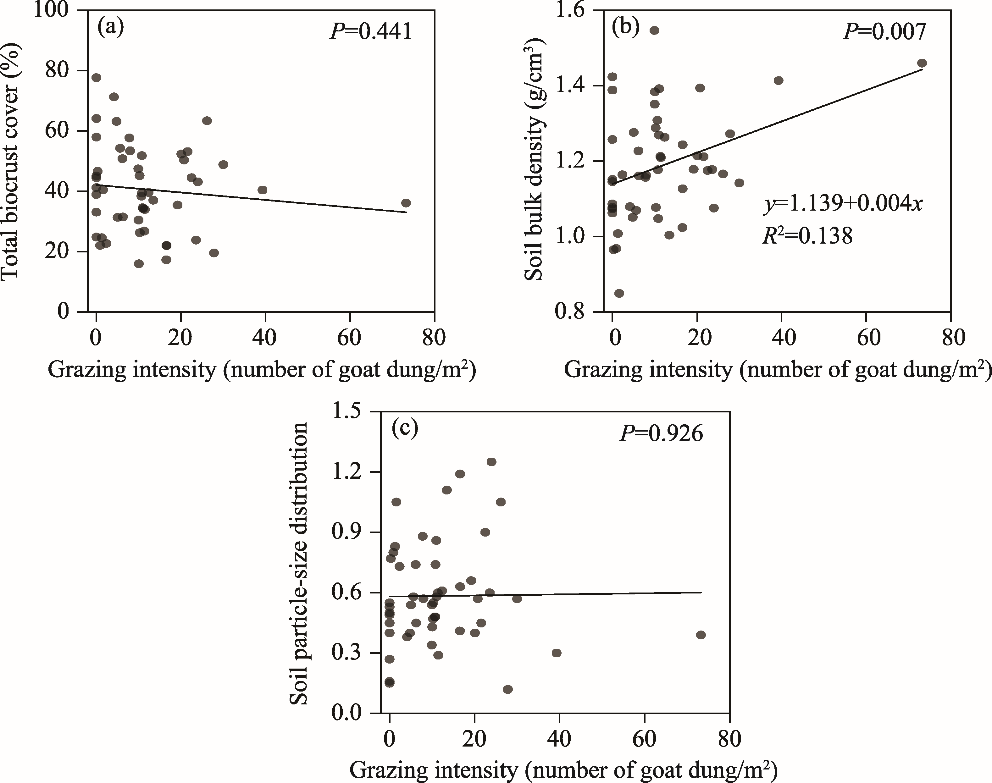
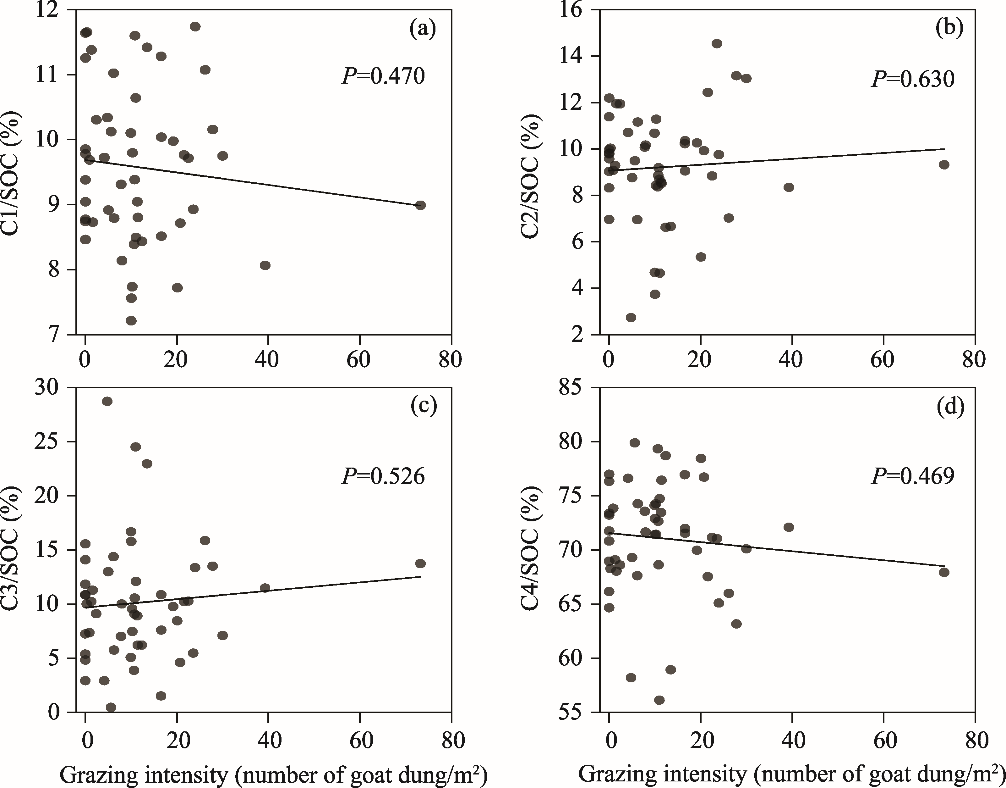
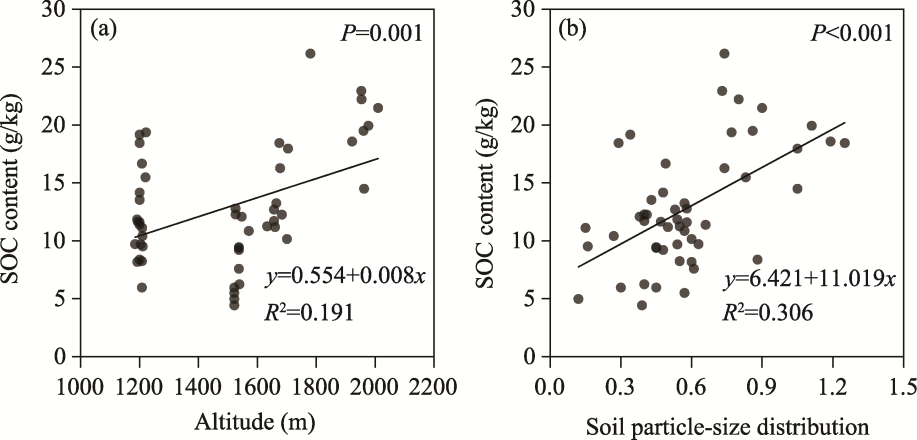
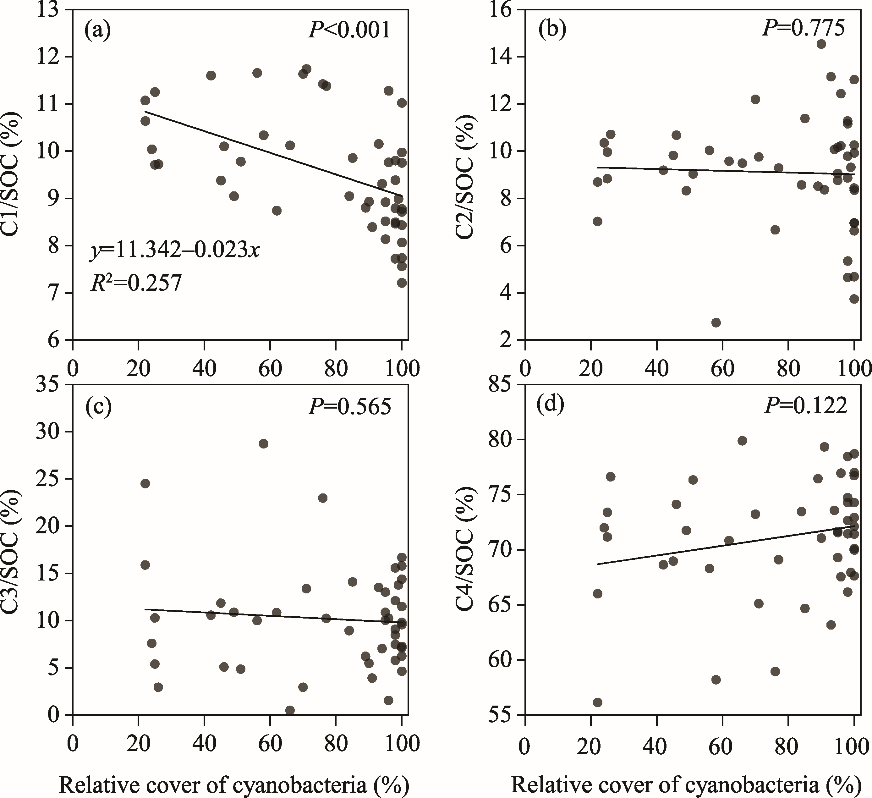
Livestock grazing is the most extensive land use in global drylands and one of the most extensive stressors of biological soil crusts (biocrusts). Despite widespread concern about the importance of biocrusts for global carbon (C) cycling, little is known about whether and how long-term grazing alters soil organic carbon (SOC) stability and stock in the biocrust layer. To assess the responses of SOC stability and stock in the biocrust layer to grazing, from June to September 2020, we carried out a large scale field survey in the restored grasslands under long-term grazing with different grazing intensities (represented by the number of goat dung per square meter) and in the grasslands strictly excluded from grazing in four regions (Dingbian County, Shenmu City, Guyuan City and Ansai District) along precipitation gradient in the hilly Loess Plateau, China. In total, 51 representative grassland sites were identified as the study sampling sites in this study, including 11 sites in Guyuan City, 16 sites in Dingbian County, 15 sites in Shenmu City and 9 sites in Ansai District. Combined with extensive laboratory analysis and statistical analysis, at each sampling site, we obtained data on biocrust attributes (cover, community structure, biomass and thickness), soil physical-chemical properties (soil porosity and soil carbon-to-nitrogen ratio (C/N ratio)), and environmental factors (mean annual precipitation, mean annual temperature, altitude, plant cover, litter cover, soil particle-size distribution (the ratio of soil clay and silt content to sand content)), SOC stability index (SI) and SOC stock (SOCS) in the biocrust layer, to conduct this study. Our results revealed that grazing did not change total biocrust cover but markedly altered biocrust community structure by reducing plant cover, with a considerable increase in the relative cover of cyanobacteria (23.1%) while a decrease in the relative cover of mosses (42.2%). Soil porosity and soil C/N ratio in the biocrust layer under grazing decreased significantly by 4.1%-7.2% and 7.2%-13.3%, respectively, compared with those under grazing exclusion. The shifted biocrust community structure ultimately resulted in an average reduction of 15.5% in SOCS in the biocrust layer under grazing. However, compared with higher grazing (intensity of more than 10.00 goat dung/m2), light grazing (intensity of 0.00-10.00 goat dung/m2 or approximately 1.20-2.60 goat/(hm2·a)) had no adverse effect on SOCS. SOC stability in the biocrust layer remained unchanged under long-term grazing due to the offset between the positive effect of the decreased soil porosity and the negative effect of the decreased soil C/N ratio on the SOC resistance to decomposition. Mean annual precipitation and soil particle-size distribution also regulated SOC stability indirectly by influencing soil porosity through plant cover and biocrust community structure. These findings suggest that proper grazing might not increase the CO2 release potential or adversely affect SOCS in the biocrust layer. This research provides some guidance for proper grazing management in the sustainable utilization of grassland resources and C sequestration in biocrusts in the hilly regions of drylands.
|
|
Received: 13 March 2023
Published: 31 August 2023
|
|
Corresponding Authors:
* XU Mingxiang (E-mail: xumx@nwsuaf.edu.cn)
|
|
|
| [1] |
Abdalla M, Hastings A, Chadwick D R, et al. 2018. Critical review of the impacts of grazing intensity on soil organic carbon storage and other soil quality indicators in extensively managed grasslands. Agriculture, Ecosystems and Environment, 253: 62-81.
doi: 10.1016/j.agee.2017.10.023
|
|
|
| [2] |
Ahlström A, Raupach M R, Schurgers G, et al. 2015. The dominant role of semi-arid ecosystems in the trend and variability of the land CO2 sink. Science, 348(6237): 895-899.
doi: 10.1126/science.aaa1668
pmid: 25999504
|
|
|
| [3] |
Bahram M, Hildebrand F, Forslund S K, et al. 2018. Structure and function of the global topsoil microbiome. Nature, 560(7717): 233-237.
doi: 10.1038/s41586-018-0386-6
|
|
|
| [4] |
Bao T L, Jiao X G, Yang X Q, et al. 2022. Response dynamics and sustainability of the microbial community structure in biocrusts to moderate disturbance: Results of long-term effects. Geoderma, 405: 115460, doi: 10.1016/j.geoderma.2021.
doi: 10.1016/j.geoderma.2021
|
|
|
| [5] |
Bates S T, Nash lll T H, Sweat K G, et al. 2010. Fungal communities of lichen-dominated biological soil crusts: Diversity, relative microbial biomass, and their relationship to disturbance and crust cover. Journal of Arid Environments, 74(10): 1192-1199.
doi: 10.1016/j.jaridenv.2010.05.033
|
|
|
| [6] |
Baumann K, Eckhardt K U, Acksel A, et al. 2021. Contribution of biological soil crusts to soil organic matter composition and stability in temperate forests. Soil Biology and Biochemistry, 160: 108315, doi: 10.1016/j.soilbio.2021.108315.
doi: 10.1016/j.soilbio.2021.108315
|
|
|
| [7] |
Belnap J, Büdel B, Lange O L. 2001. Biological soil crusts: characteristics and distribution. In: Belnap J, Lange O L. Biological Soil Crusts: Structure, Function, and Management. Berlin: Springer International Publishing, 3-30.
|
|
|
| [8] |
Belnap J, Phillips S L. 2001. Soil biota in an ungrazed grassland: response to annual grass (Bromus tectorum) invasion. Ecological Applications, 11(5): 1261-1275.
doi: 10.1890/1051-0761(2001)011[1261:SBIAUG]2.0.CO;2
|
|
|
| [9] |
Belnap J. 2003. Biological soil crusts in deserts: a short review of their role in soil fertility, stabilization, and water relation. Algological Studies, 109(1): 113-126.
doi: 10.1127/1864-1318/2003/0109-0113
|
|
|
| [10] |
Belnap J. 2006. The potential roles of biological soil crusts in dryland hydrologic cycles. Hydrological Processes, 20(15): 3159-3178.
doi: 10.1002/(ISSN)1099-1085
|
|
|
| [11] |
Belnap J, Weber B, Büdel B. 2016. Biological soil crusts as an organizing principle in drylands. In: Weber B, Büdel B, Belnap J. Biological Soil Crusts: An Organizing Principle in Drylands. Cham: Springer International Publishing, 3-13.
|
|
|
| [12] |
Blair G J, Lefroy R D B, Lisle L. 1995. Soil carbon fractions based on their degree of oxidation, and the development of a carbon management index for agricultural systems. Australian Journal of Agricultural Research, 46(7): 1459-1466.
doi: 10.1071/AR9951459
|
|
|
| [13] |
Bowker M A, Belnap J, Büdel B, et al. 2016. Controls on distribution patterns of biological soil crusts at micro- to global scales. In: Weber B, Büdel B, Belnap J. Biological Soil Crusts: An Organizing Principle in Drylands. Cham: Springer International Publishing, 173-197.
|
|
|
| [14] |
Brasher B R, Franzmeier D P, Valassis V, et al. 1966. Use of saran resin to coat natural soil clods for bulk-density and water-retention measurements. Soil Science, 101(2): 108.
doi: 10.1097/00010694-196602000-00006
|
|
|
| [15] |
Bremner J M, Mulvaney C S. 1983. Nitrogen—total. In: Page A L, Miller R H, Keeney D R. Methods of Soil Analysis: Part 2, Chemical and Microbiological Properties. Madison: American Society of Agronomy, Soil Science Society of America, 595-624.
|
|
|
| [16] |
Castle S C, Morrison C D, Barger N N. 2011. Extraction of chlorophyll a from biological soil crusts: A comparison of solvents for spectrophotometric determination. Soil Biology and Biochemistry, 43(4): 853-856.
doi: 10.1016/j.soilbio.2010.11.025
|
|
|
| [17] |
Chan K Y, Bowman A, Oates A. 2001. Oxidizible organic carbon fractions and soil quality changes in an oxic paleustalf under different pasture leys. Soil Science, 166(1): 61-67.
doi: 10.1097/00010694-200101000-00009
|
|
|
| [18] |
Chen L L, Wang K X, Baoyin T G T. 2021. Effects of grazing and mowing on vertical distribution of soil nutrients and their stoichiometry (C: N: P) in a semi-arid grassland of North China. CATENA, 206: 105507, doi: 10.1016/j.catena.2021.105507.
doi: 10.1016/j.catena.2021.105507
|
|
|
| [19] |
Concostrina-Zubiri L, Huber-Sannwald E, Martínez I, et al. 2014. Biological soil crusts across disturbance-recovery scenarios: effect of grazing regime on community dynamics. Ecological Applications, 24(7): 1863-1877.
pmid: 29210244
|
|
|
| [20] |
Concostrina-Zubiri L, Molla I, Velizarova E, et al. 2017. Grazing or not grazing: implications for ecosystem services provided by biocrusts in Mediterranean cork oak woodlands. Land Degradation & Development, 28(4): 1345-1353.
doi: 10.1002/ldr.v28.4
|
|
|
| [21] |
Ding J Y, Eldridge D J. 2020. Biotic and abiotic effects on biocrust cover vary with microsite along an extensive aridity gradient. Plant and Soil, 450: 429-441.
doi: 10.1007/s11104-020-04517-0
|
|
|
| [22] |
Doetterl S, Berhe A A, Nadeu E, et al. 2016. Erosion, deposition and soil carbon: A review of process-level controls, experimental tools and models to address C cycling in dynamic landscapes. Earth-Science Reviews, 154: 102-122.
doi: 10.1016/j.earscirev.2015.12.005
|
|
|
| [23] |
Elbert W, Weber B, Burrows S, et al. 2012. Contribution of cryptogamic covers to the global cycles of carbon and nitrogen. Nature Geoscience, 5(7): 459-462.
doi: 10.1038/ngeo1486
|
|
|
| [24] |
Eldridge D J, Delgado-Baquerizo M. 2018. Functional groups of soil fungi decline under grazing. Plant and Soil, 426: 51-60.
doi: 10.1007/s11104-018-3617-6
|
|
|
| [25] |
Faist A M, Herrick J E, Belnap J, et al. 2017. Biological soil crust and disturbance controls on surface hydrology in a semi-arid ecosystem. Ecosphere, 8(3): e01691, doi: 10.1002/ecs2.1691.
doi: 10.1002/ecs2.1691
|
|
|
| [26] |
Ferrenberg S, Reed S C, Belnap J. 2015. Climate change and physical disturbance cause similar community shifts in biological soil crusts. Proceedings of the National Academy of Sciences, 112(39): 12116-12121.
|
|
|
| [27] |
Freitag M, Kamp J, Dara A, et al. 2021. Post-soviet shifts in grazing and fire regimes changed the functional plant community composition on the Eurasian steppe. Global Change Biology, 27(2): 388-401.
doi: 10.1111/gcb.15411
pmid: 33085817
|
|
|
| [28] |
Gao L Q, Bowker M A, Xu M X, et al. 2017. Biological soil crusts decrease erodibility by modifying inherent soil properties on the Loess Plateau, China. Soil Biology and Biochemistry, 105: 49-58.
doi: 10.1016/j.soilbio.2016.11.009
|
|
|
| [29] |
Grace J B. 2006. Structural Equation Modeling and Natural Systems. Cambridge: Cambridge University Press, 37-76.
|
|
|
| [30] |
Housman D C, Powers H H, Collins A D, et al. 2006. Carbon and nitrogen fixation differ between successional stages of biological soil crusts in the Colorado Plateau and Chihuahuan Desert. Journal of Arid Environments, 66(4): 620-634.
doi: 10.1016/j.jaridenv.2005.11.014
|
|
|
| [31] |
International Union of Soil Sciences Working Group World Reference Base. 2015. World Reference Base for soil resources 2014, update 2015: International soil classification system for naming soils and creating legends for soil maps. World Soil Resources Reports No. 106. Rome: Food and Agricultural Organization of the United Nations.
|
|
|
| [32] |
Jin B C, Sun G J, Zhang Y, et al. 2016. Livestock tracks transform resource distribution on terracette landscapes of the Loess Plateau. Ecosphere, 7(4): e01337, doi: 10.1002/ecs2.1337.
doi: 10.1002/ecs2.1337
|
|
|
| [33] |
Kravchenko A N, Guber A K. 2017. Soil pores and their contributions to soil carbon processes. Geoderma, 287: 31-39.
doi: 10.1016/j.geoderma.2016.06.027
|
|
|
| [34] |
Laing S E, Buckland S T, Burn R W, et al. 2003. Dung and nest surveys: estimating decay rates. Journal of Applied Ecology, 40(6): 1102-1111.
doi: 10.1111/j.1365-2664.2003.00861.x
|
|
|
| [35] |
Lefroy R D B, Blair G J, Strong W M. 1993. Changes in soil organic matter with cropping as measured by organic carbon fractions and 13C natural isotope abundance. Plant and Soil, 155: 399-402.
|
|
|
| [36] |
Liu W X, Zhang Z, Wan S Q. 2009. Predominant role of water in regulating soil and microbial respiration and their responses to climate change in a semiarid grassland. Global Change Biology, 15(1): 184-195.
doi: 10.1111/gcb.2009.15.issue-1
|
|
|
| [37] |
Loginow W, Wisniewski W, Gonet S S, et al. 1987. Fractionation of organic carbon based on susceptibility to oxidation. Polish Journal of Soil Science, 20(1): 47-52.
|
|
|
| [38] |
Luo Z K, Feng W T, Luo Y Q, et al. 2017. Soil organic carbon dynamics jointly controlled by climate, carbon inputs, soil properties and soil carbon fractions. Global Change Biology, 23(10): 4430-4439.
doi: 10.1111/gcb.13767
pmid: 28544252
|
|
|
| [39] |
Maestre F T, Escolar C, de Guevara M L, et al. 2013. Changes in biocrust cover drive carbon cycle responses to climate change in drylands. Global Change Biology, 19(12): 3835-3847.
doi: 10.1111/gcb.12306
pmid: 23818331
|
|
|
| [40] |
Maestre F T, Le Bagousse-Pinguet Y, Delgado-Baquerizo M, et al. 2022. Grazing and ecosystem service delivery in global drylands. Science, 378(6622): 915-920.
doi: 10.1126/science.abq4062
pmid: 36423285
|
|
|
| [41] |
Miralles I, Domingo F, Cantón Y, et al. 2012. Hydrolase enzyme activities in a successional gradient of biological soil crusts in arid and semi-arid zones. Soil Biology and Biochemistry, 53: 124-132.
doi: 10.1016/j.soilbio.2012.05.016
|
|
|
| [42] |
Miralles I, Trasar-Cepeda C, Leirós M C, et al. 2013. Labile carbon in biological soil crusts in the Tabernas Desert, SE Spain. Soil Biology and Biochemistry, 58: 1-8.
doi: 10.1016/j.soilbio.2012.11.010
|
|
|
| [43] |
Miralles I, Lázaro R, Sánchez-Marañón M, et al. 2020. Biocrust cover and successional stages influence soil bacterial composition and diversity in semiarid ecosystems. Science of The Total Environment, 709: 134654, doi: 10.1016/j.scitotenv.2019.134654.
doi: 10.1016/j.scitotenv.2019.134654
|
|
|
| [44] |
Miralles-Mellado I, Cantón Y, Solé-Benet A. 2011. Two-dimensional porosity of crusted silty soils: Indicators of soil quality in semiarid rangelands? Soil Science Society of America Journal, 75(4): 1330-1342.
doi: 10.2136/sssaj2010.0283
|
|
|
| [45] |
Mondal S, Chakraborty D. 2022. Global meta-analysis suggests that no-tillage favourably changes soil structure and porosity. Geoderma, 405: 115443, doi: 10.1016/j.geoderma.2021.115443.
doi: 10.1016/j.geoderma.2021.115443
|
|
|
| [46] |
National Bureau of Statistics of China. 2019. China Statistical Yearbook (County-Level). Beijing: China Statistics Press. (in Chinese)
|
|
|
| [47] |
Nelson D A, Sommers L E. 1983. Total carbon, organic carbon, and organic matter. In: Page A L, Miller R H, Keeney D R. Methods of Soil Analysis: Part 2. Madison: American Society of Agronomy, Soil Science Society of America.539-579.
|
|
|
| [48] |
Prăvălie R. 2016. Drylands extent and environmental issues. A global approach. Earth-Science Reviews, 161: 259-278.
|
|
|
| [49] |
Pietrasiak N, Regus J U, Johansen J R, et al. 2013. Biological soil crust community types differ in key ecological functions. Soil Biology and Biochemistry, 65: 168-171.
doi: 10.1016/j.soilbio.2013.05.011
|
|
|
| [50] |
Ramírez P B, Fuentes-Alburquenque S, Díez B, et al. 2020. Soil microbial community responses to labile organic carbon fractions in relation to soil type and land use along a climate gradient. Soil Biology and Biochemistry, 141: 107692, doi: 10.1016/j.soilbio.2019.107692.
doi: 10.1016/j.soilbio.2019.107692
|
|
|
| [51] |
Riggs C E, Hobbie S E. 2016. Mechanisms driving the soil organic matter decomposition response to nitrogen enrichment in grassland soils. Soil Biology and Biochemistry, 99: 54-65.
doi: 10.1016/j.soilbio.2016.04.023
|
|
|
| [52] |
Root H T, Miller J E D, Rosentreter R. 2020. Grazing disturbance promotes exotic annual grasses by degrading soil biocrust communities. Ecological Applications, 30(1): e02016, doi: 10.1002/eap.2016.
doi: 10.1002/eap.2016
|
|
|
| [53] |
Sancho L G, Belnap J, Colesie C, et al. 2016. Carbon budgets of biological soil crusts at micro-, meso-, and global scales. In: Weber B, Büdel B, Belnap J. Biological Soil Crusts: An Organizing Principle in Drylands. Cham: Springer International Publishing, 287-304.
|
|
|
| [54] |
Schuman G E, Herrick J E, Janzen H H. 2001. The dynamics of soil carbon in rangelands. In: Follett R F, Kimble J M, Lal R. The Potential of U.S. Grazing Lands to Sequester Carbon and Mitigate the Greenhouse Effect. Boca Raton: Lewis Publishers, 267-290.
|
|
|
| [55] |
Sollins P, Homann P, Caldwell B A. 1996. Stabilization and destabilization of soil organic matter: mechanisms and controls. Geoderma, 74(1-2): 65-105.
doi: 10.1016/S0016-7061(96)00036-5
|
|
|
| [56] |
Sun H, Zhao Y G, Liu G L, et al. 2022. Effects of Grazing Intensity on the grassland vegetation community characteristics in the hilly Loess Plateau region. Acta Agrestia Sinica, 30(4): 810-817. (in Chinese)
doi: 10.11733/j.issn.1007-0435.2022.04.005
|
|
|
| [57] |
Thomas A D. 2012. Impact of grazing intensity on seasonal variations in soil organic carbon and soil CO2 efflux in two semiarid grasslands in southern Botswana. Philosophical Transactions of the Royal Society B: Biological Sciences, 367(1606): 3076-3086.
doi: 10.1098/rstb.2012.0102
|
|
|
| [58] |
Warren S D. 2001. Synopsis: Influence of biological soil crusts on arid land hydrology and soil stability. In: Belnap J, Lange O L. Biological Soil Crusts: Structure, Function, and Management. Berlin: Springer International Publishing, 349-360.
|
|
|
| [59] |
Warren S D, Eldridge D J. 2001. Biological soil crusts and livestock in arid ecosystems: Are they compatible? In: Belnap J, Lange O L. Biological Soil Crusts: Structure, Function, and Management. Berlin: Springer International Publishing, 401-415.
|
|
|
| [60] |
Wu Y S, Li X R, Hasi E, et al. 2020. Surface roughness response of biocrust-covered soil to mimicked sheep trampling in the Mu Us sandy Land, northern China. Geoderma, 363: 114146, doi: 10.1016/j.geoderma.2019.114146.
doi: 10.1016/j.geoderma.2019.114146
|
|
|
| [61] |
Wu Y S, Li X R, Jia R L, et al. 2023. Livestock trampling regulates the soil carbon exchange by mediating surface roughness and biocrust cover. Geoderma, 429: 116275, doi: 10.1016/j.geoderma.2022.116275.
doi: 10.1016/j.geoderma.2022.116275
|
|
|
| [62] |
Xu H K, Zhang Y J, Shao X Q, et al. 2022. Soil nitrogen and climate drive the positive effect of biological soil crusts on soil organic carbon sequestration in drylands: A Meta-analysis. Science of The Total Environment, 803: 150030, doi: 10.1016/j.scitotenv.2021.150030.
doi: 10.1016/j.scitotenv.2021.150030
|
|
|
| [63] |
Xu X, Shi Z, Li D J, et al. 2016. Soil properties control decomposition of soil organic carbon: Results from data-assimilation analysis. Geoderma, 262: 235-242.
doi: 10.1016/j.geoderma.2015.08.038
|
|
|
| [64] |
Yang K, Zhao Y G, Gao L Q. 2022a. Biocrust succession improves soil aggregate stability of subsurface after "Grain for Green" Project in the hilly Loess Plateau, China. Soil and Tillage Research, 217: 105290, doi: 10.1016/j.still.2021.105290.
doi: 10.1016/j.still.2021.105290
|
|
|
| [65] |
Yang K, Zhao Y G, Gao L Q, et al. 2022b. Nonlinear response of hydrodynamic and soil erosive behaviors to biocrust coverage in drylands. Geoderma, 405: 115457, doi: 10.1016/j.geoderma.2021.115457.
doi: 10.1016/j.geoderma.2021.115457
|
|
|
| [66] |
Yang X Q, Xu M X, Zhao Y G, et al. 2020. Trampling disturbance of biocrust enhances soil carbon emission. Rangeland Ecology & Management, 73(4): 501-510.
doi: 10.1016/j.rama.2020.02.005
|
|
|
| [67] |
Yao X M, Bowker M A, Xiao B. 2020. Estimation of annual CO2 efflux of moss biocrust through measuring and simulating its respiration rate in a semiarid climate. Geoderma, 376: 114560, doi: 10.1016/j.geoderma.2020.114560.
doi: 10.1016/j.geoderma.2020.114560
|
|
|
| [68] |
Zhang J, Eldridge D J, Delgado-Baquerizo M. 2016. Biotic communities cannot mitigate the negative effects of grazing on multiple ecosystem functions and services in an arid shrubland. Plant and Soil, 401: 381-395.
doi: 10.1007/s11104-015-2754-4
|
|
|
| [69] |
Zhang Y D, Gao M, Yu C Y, et al. 2022. Soil nutrients, enzyme activities, and microbial communities differ among biocrust types and soil layers in a degraded karst ecosystem. CATENA, 212: 106057, doi: 10.1016/j.catena.2022.106057.
doi: 10.1016/j.catena.2022.106057
|
|
|
| [70] |
Zhao Y G, Qin N Q, Weber B, et al. 2014. Response of biological soil crusts to raindrop erosivity and underlying influences in the hilly Loess Plateau region, China. Biodiversity and Conservation, 23(7): 1669-1686.
doi: 10.1007/s10531-014-0680-z
|
|
|
| [71] |
Zhou G Y, Xu S, Ciais P, et al. 2019. Climate and litter C/N ratio constrain soil organic carbon accumulation. National Science Review, 6(4): 746-757.
doi: 10.1093/nsr/nwz045
|
|
|
|
Viewed |
|
|
|
Full text
|
|
|
|
|
Abstract
|
|
|
|
|
Cited |
|
|
|
|
| |
Shared |
|
|
|
|
| |
Discussed |
|
|
|
|