| Research article |
|


|
|
|
| Influence of nitrogen inputs on biomass allocation strategies of dominant plant species in sandy ecosystems |
CHENG Li1,2, ZHAN Jin1,2, NING Zhiying1,2, LI Yulin1,2,3,*( ) ) |
1Northwest Institute of Eco-Environment and Resources, Chinese Academy of Sciences, Lanzhou 730000, China
2University of Chinese Academy of Sciences, Beijing 100049, China
3Naiman Desertification Research Station, Northwest Institute of Eco-Environment and Resources, Chinese Academy of Sciences, Tongliao 028300, China |
|
|
|
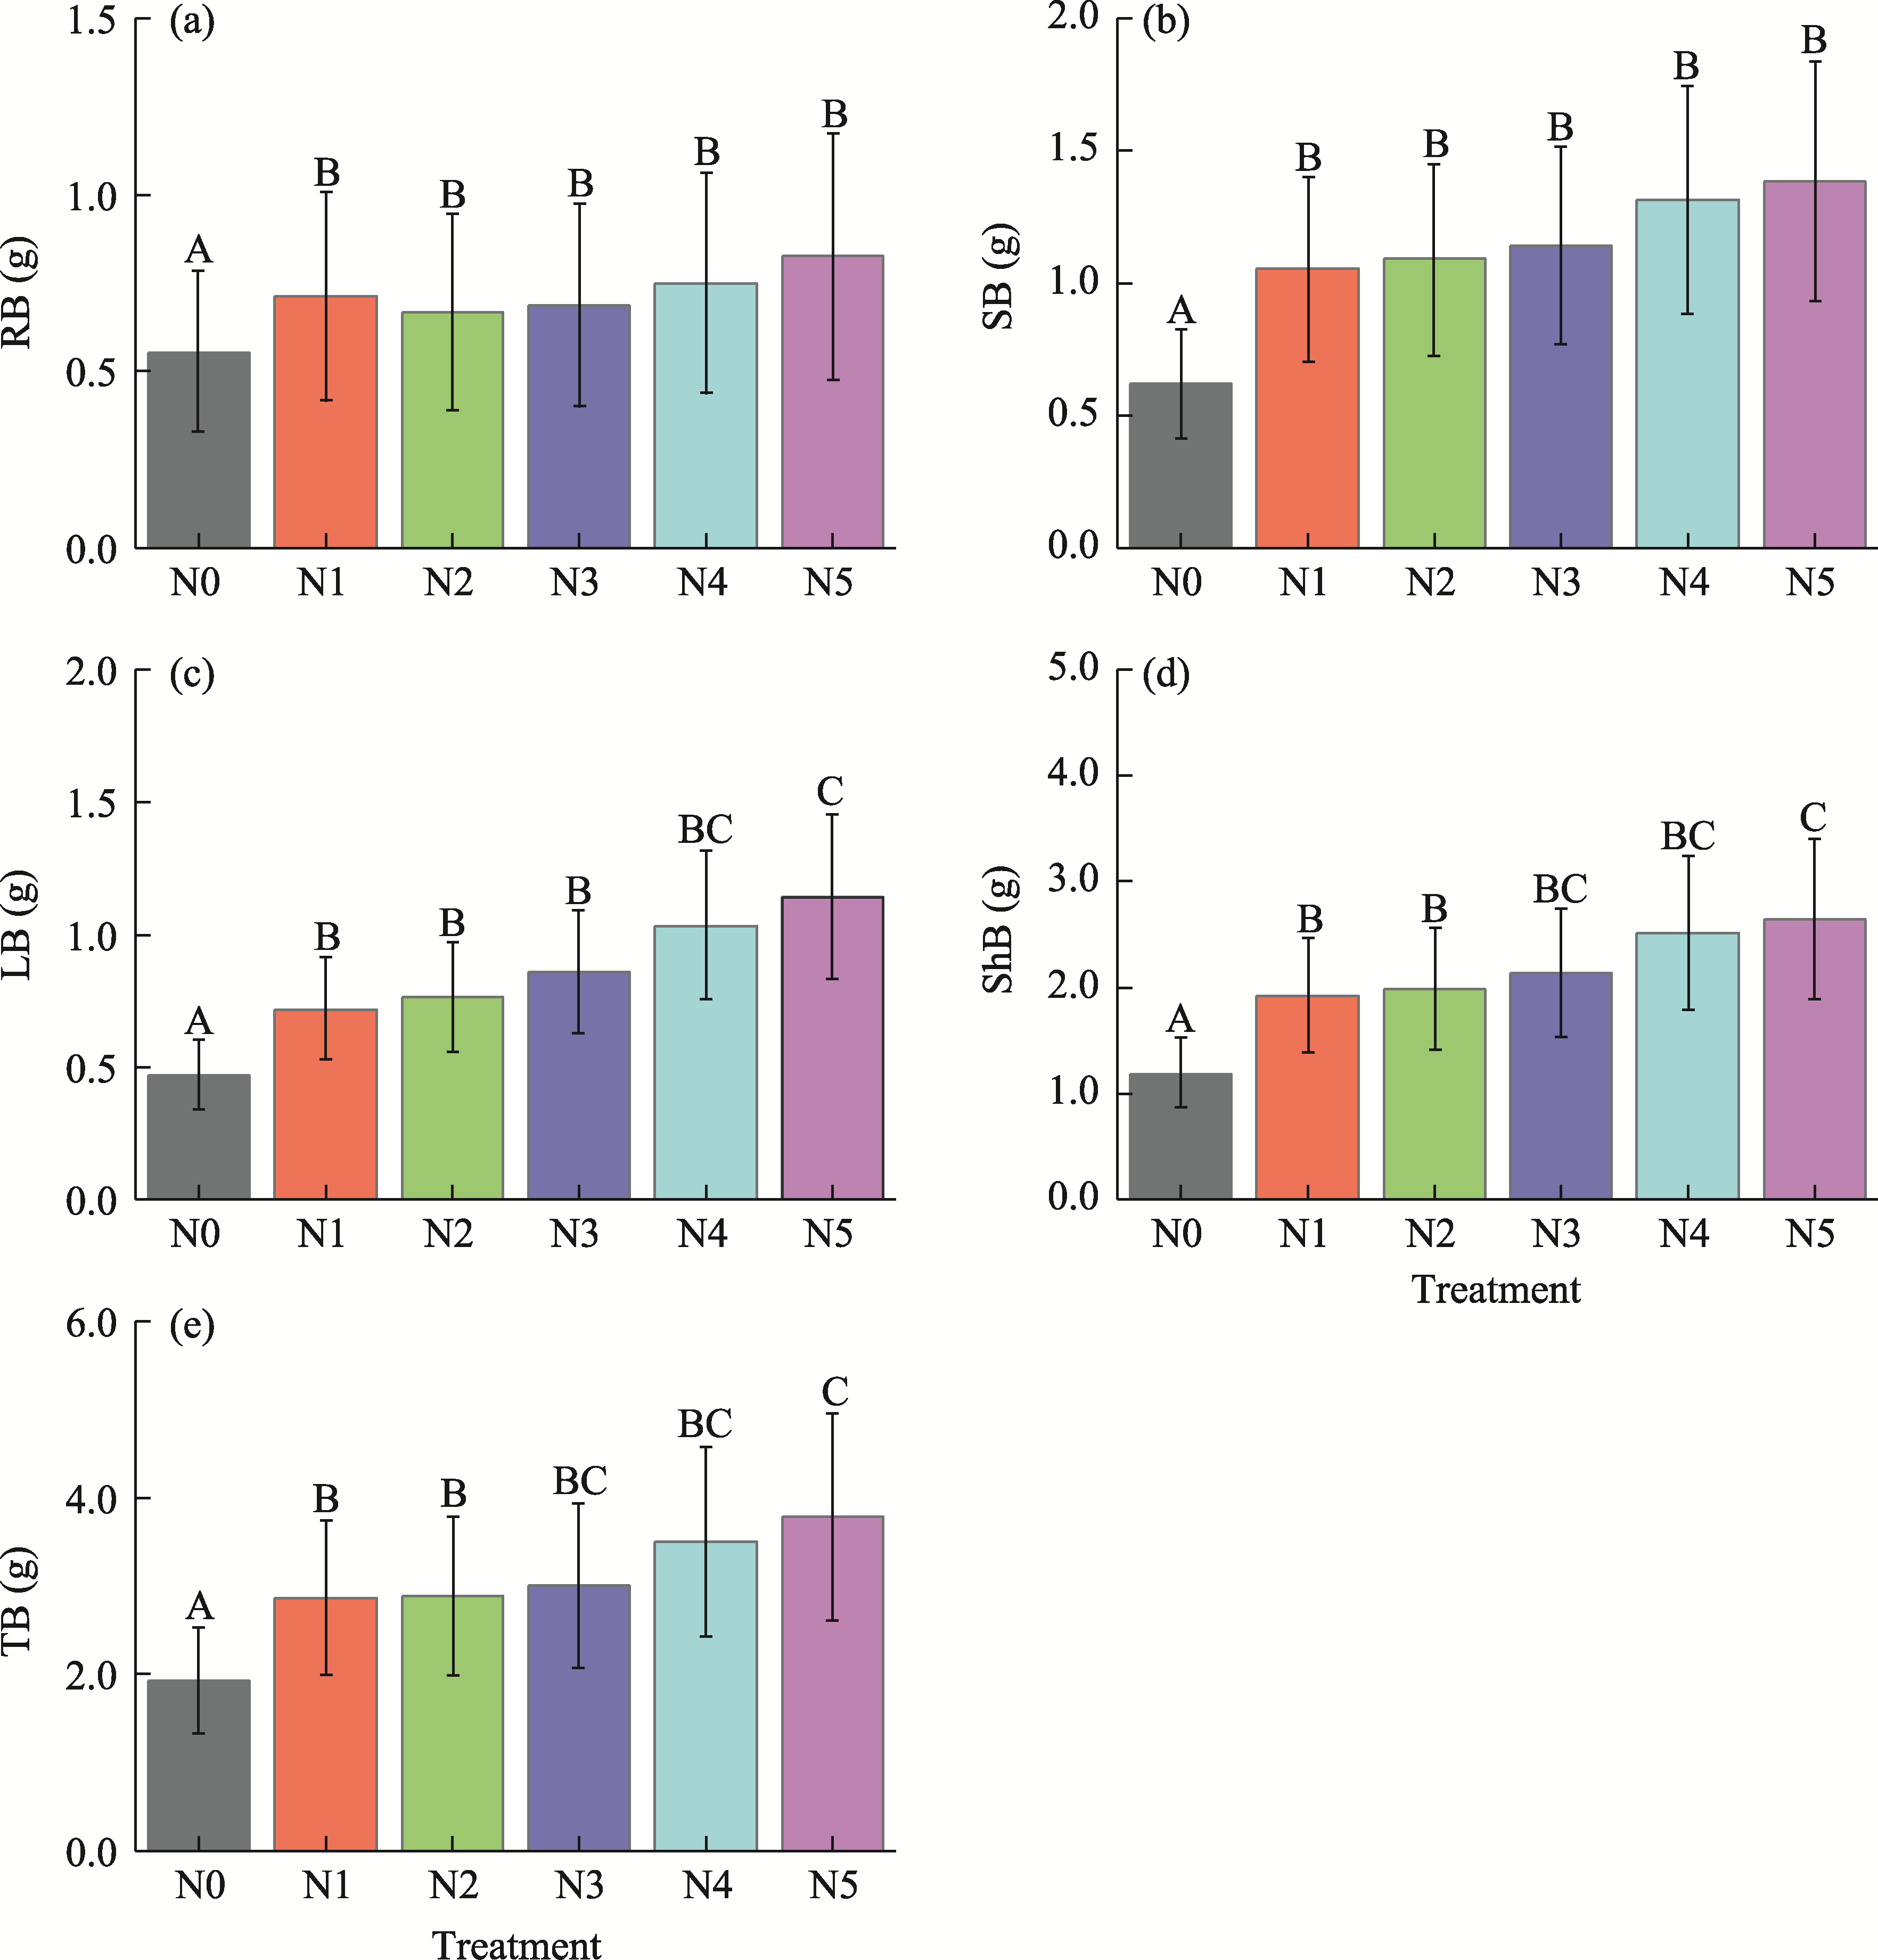
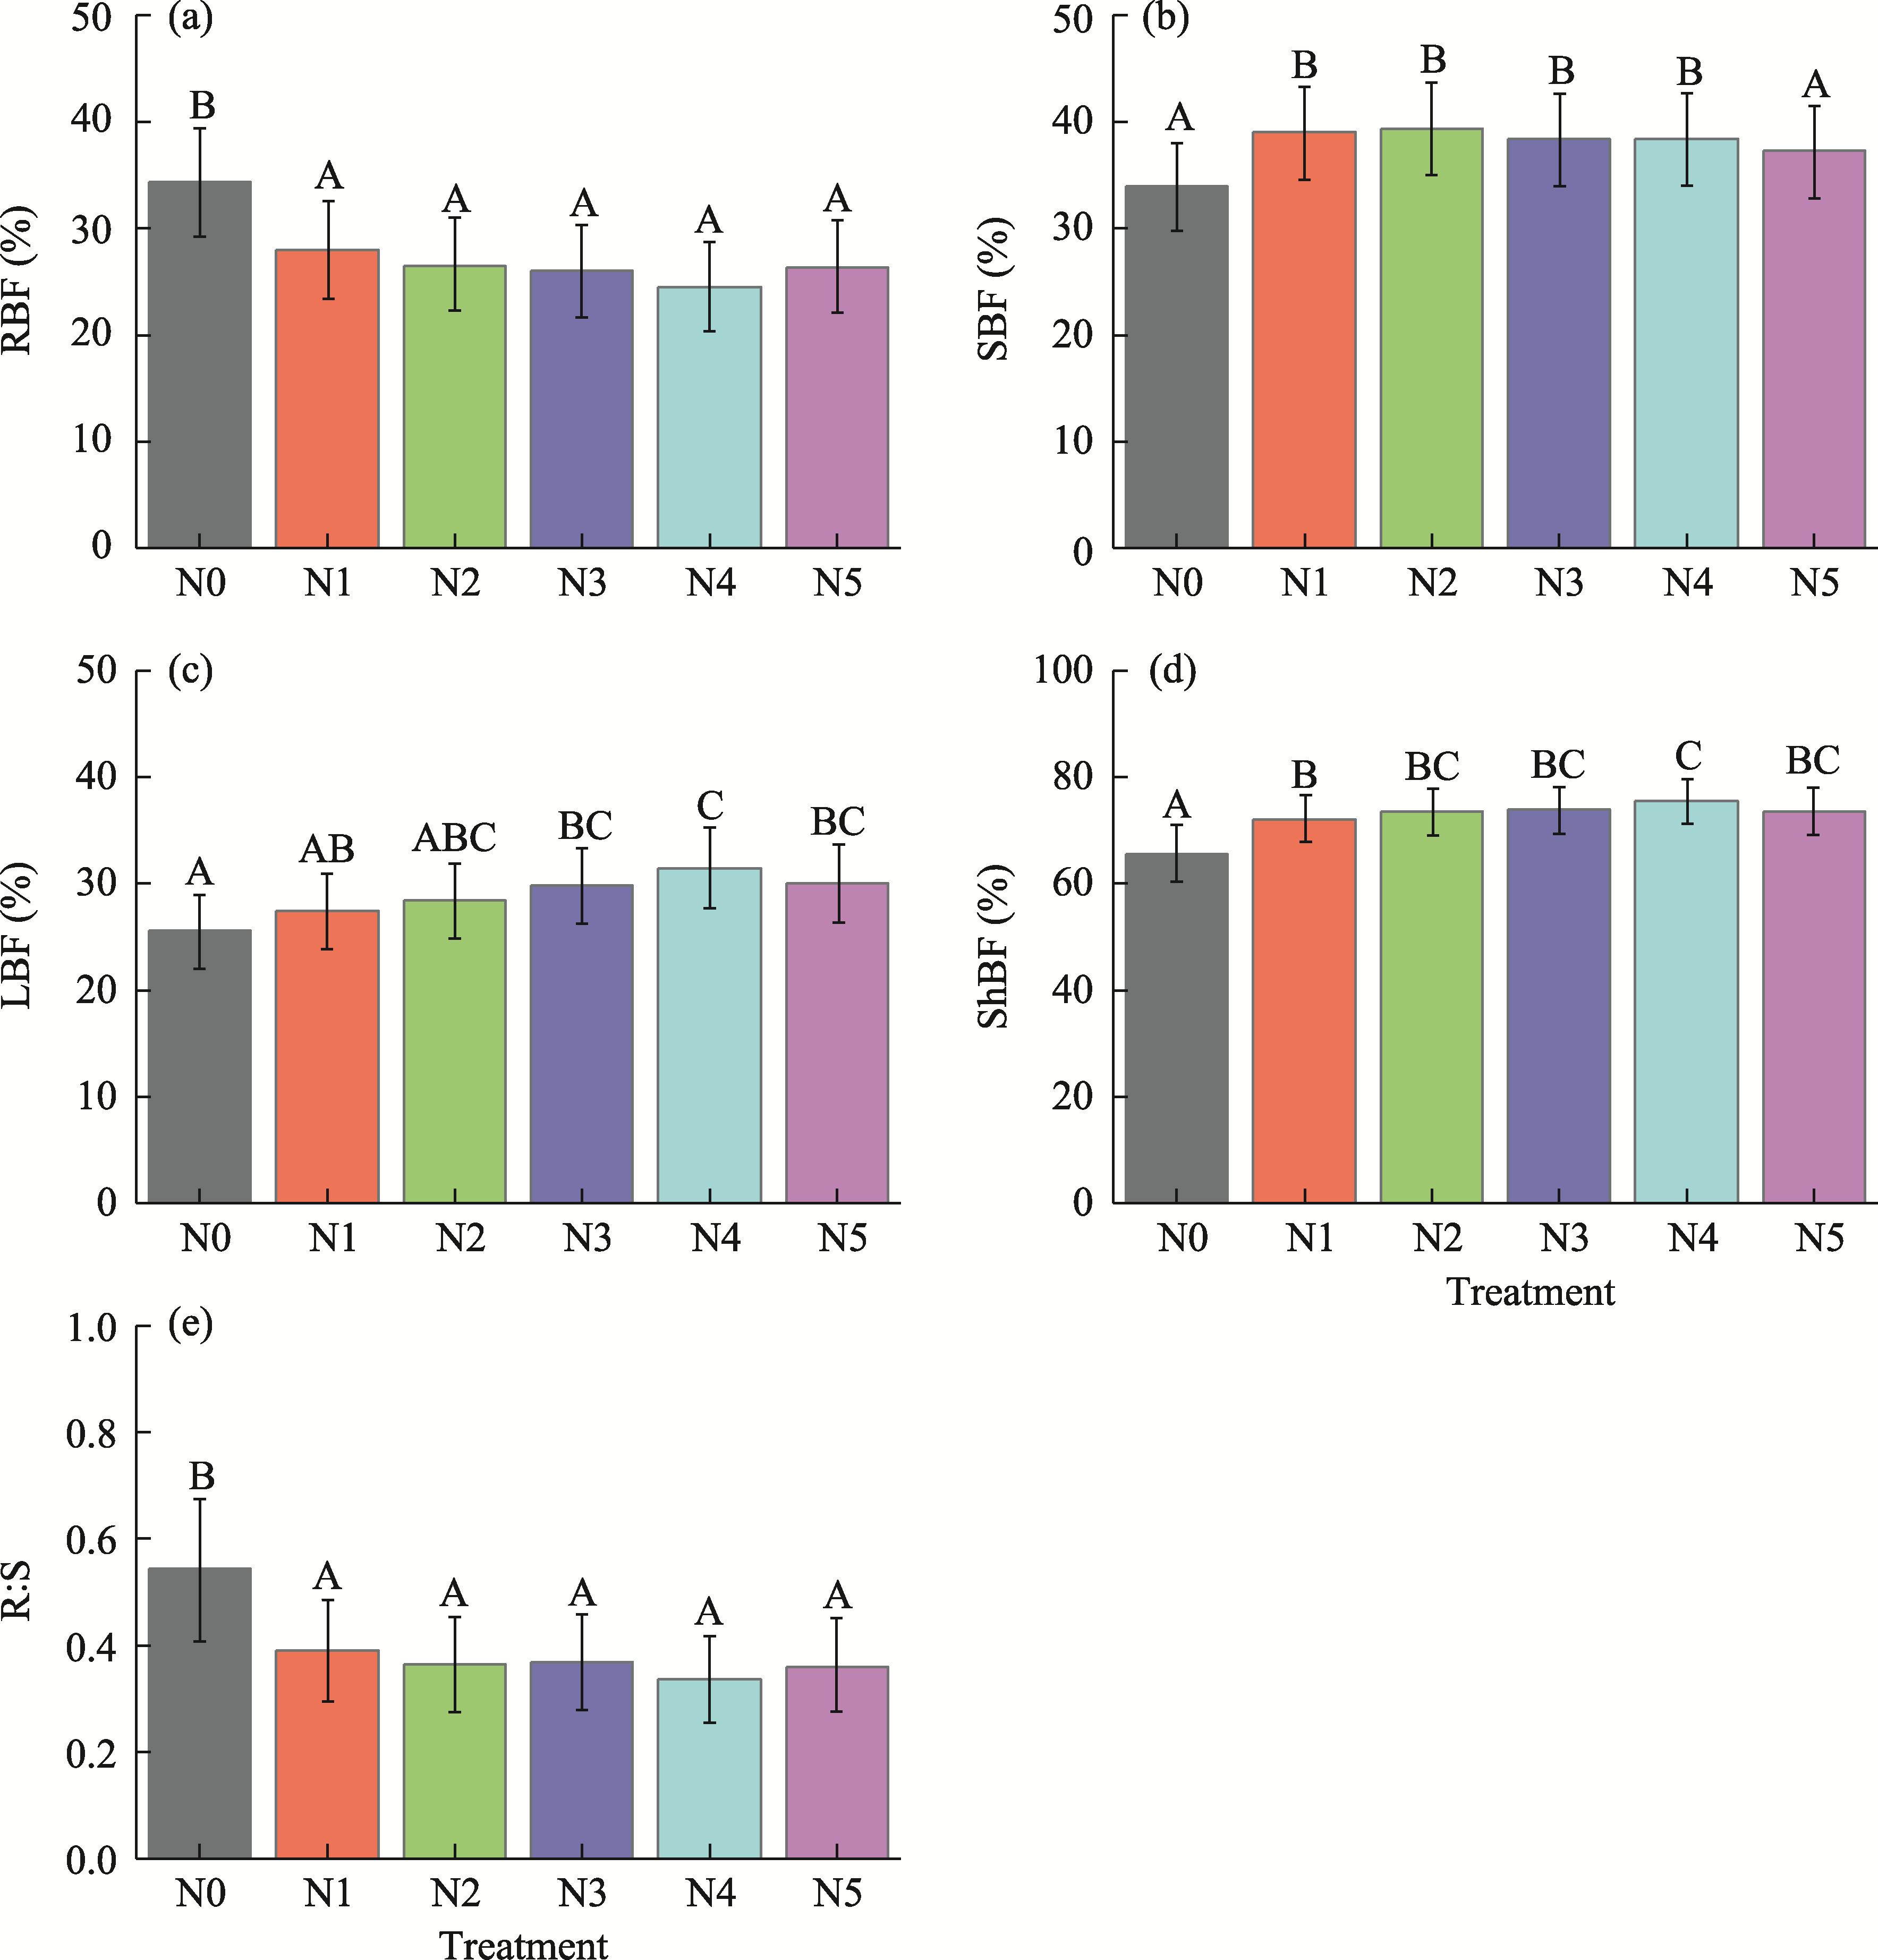
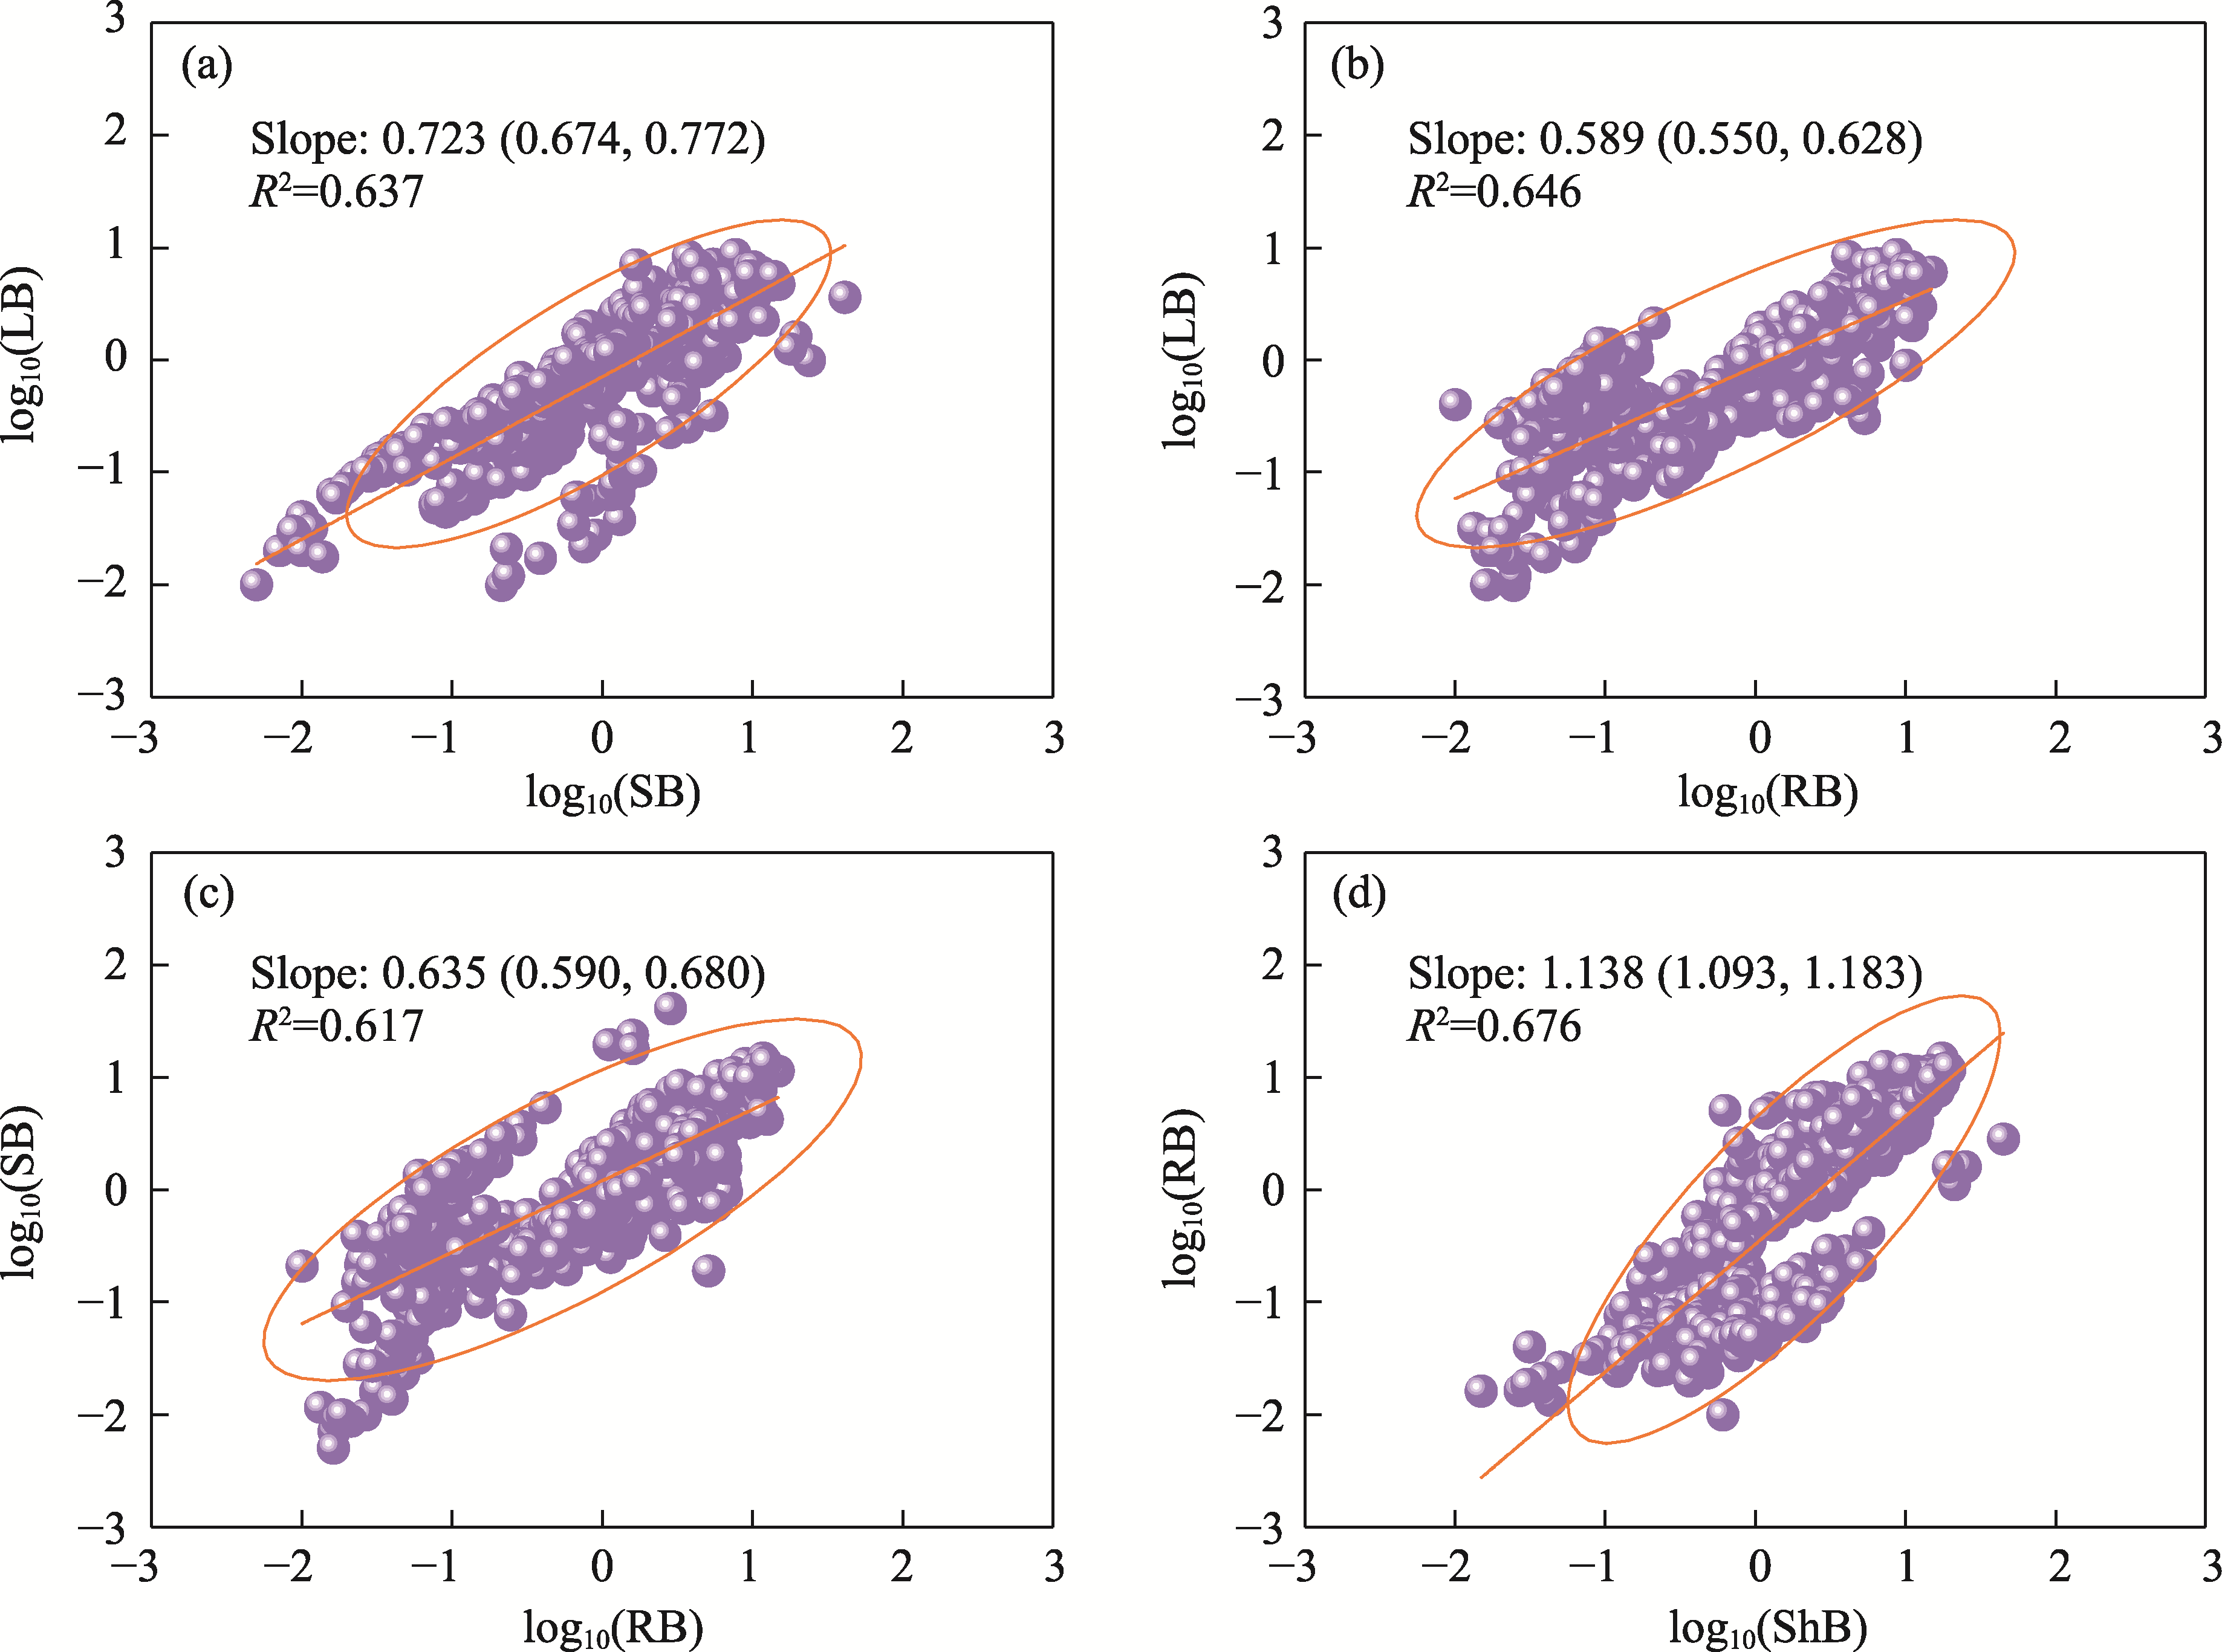
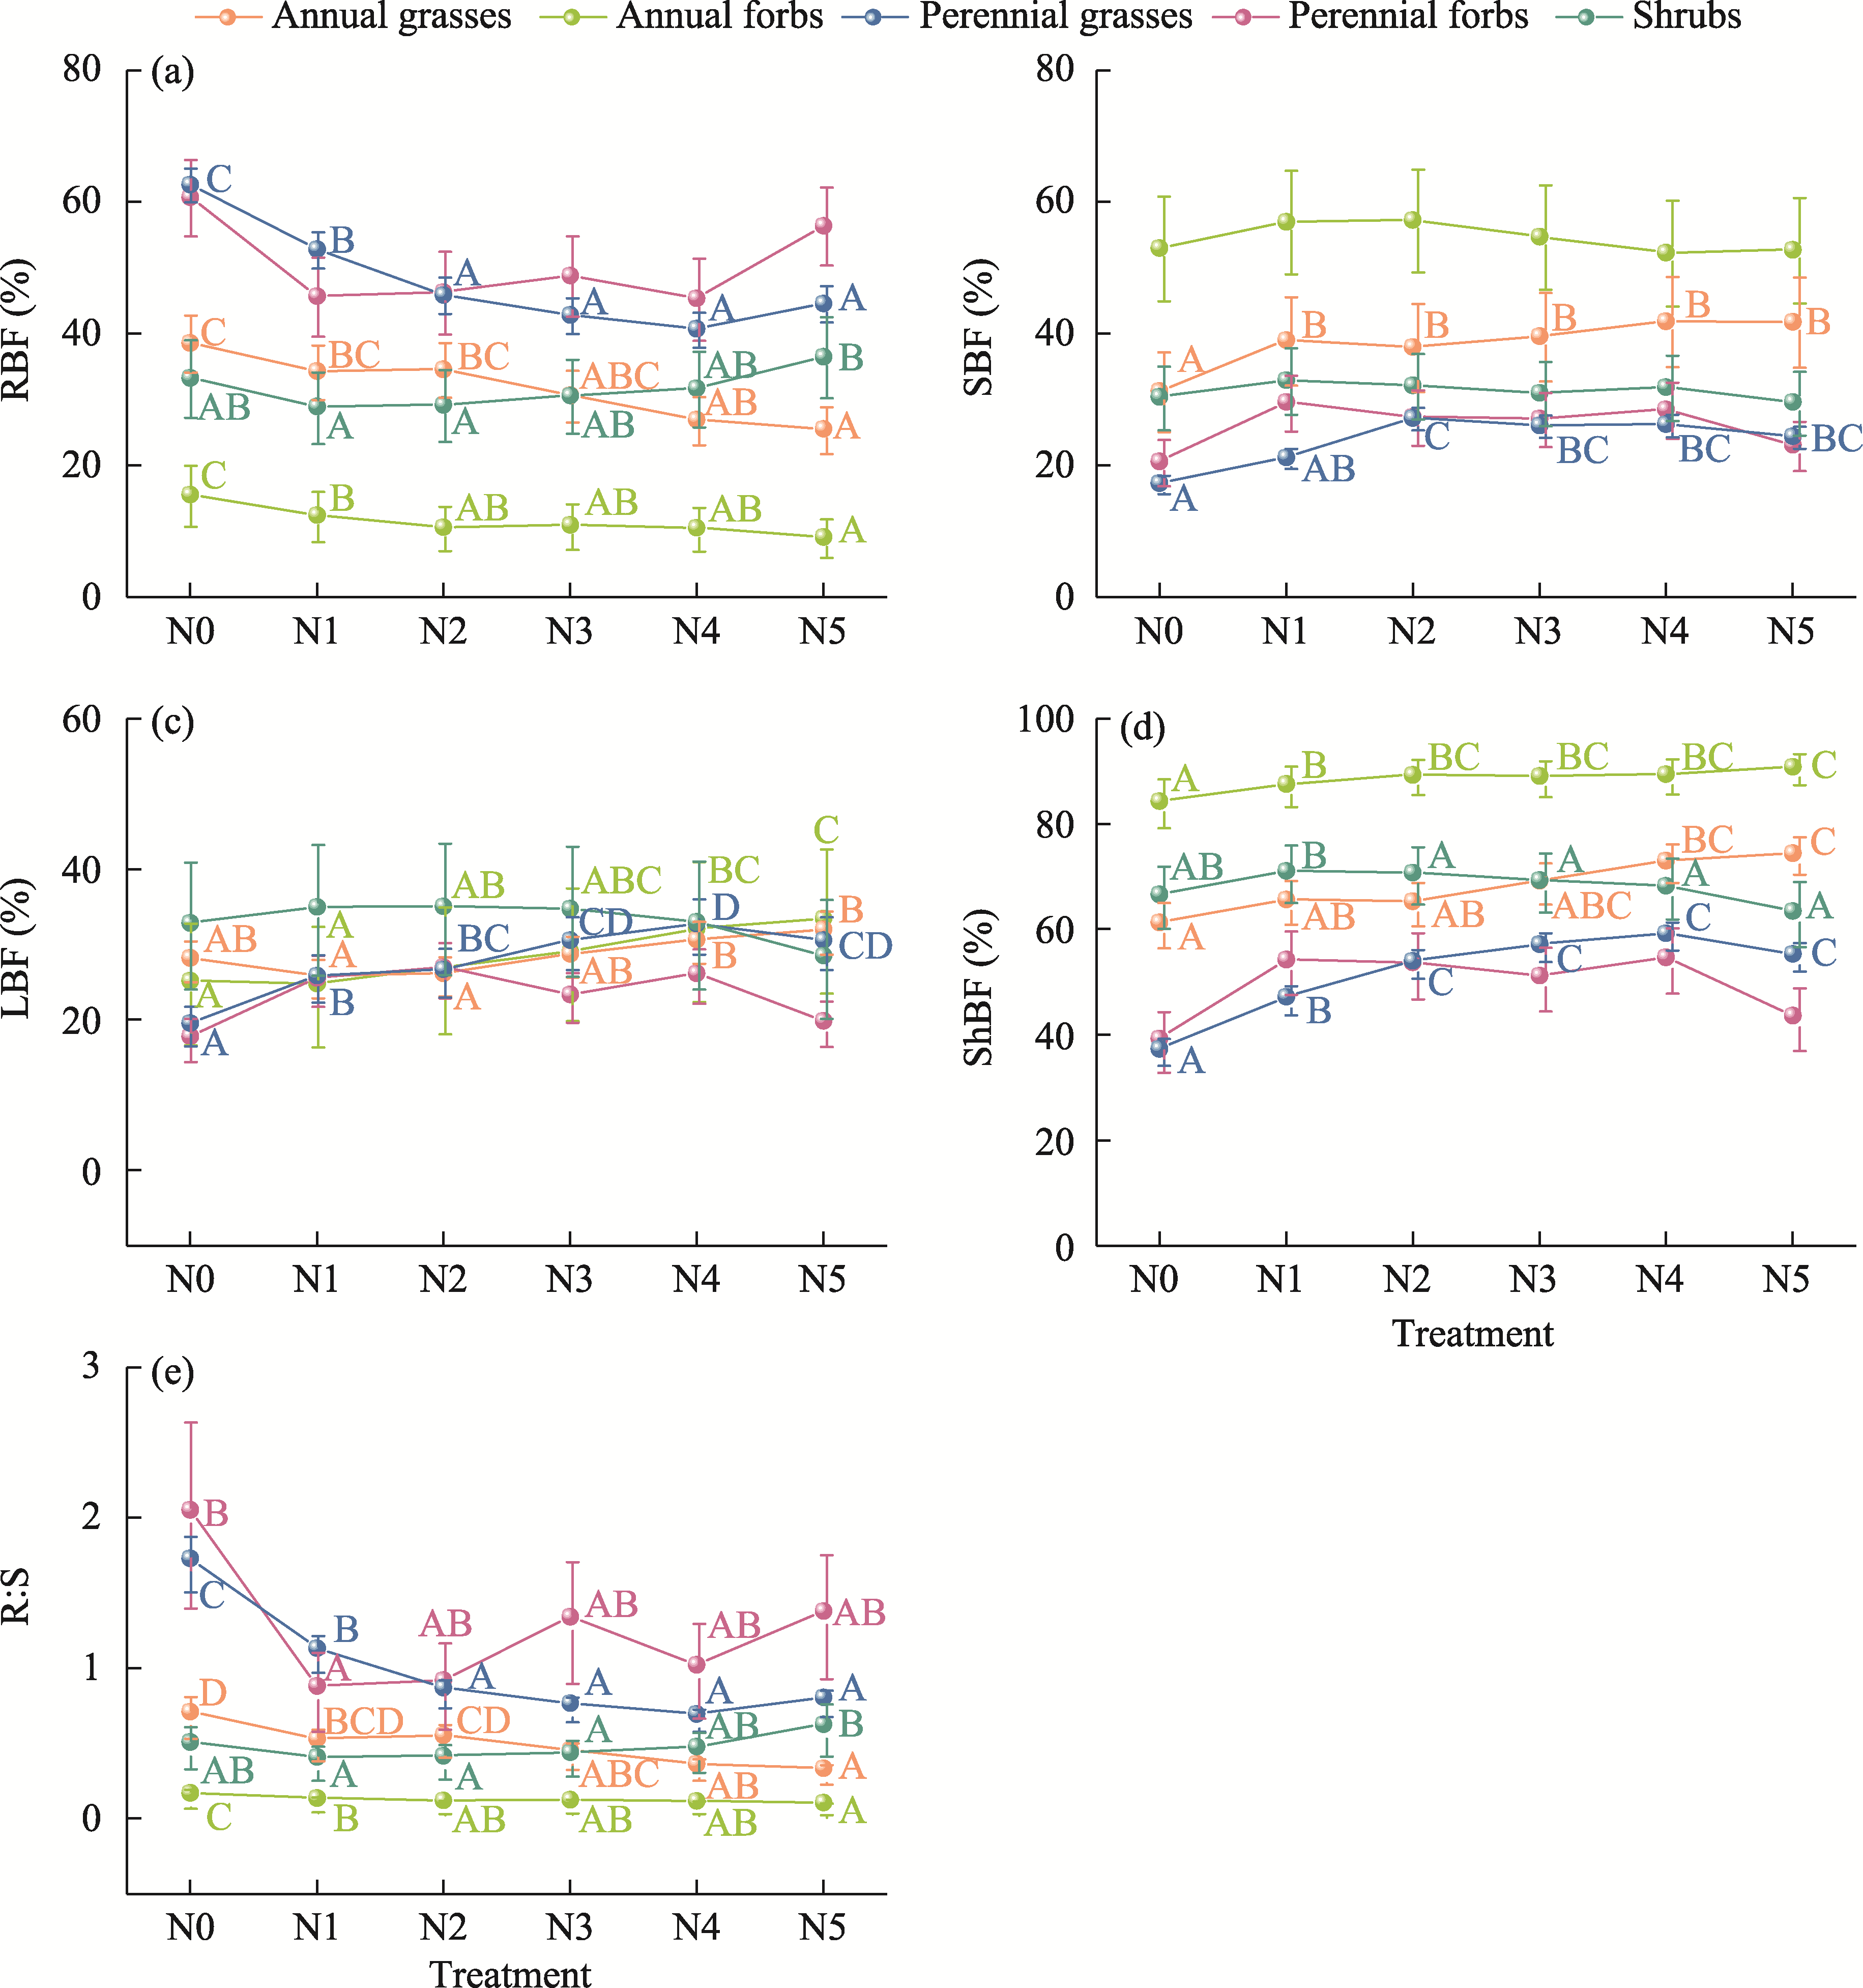
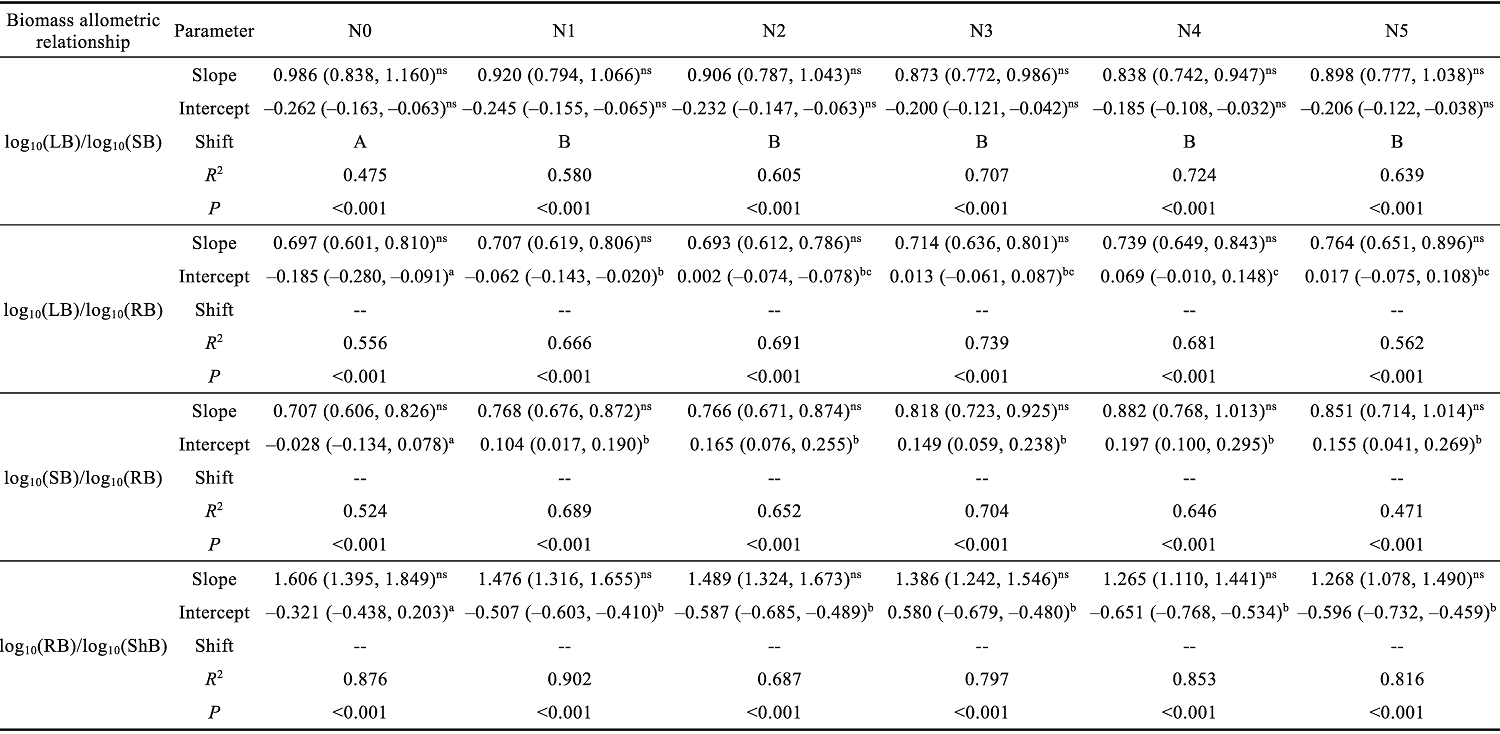
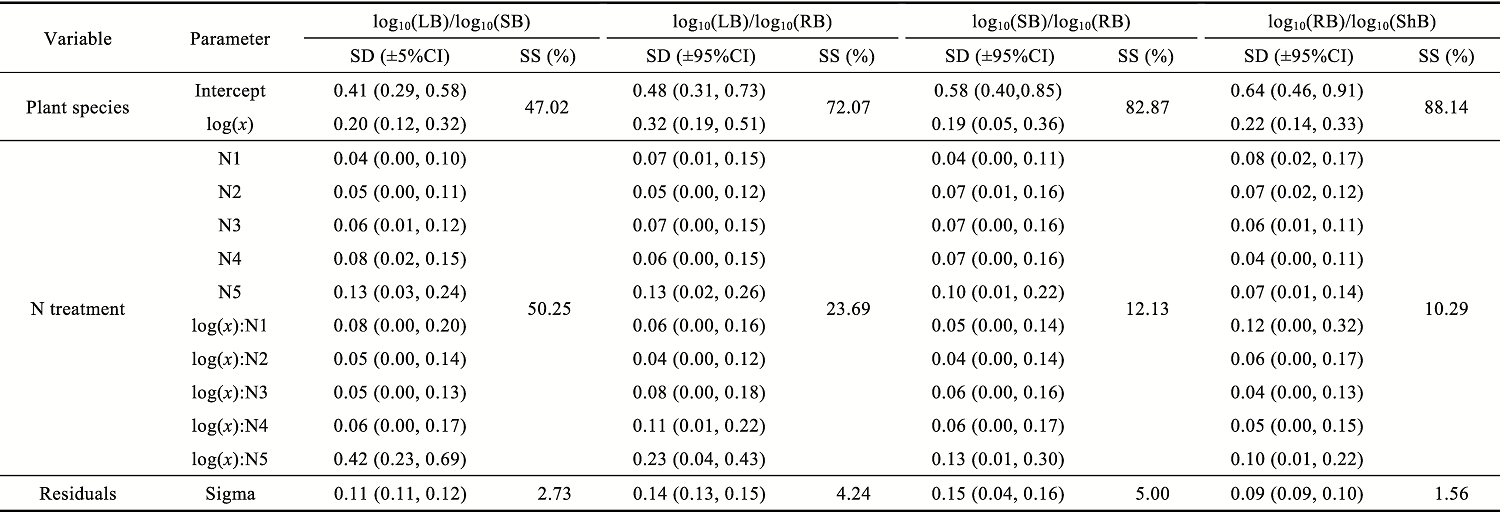
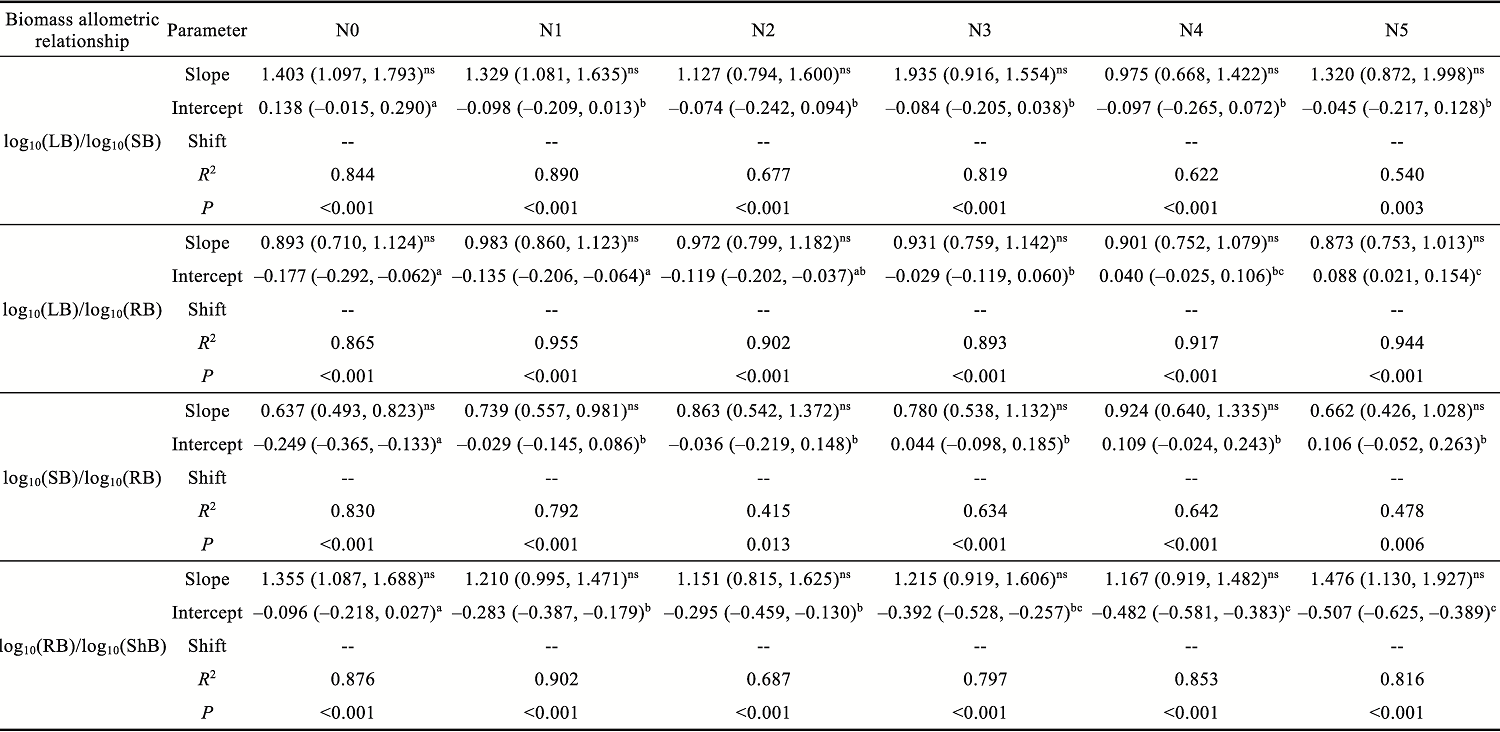
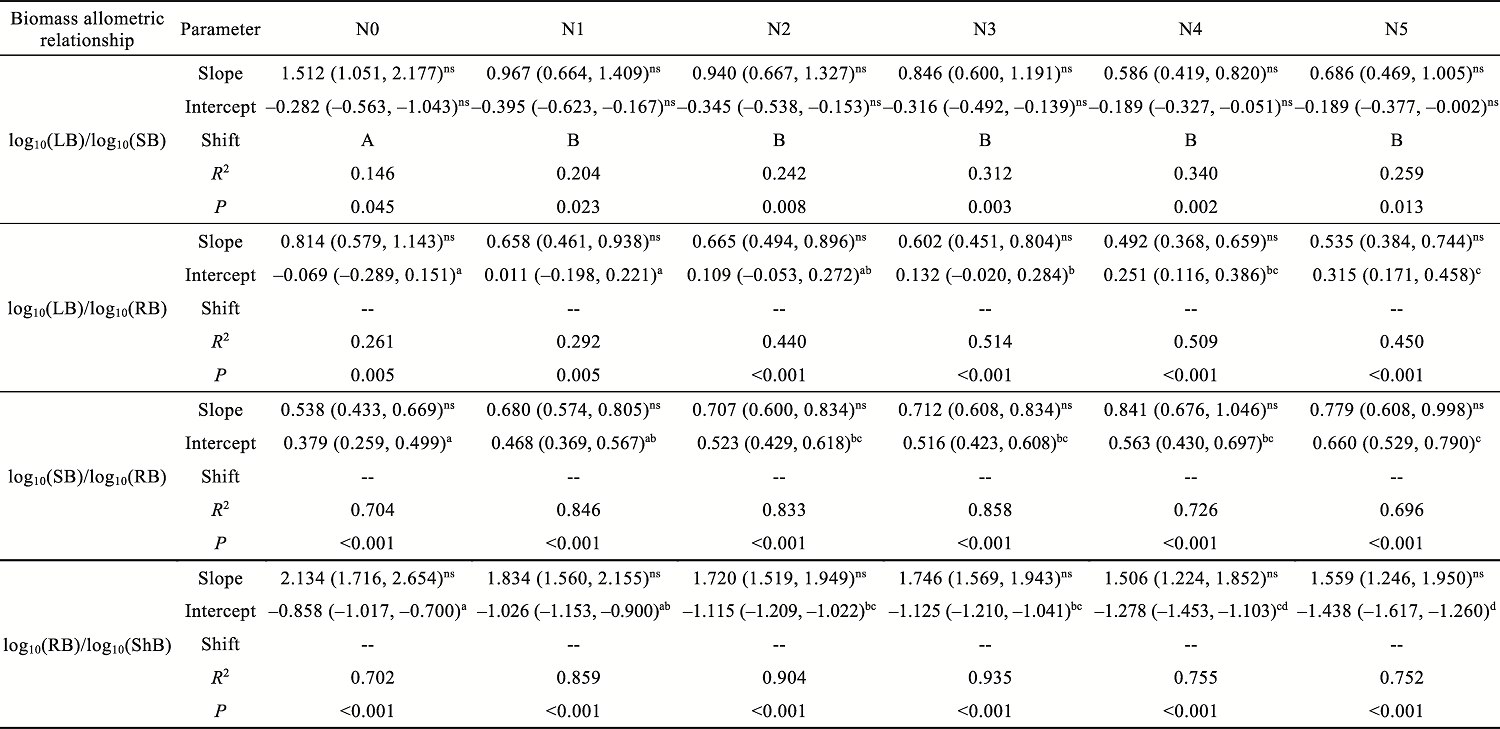
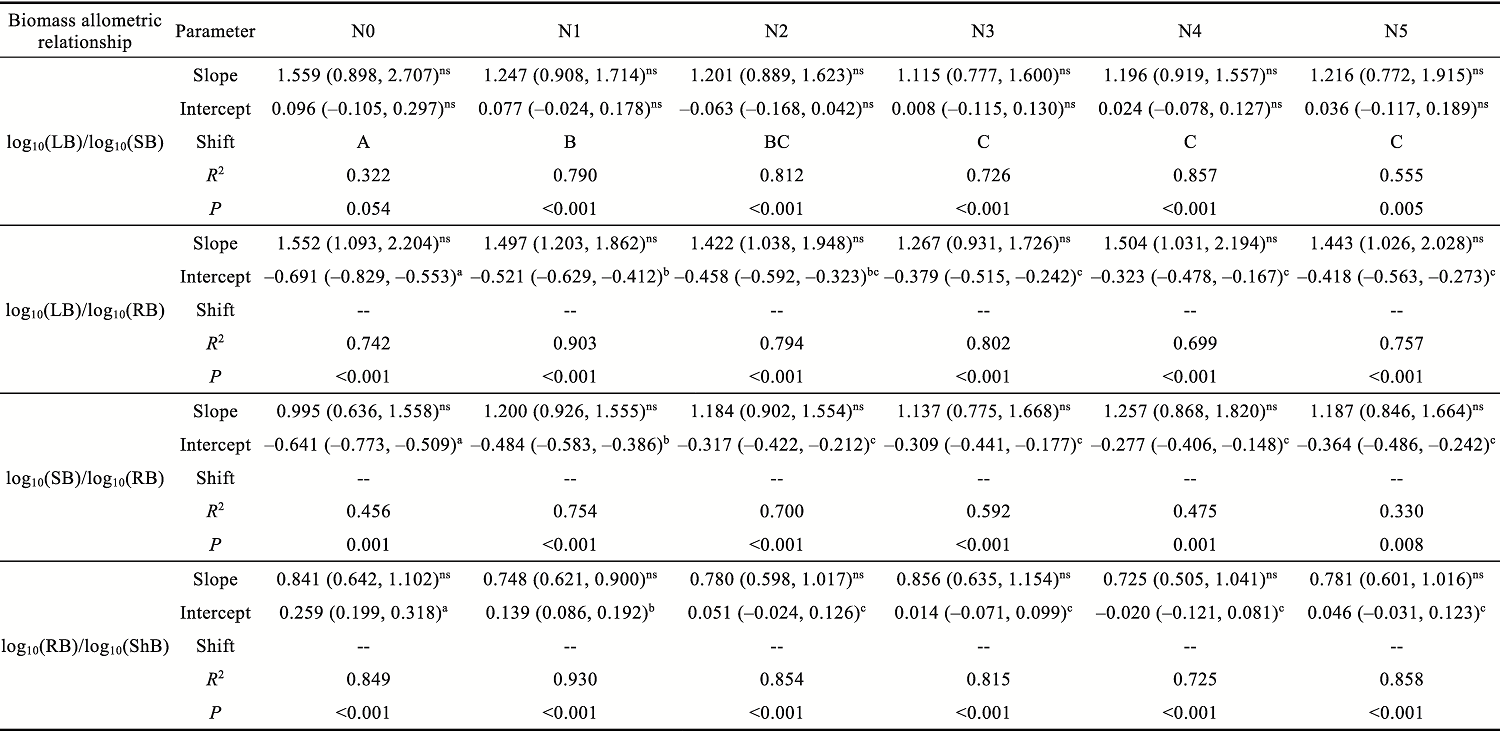
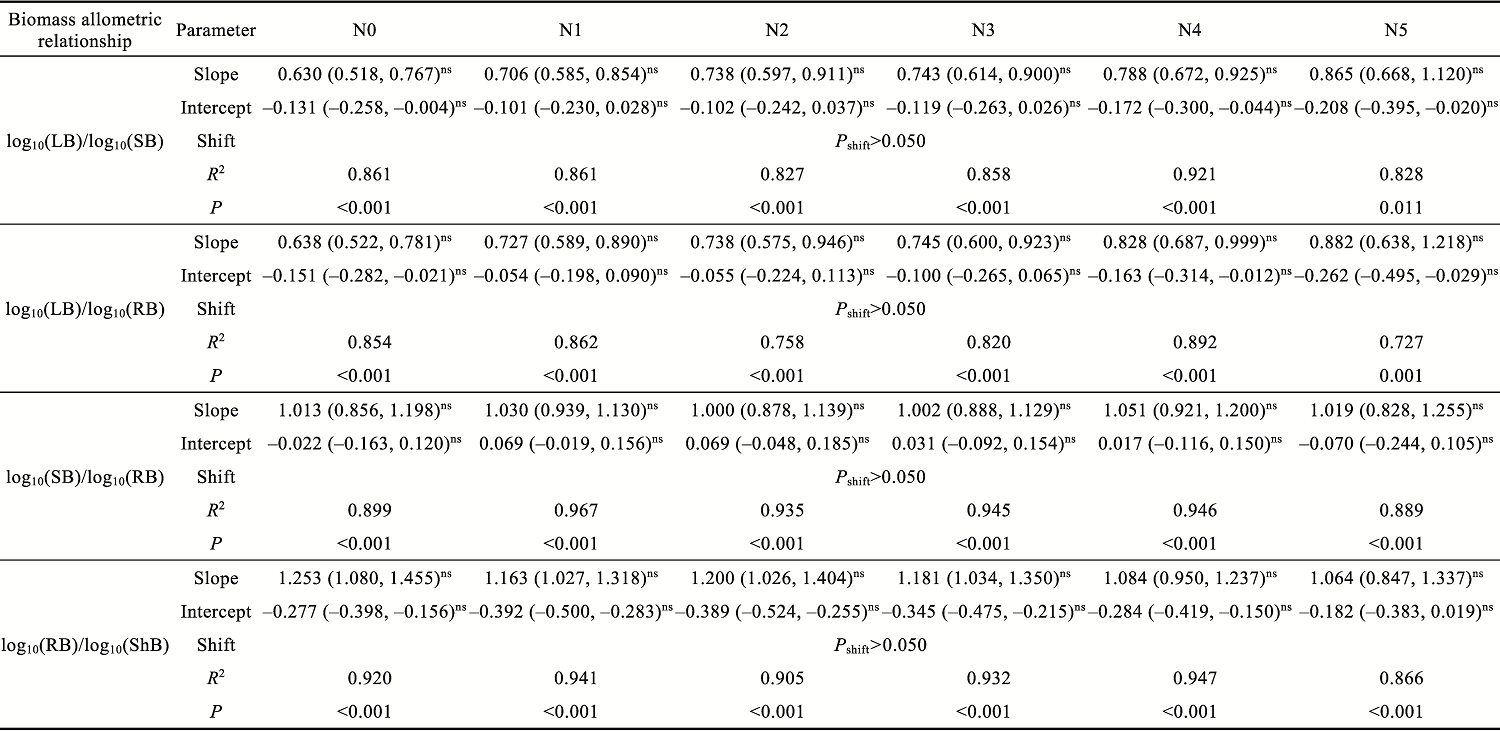
Abstract Understanding how dominant plants respond to nitrogen (N) addition is critical for accurately predicting the potential effects of N deposition on ecosystem structure and functionality. Biomass partitioning serves as a valuable indicator for assessing plant responses to environmental changes. However, considerable uncertainty remains regarding how biomass partitioning shifts with increasing N inputs in sandy ecosystems. To address this gap, we conducted a greenhouse N fertilization experiment in April 2024, using seeds from 20 dominant plant species in the Horqin Sandy Land of China representing 5 life forms: annual grasses, annual forbs, perennial grasses, perennial forbs, and shrubs. Six levels of N addition (0.0, 3.5, 7.0, 14.0, 21.0, and 49.0 g N/(m2•a), referred to as N0, N1, N2, N3, N4, and N5, respectively) were applied to investigate the effects of N inputs on biomass partitioning. Results showed that for all 20 dominant plant species, the root biomass:shoot biomass (R:S) consistently declined across all N addition treatments (P<0.050). Concurrently, N addition led to a 23.60% reduction in root biomass fraction, coupled with a 12.38% increase in shoot biomass fraction (P<0.050). Allometric partitioning analysis further indicated that N addition had no significant effect on the slopes of the allometric relationships (leaf biomass versus root biomass, stem biomass versus root biomass, and shoot biomass versus root biomass). This suggests that plants can adjust resource investment—such as allocating more resources to shoots—to optimize growth under favorable conditions without disrupting functional trade-offs between organs. Among different life forms, annual grasses, perennial grasses, and annual forbs exhibited increased allocation to aboveground biomass, enhancing productivity and potentially altering community composition and competitive hierarchies. In contrast, perennial forbs and shrubs maintained stable biomass partitioning across all N addition levels, reflecting conservative resource allocation strategies that support long-term ecosystem resilience in nutrient-poor environments. Taken together, these findings deepen our understanding of how nutrient enrichment influences biomass allocation and ecosystem dynamics across different plant life forms, offering practical implications for the management and restoration of degraded sandy ecosystems.
|
|
Received: 29 December 2024
Published: 31 August 2025
|
|
Corresponding Authors:
*LI Yulin (E-mail: liyl@lzb.ac.cn)
|
|
|
| [1] |
Bloom A J, Chapin F S, Mooney H A. 1985. Resource limitation in plants—An economic analogy. Annual Review of Ecology and Systematics, 16: 363-392.
|
|
|
| [2] |
Bobbink R, Hicks K, Galloway J, et al. 2010. Global assessment of nitrogen deposition effects on terrestrial plant diversity: A synthesis. Ecological Applications, 20(1): 30-59.
pmid: 20349829
|
|
|
| [3] |
Brown C J, Schoeman D S, Sydeman W J, et al. 2011. Quantitative approaches in climate change ecology. Global Change Biology, 17(12): 3697-3713.
|
|
|
| [4] |
Cahill J F, Casper B B. 2000. Investigating the relationship between neighbor root biomass and belowground competition: field evidence for symmetric competition belowground. Oikos, 90(2): 311-320.
|
|
|
| [5] |
Calderon K, Philippot L, Bizouard F, et al. 2018. Compounded disturbance chronology modulates the resilience of soil microbial communities and N-cycle related functions. Frontiers in Microbiology, 9: 2721, doi: 10.3389/fmicb.2018.02721.
pmid: 30459749
|
|
|
| [6] |
Chapin F S. 1980. The mineral-nutrition of wild plants. Annual Review of Ecology and Systematics, 11: 233-260.
|
|
|
| [7] |
Chapin F S, Bloom A J, Field C, et al. 1987. Plant responses to multiple environmental factors. Bioscience, 37(1): 49-57.
|
|
|
| [8] |
Craine J M, Tilman D, Wedin D, et al. 2002. Functional traits, productivity and effects on nitrogen cycling of 33 grassland species. Functional Ecology, 16(5): 563-574.
|
|
|
| [9] |
Craine J M, Dybzinski R. 2013. Mechanisms of plant competition for nutrients, water and light. Functional Ecology, 27(4): 833-840.
|
|
|
| [10] |
Cronin G, Lodge D M. 2003. Effects of light and nutrient availability on the growth, allocation, carbon/nitrogen balance, phenolic chemistry, and resistance to herbivory of two freshwater macrophytes. Oecologia, 137(1): 32-41.
pmid: 12820064
|
|
|
| [11] |
Enquist B J, Niklas K J. 2002. Global allocation rules for patterns of biomass partitioning in seed plants. Science, 295(5559): 1517-1520.
pmid: 11859193
|
|
|
| [12] |
Enquist B J, Norberg J, Bonser S P, et al. 2015. Scaling from traits to ecosystems: Developing a general trait driver theory via integrating trait-based and metabolic scaling theories. Advances in Ecological Research, 52: 249-318.
|
|
|
| [13] |
Eziz A, Yan Z, Tian D, et al. 2017. Drought effect on plant biomass allocation: A meta-analysis. Ecology and Evolution, 7: 11002-11010.
doi: 10.1002/ece3.3630
pmid: 29299276
|
|
|
| [14] |
Fay P A, Prober S M, Harpole W S, et al. 2015. Grassland productivity limited by multiple nutrients. Nature Plants, 1: 15080, doi: 10.1038/nplants.2015.80.
|
|
|
| [15] |
Feng H L, Guo J H, Peng C H, et al. 2023. Nitrogen addition promotes terrestrial plants to allocate more biomass to aboveground organs: A global meta-analysis. Global Change Biology, 29(14): 3970-3989.
doi: 10.1111/gcb.16731
pmid: 37078965
|
|
|
| [16] |
Fortunel C, Violle C, Roumet C, et al. 2009. Allocation strategies and seed traits are hardly affected by nitrogen supply in 18 species differing in successional status. Perspectives in Plant Ecology Evolution and Systematics, 11(4): 267-283.
|
|
|
| [17] |
Galloway J N, Townsend A R, Erisman J W, et al. 2008. Transformation of the nitrogen cycle: Recent trends, questions, and potential solutions. Science, 320(5878): 889-892.
doi: 10.1126/science.1136674
pmid: 18487183
|
|
|
| [18] |
Ghimire B, Riley W J, Koven C D, et al. 2016. Representing leaf and root physiological traits in CLM improves global carbon and nitrogen cycling predictions. Journal of Advances in Modeling Earth Systems, 8(2): 598-613.
|
|
|
| [19] |
Grechi I, Vivin P, Hilbert G, et al. 2007. Effect of light and nitrogen supply on internal C:N balance and control of root-to-shoot biomass allocation in grapevine. Environmental and Experimental Botany, 59(2): 139-149.
|
|
|
| [20] |
Grime J P. 1977. Evidence for the existence of three primary strategies in plants and its relevance to ecological and evolutionary theory. American Naturalist, 111(982): 1169-1194.
|
|
|
| [21] |
Harpole W S, Ngai J T, Cleland E E, et al. 2011. Nutrient co-limitation of primary producer communities. Ecology Letters, 14(9): 852-862.
doi: 10.1111/j.1461-0248.2011.01651.x
pmid: 21749598
|
|
|
| [22] |
Hautier Y, Zhang P F, Loreau M, et al. 2020. General destabilizing effects of eutrophication on grassland productivity at multiple spatial scales. Nature Communications, 11(1): 5375, doi: 10.1038/s41467-020-19252-4.
pmid: 33097736
|
|
|
| [23] |
Hirose T, Werger M J A. 1995. Canopy structure and photon flux partitioning among species in a herbaceous plant community. Ecology, 76(2): 466-474.
|
|
|
| [24] |
Hodge A. 2004. The plastic plant: root responses to heterogeneous supplies of nutrients. New Phytologist, 162(1): 9-24.
|
|
|
| [25] |
Hu H J, Liu X P, He Y H, et al. 2023. Asymmetric pre-growing season warming may jeopardize seed reproduction of the sand-stabilizing shrub Caragana microphylla. Science of the Total Environment, 903: 166387, doi: 10.1016/j.scitotenv.2023.166387.
|
|
|
| [26] |
Hu K J, Wang W, Qian W, et al. 2025. Responses of biomass and allometric growth equations of juvenile mangrove plants to salinity, flooding, and aboveground competition. Horticulturae, 11(7): 712, doi: 10.3390/horticulturae11070712.
|
|
|
| [27] |
Huang Y X, Zhao X Y, Zhou D W, et al. 2009. Allometry of Salsola collina in response to soil nutrients, water supply and population density. Nordic Journal of Botany, 27(6): 539-547.
|
|
|
| [28] |
Illescas M, Morán-Diez M E, De Alba A E M, et al. 2022. Effect of Trichoderma asperellum on wheat plants' biochemical and molecular responses, and yield under different water stress conditions. International Journal of Molecular Sciences, 23(12): 6782, doi: 10.3390/ijms23126782.
|
|
|
| [29] |
Jiang L M, Sattar K, Lü G H, et al. 2022. Different contributions of plant diversity and soil properties to the community stability in the arid desert ecosystem. Frontiers in Plant Science, 13: 969852, doi: 10.3389/fpls.2022.969852.
|
|
|
| [30] |
Liu D J, Zhang C, Ogaya R, et al. 2025. World-wide impacts of climate change and nitrogen deposition on vegetation structure, composition, and functioning of shrublands. New Phytologist, 247(3): 1117-1128.
|
|
|
| [31] |
Liu X J, Zhang Y, Han W X, et al. 2013. Enhanced nitrogen deposition over China. Nature, 494(7438): 459-462.
|
|
|
| [32] |
Lü C Q, Tian H Q. 2007. Spatial and temporal patterns of nitrogen deposition in China: Synthesis of observational data. Journal of Geophysical Research-Atmospheres, 112(D22), doi: 10.1029/2006JD007990.
|
|
|
| [33] |
Luo X, Mazer S J, Guo H, et al. 2016. Nitrogen: phosphorous supply ratio and allometry in five alpine plant species. Ecology and Evolution, 6(24): 8881-8892.
doi: 10.1002/ece3.2587
pmid: 28035276
|
|
|
| [34] |
Mao W, Allington G, Li Y L, et al. 2012. Life history strategy influences biomass allocation in response to limiting nutrients and water in an arid system. Polish Journal of Ecology, 60(3): 545-557.
|
|
|
| [35] |
Mccarthy M C, Enquist B J. 2007. Consistency between an allometric approach and optimal partitioning theory in global patterns of plant biomass allocation. Functional Ecology, 21(4): 713-720.
|
|
|
| [36] |
Müller I, Schmid B, Weiner J. 2000. The effect of nutrient availability on biomass allocation patterns in 27 species of herbaceous plants. Perspectives in Plant Ecology Evolution and Systematics, 3(2): 115-127.
|
|
|
| [37] |
Muller-Landau H C, Condit R, Thomas S C, et al. 2006. Testing metabolic ecology theory for allometric scaling of tree size, growth and mortality in tropical forests. Ecology Letters, 9(5): 575-588.
pmid: 16643303
|
|
|
| [38] |
Niklas K J. 2007. Plant allometry: Is there a grand unifying theory? Biological Reviews, 79(4): 871-889.
|
|
|
| [39] |
Pierce S, Negreiros D, Cerabolini B E L, et al. 2016. A global method for calculating plant CSR ecological strategies applied across biomes world-wide. Functional Ecology, 31(2): 444-457.
|
|
|
| [40] |
Poorter H, Niklas K J, Reich P B, et al. 2011. Biomass allocation to leaves, stems and roots: meta-analyses of interspecific variation and environmental control. New Phytologist, 193(1): 30-50.
|
|
|
| [41] |
Shipley B, Meziane D. 2002. The balanced-growth hypothesis and the allometry of leaf and root biomass allocation. Functional Ecology, 16(3): 326-331.
|
|
|
| [42] |
Song M H, Zhu J F, Li Y K, et al. 2020. Shifts in functional compositions predict desired multifunctionality along fragmentation intensities in an alpine grassland. Ecological Indicators, 112: 106095, doi: 10.1016/j.ecolind.2020.106095.
|
|
|
| [43] |
Stevens C J, Dise N B, Gowing D J G, et al. 2006. Loss of forb diversity in relation to nitrogen deposition in the UK: Regional trends and potential controls. Global Change Biology, 12(10): 1823-1833.
|
|
|
| [44] |
Suding K N, Collins S L, Gough L, et al. 2005. Functional and abundance-based mechanisms explain diversity loss due to N fertilization. Proceedings of the National Academy of Sciences of the United States of America, 102(12): 4387-4392.
|
|
|
| [45] |
Sun J, Liu B Y, You Y, et al. 2019. Solar radiation regulates the leaf nitrogen and phosphorus stoichiometry across alpine meadows of the Tibetan Plateau. Agricultural and Forest Meteorology, 271: 92-101.
|
|
|
| [46] |
Sutardi, Kristamtini, Purwaningsih H, et al. 2022. Nutrient management of shallot farming in sandy loam soil in Tegalrejo, Gunungkidul, Indonesia. Sustainability, 14(19): 11862, doi: 10.3390/su141911862.
|
|
|
| [47] |
Takashima T, Hikosaka K, Hirose T. 2004. Photosynthesis or persistence: nitrogen allocation in leaves of evergreen and deciduous Quercus species. Plant Cell and Environment, 27(8): 1047-1054.
|
|
|
| [48] |
Tammeorg P, Simojoki A, Mäkelä P, et al. 2014. Short-term effects of biochar on soil properties and wheat yield formation with meat bone meal and inorganic fertiliser on a boreal loamy sand. Agriculture Ecosystems & Environment, 191: 108-116.
|
|
|
| [49] |
Tian Q Y, Liu N N, Bai W M, et al. 2016. A novel soil manganese mechanism drives plant species loss with increased nitrogen deposition in a temperate steppe. Ecology, 97(1): 65-74.
pmid: 27008776
|
|
|
| [50] |
Tilman D. 1987. Secondary succession and the pattern of plant dominance along experimental nitrogen gradients. Ecological Monographs, 57(3): 189-214.
|
|
|
| [51] |
Vanninen P, Mäkelä A. 2005. Carbon budget for Scots pine trees: effects of size, competition and site fertility on growth allocation and production. Tree Physiology, 25(11): 17-30.
|
|
|
| [52] |
Waite M, Sack L. 2010. How does moss photosynthesis relate to leaf and canopy structure? Trait relationships for 10 Hawaiian species of contrasting light habitats. New Phytologist, 185(1): 156-172.
doi: 10.1111/j.1469-8137.2009.03061.x
pmid: 19863726
|
|
|
| [53] |
Warton D I, Wright I J, Falster D S, et al. 2006. Bivariate line-fitting methods for allometry. Biological Reviews, 81(2): 259-291.
doi: 10.1017/S1464793106007007
pmid: 16573844
|
|
|
| [54] |
Weiner J. 2004. Allocation, plasticity and allometry in plants. Perspectives in Plant Ecology Evolution and Systematics, 6(4): 207-215.
|
|
|
| [55] |
West G B, Brown J H, Enquist B J. 1999. The fourth dimension of life: Fractal geometry and allometric scaling of organisms. Science, 284(5420): 1677-1679.
doi: 10.1126/science.284.5420.1677
pmid: 10356399
|
|
|
| [56] |
Westoby M, Falster D S, Moles A T, et al. 2002. Plant ecological strategies: Some leading dimensions of variation between species. Annual Review of Ecology and Systematics, 33: 125-159.
|
|
|
| [57] |
Wu B, Han H Y, He J, et al. 2014. Field-specific calibration and evaluation of ECH2O EC-5 sensor for sandy soils. Soil Science Society of America Journal, 78(1): 70-78.
|
|
|
| [58] |
Xia J Y, Wan S Q. 2008. Global response patterns of terrestrial plant species to nitrogen addition. New Phytologist, 179(2): 428-439.
doi: 10.1111/j.1469-8137.2008.02488.x
pmid: 19086179
|
|
|
| [59] |
Yan B G, Ji Z H, Fan B, et al. 2016. Plants adapted to nutrient limitation allocate less biomass into stems in an arid-hot grassland. New Phytologist, 211(4): 1232-1240.
doi: 10.1111/nph.13970
pmid: 27101947
|
|
|
| [60] |
Yan Z B, Eziz A, Tian D, et al. 2019. Biomass allocation in response to nitrogen and phosphorus availability: Insight from experimental manipulations of Arabidopsis thaliana. Frontiers in Plant Science, 10: 598, doi: 10.3389/fpls.2019.00598.
|
|
|
| [61] |
Yang H L, Cheng L, Che L, et al. 2024. Nutrients addition decreases soil fungal diversity and alters fungal guilds and co-occurrence networks in a semi-arid grassland in northern China. Science of the Total Environment, 926: 172100, doi: 10.1016/j.scitotenv.2024.172100.
|
|
|
| [62] |
Yang Y, Luo Y. 2011. Isometric biomass partitioning pattern in forest ecosystems: evidence from temporal observations during stand development. Journal of Ecology, 99(2): 431-437.
|
|
|
| [63] |
Yin Q L, Tian T T, Han X H, et al. 2019. The relationships between biomass allocation and plant functional trait. Ecological Indicators, 102: 302-308.
doi: 10.1016/j.ecolind.2019.02.047
|
|
|
| [64] |
Yue K, Fornara D A, Li W, et al. 2020. Nitrogen addition affects plant biomass allocation but not allometric relationships among different organs across the globe. Journal of Plant Ecology, 14(3): 361-371.
|
|
|
|
Viewed |
|
|
|
Full text
|
|
|
|
|
Abstract
|
|
|
|
|
Cited |
|
|
|
|
| |
Shared |
|
|
|
|
| |
Discussed |
|
|
|
|