| Research article |
|


|
|
|
| Trade-off and synergy effects, driving factors, and spatial optimization of ecosystem services in the Wuding River Basin of China: A study based on the Bayesian Belief Network approach |
FAN Liangwei1, WANG Ni1,2,*( ), WANG Tingting1, LIU Zheng1, WAN Yong1, LI Zhiwei1 ), WANG Tingting1, LIU Zheng1, WAN Yong1, LI Zhiwei1 |
1College of Water Resources and Hydropower, Xi'an University of Technology, Xi'an 710048, China
2State Key Laboratory of Water Engineering Ecology and Environment in Arid Area, Xi'an University of Technology, Xi'an 710048, China |
|
|
|
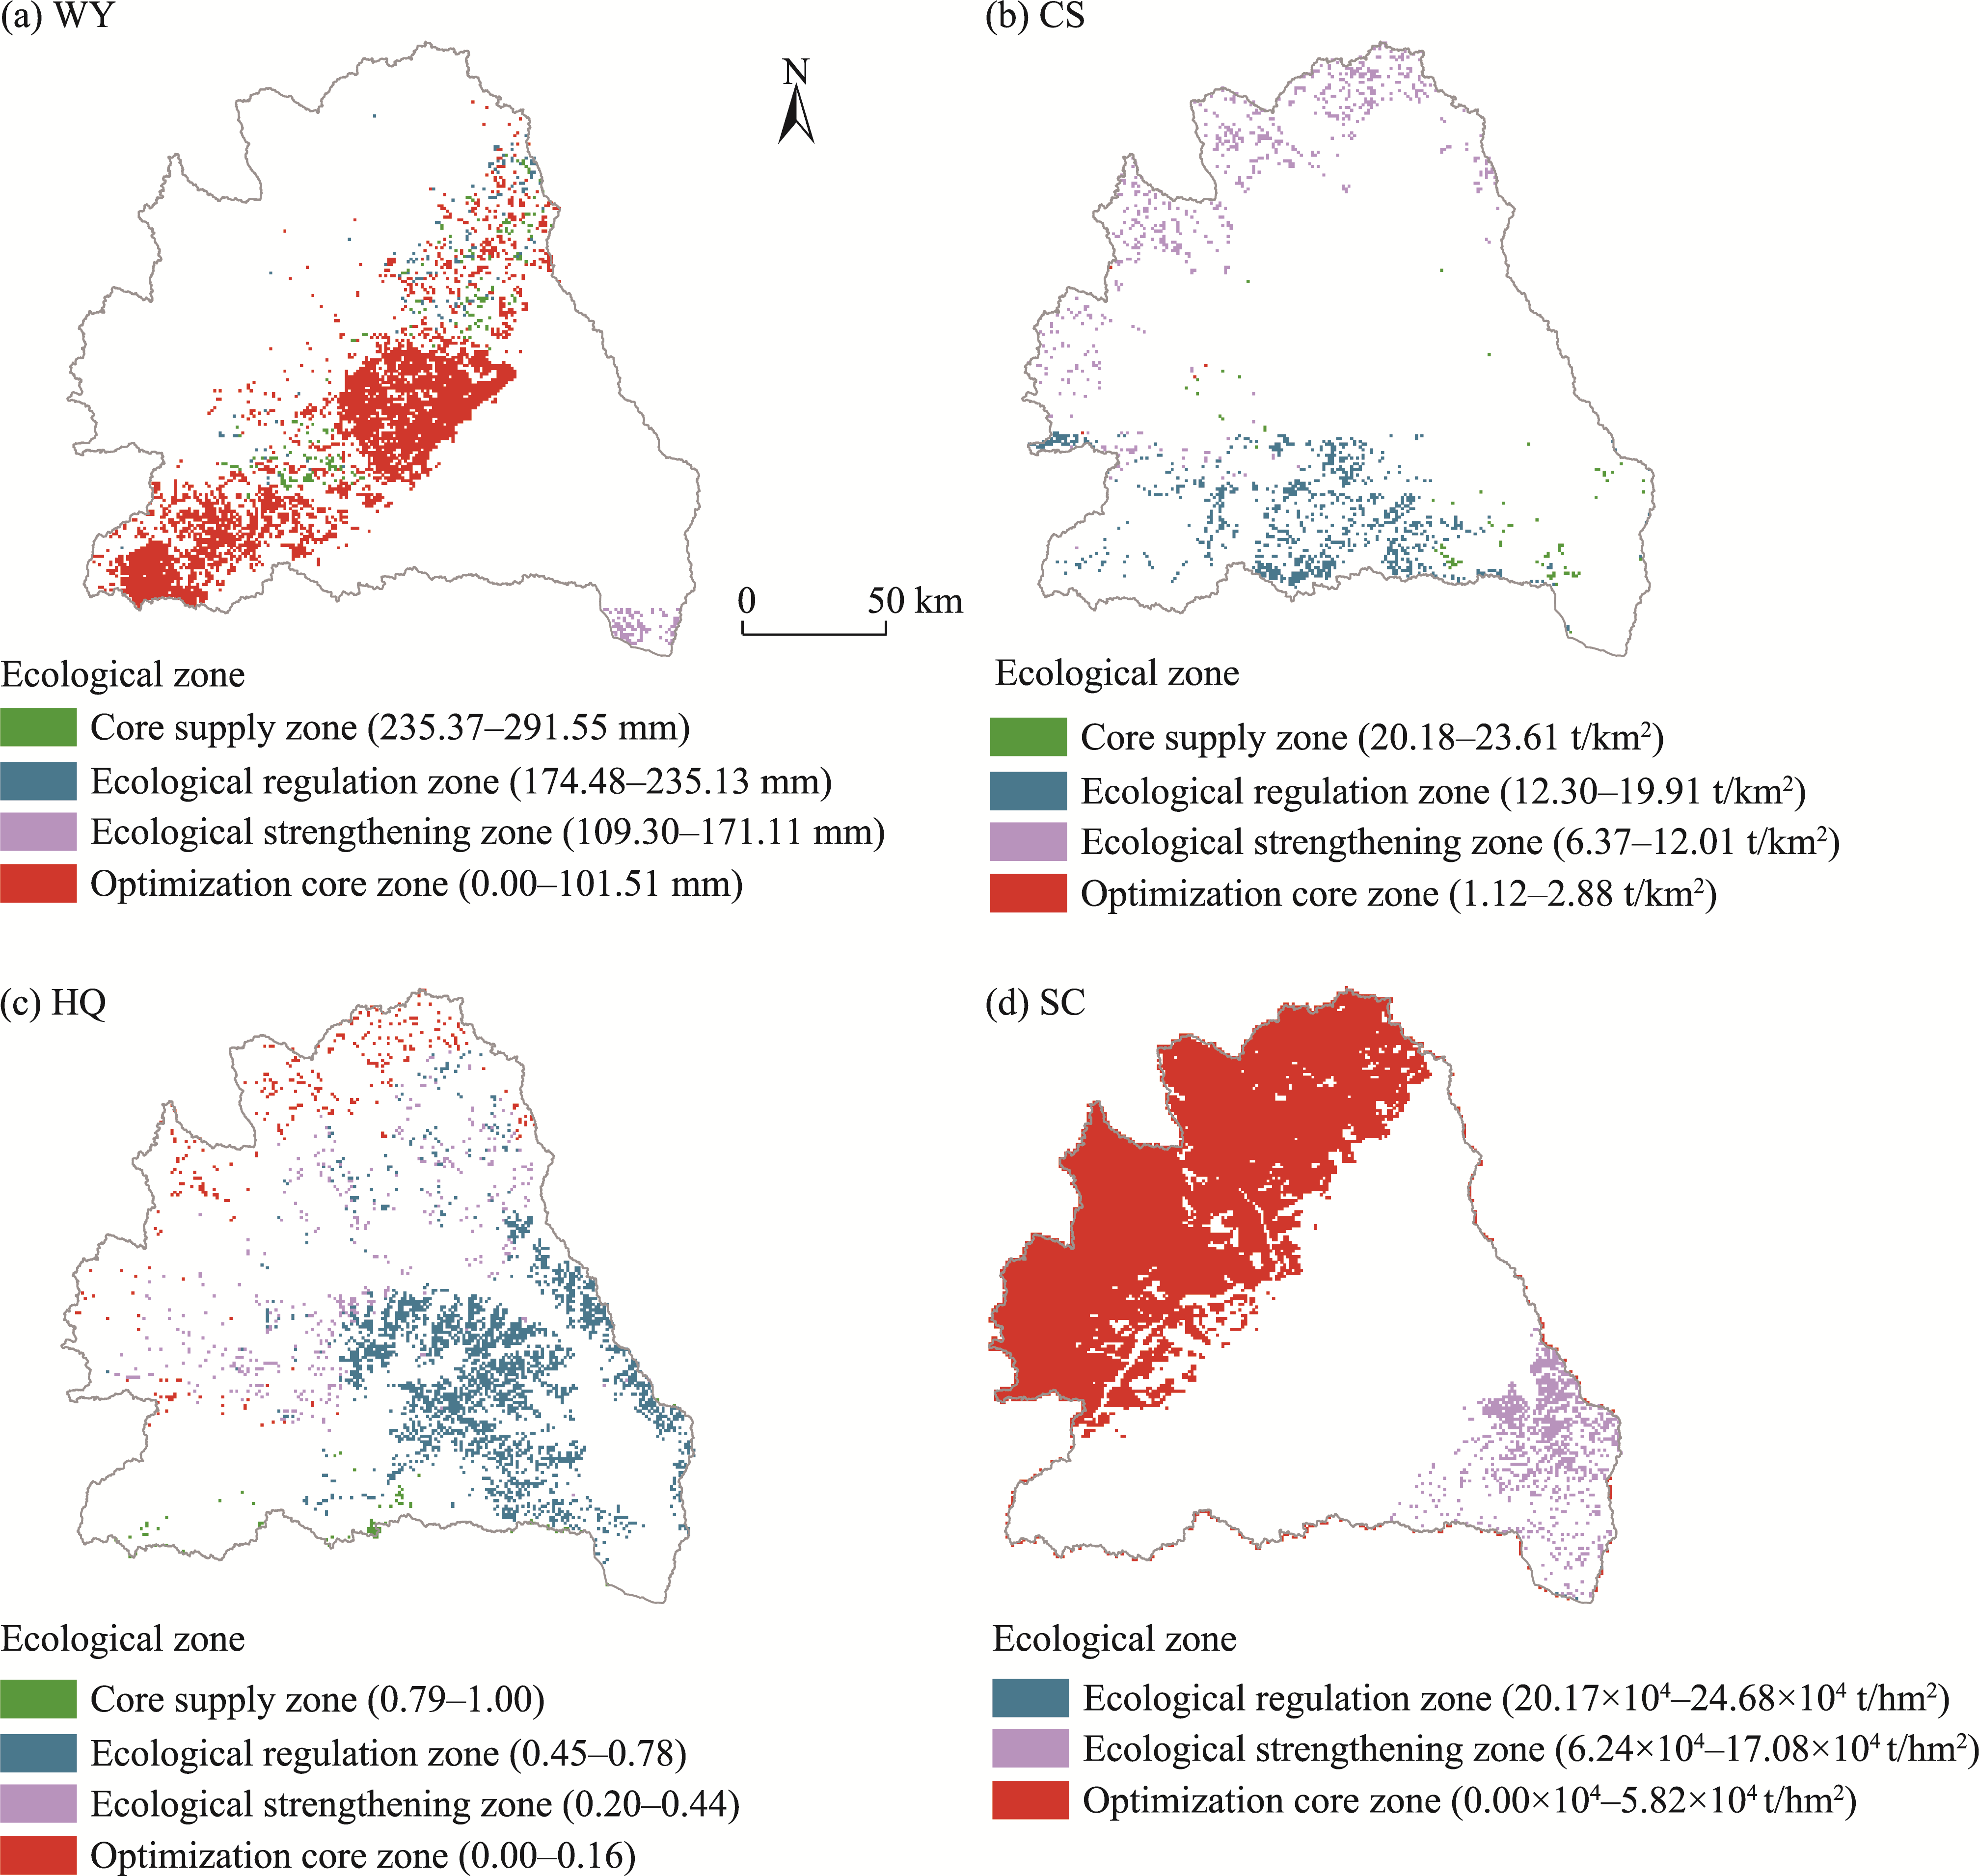
Abstract The Wuding River Basin, situated in the Loess Plateau of northern China, is an ecologically fragile region facing severe soil erosion and imbalanced ecosystem service (ES) functions. However, the mechanisms driving the spatiotemporal evolution of ES functions, as well as the trade-offs and synergies among these functions, remain poorly understood, constraining effective watershed-scale management. To address this challenge, this study quantified four ES functions, i.e., water yield (WY), carbon storage (CS), habitat quality (HQ), and soil conservation (SC) in the Wuding River Basin from 1990 to 2020 using the Integrated Valuation of Ecosystem Services and Tradeoff (InVEST) model, and proposed an innovative integration of InVEST with a Bayesian Belief Network (BBN) to nonlinearly identify trade-off and synergy relationships among ES functions through probabilistic inference. A trade-off and synergy index (TSI) was developed to assess the spatial interaction intensity among ES functions, while sensitivity and scenario analyses were employed to determine key driving factors, followed by spatial optimization to delineate functional zones. Results revealed distinct spatiotemporal variations: WY increased from 98.69 to 120.52 mm; SC rose to an average of 3.05×10⁴ t/hm2; CS remained relatively stable (about 15.50 t/km2); and HQ averaged 0.51 with localized declines. The BBN achieved a high accuracy of 81.9% and effectively identified strong synergies between WY and SC, as well as between CS and HQ, while clear trade-offs were observed between WY and SC versus CS and HQ. Sensitivity analysis indicated precipitation (variance reduction of 9.4%), land use (9.8%), and vegetation cover (9.1%) as key driving factors. Spatial optimization further showed that core supply and ecological regulation zones are concentrated in the central-southern and southeastern basin, while ecological strengthening and optimization core zones dominate the central-northern and southeastern margins, highlighting strong spatial heterogeneity. Overall, this study advances ES research by combining process-based quantification with probabilistic modeling, offering a robust framework for studying nonlinear interactions, driving mechanisms, and optimization strategies, and providing a transferable paradigm for watershed-scale ES management and ecological planning in arid and semi-arid areas.
|
|
Received: 28 May 2025
Published: 31 December 2025
|
|
Corresponding Authors:
*WANG Ni (E-mail: wangni@xaut.edu.cn)
|
|
|
| [1] |
Agudelo C A R, Bustos S L H, Moreno C A P. 2020. Modeling interactions among multiple ecosystem services. A critical review. Ecological Modelling, 429: 109103, doi:10.1016/j.ecolmodel.2020.109103.
|
|
|
| [2] |
Bennett E M, Cramer W, Begossi A, et al. 2015. Linking biodiversity, ecosystem services, and human well-being: three challenges for designing research for sustainability. Current Opinion in Environmental Sustainability, 14: 76-85.
doi: 10.1016/j.cosust.2015.03.007
|
|
|
| [3] |
Chen S, Li G, Zhuo Y F, et al. 2022a. Trade-offs and synergies of ecosystem services in the Yangtze River Delta, China: response to urbanizing variation. Urban Ecosystems, 25(1): 313-328.
doi: 10.1007/s11252-021-01150-2
|
|
|
| [4] |
Chen Y, Zhang P, Zhao Y, et al. 2022b. Factors affecting runoff and sediment load changes in the Wuding River Basin from 1960 to 2020. Hydrology, 9(11): 198, doi:10.3390/hydrology9110198.
|
|
|
| [5] |
Costanza R, de Groot R, Braat L, et al. 2017. Twenty years of ecosystem services: How far have we come and how far do we still need to go? Ecosystem Services, 28: 1-16.
doi: 10.1016/j.ecoser.2017.09.008
|
|
|
| [6] |
Dai L, Wang Z J. 2023. Construction and optimization strategy of ecological security pattern based on ecosystem services and landscape connectivity: a case study of Guizhou Province, China. Environmental Science and Pollution Research, 30(15): 45123-45139.
doi: 10.1007/s11356-023-25417-7
|
|
|
| [7] |
Du J L, Gong Y, Xi X, et al. 2024. The study on the spatiotemporal changes in tradeoffs and synergies of ecosystem services and response to land use/land cover changes in the region around Taihu Lake. Heliyon, 10(13), doi:10.1016/j.heliyon.2024.e33375.
|
|
|
| [8] |
Feitosa T B, Fernandes M M, Santos C A G, et al. 2023. Assessing economic and ecological impacts of carbon stock and land use changes in Brazil's Amazon Forest: A 2050 projection. Sustainable Production and Consumption, 41: 64-74.
doi: 10.1016/j.spc.2023.07.009
|
|
|
| [9] |
Forio M A E, Villa-Cox G, Van Echelpoel W, et al. 2020. Bayesian Belief Network models as trade-off tools of ecosystem services in the Guayas River Basin in Ecuador. Ecosystem Services, 44: 101124, doi:10.1016/j.ecoser.2020.101124.
|
|
|
| [10] |
Frizzle C, Fournier R A, Trudel M, et al. 2022. Towards sustainable forestry: Using a spatial Bayesian belief network to quantify trade-offs among forest-related ecosystem services. Journal of Environmental Management, 301: 113817, doi:10.1016/j.jenvman.2021.113817.
|
|
|
| [11] |
Geng W L, Li Y Y, Zhang P Y, et al. 2022. Analyzing spatio-temporal changes and trade-offs/synergies among ecosystem services in the Yellow River Basin, China. Ecological Indicators, 138: 108825, doi:10.1016/j.ecolind.2022.108825.
|
|
|
| [12] |
He Z Q, Shang X, Zhang T H, et al. 2022. Coupled regulatory mechanisms and synergy/trade-off strategies of human activity and climate change on ecosystem service value in the loess hilly fragile region of northern Shaanxi, China. Ecological Indicators, 143: 109325, doi:10.1016/j.ecolind.2022.109325.
|
|
|
| [13] |
Huang F X, Zuo L Y, Gao J B, et al. 2023. Exploring the driving factors of trade-offs and synergies among ecological functional zones based on ecosystem service bundles. Ecological Indicators, 146: 109827, doi:10.1016/j.ecolind.2022.109827.
|
|
|
| [14] |
Huang L S, Du Y, Tang Y. 2024a. Ecosystem service trade-offs and synergies and their drivers in severely affected areas of the Wenchuan earthquake, China. Land Degradation & Development, 35(12): 3881-3896.
doi: 10.1002/ldr.v35.12
|
|
|
| [15] |
Huang T T, Liu Y, Wu Z Y, et al. 2024b. Quantitative analysis of runoff alteration based on the Budyko model with time-varying underlying surface parameters for the Wuding River Basin, Loess Plateau. Ecological Indicators, 158: 111377, doi:doi.org/10.1016/j.ecolind.2023.111377.
|
|
|
| [16] |
Karimi J D, Harris J A, Corstanje R. 2021. Using Bayesian Belief Networks to assess the influence of landscape connectivity on ecosystem service trade-offs and synergies in urban landscapes in the UK. Landscape Ecology, 36(11): 3345-3363.
doi: 10.1007/s10980-021-01307-6
|
|
|
| [17] |
Kitson N K, Constantinou A C, Guo Z G, et al. 2023. A survey of Bayesian Network structure learning. Artificial Intelligence Review, 56(8): 8721-8814.
doi: 10.1007/s10462-022-10351-w
|
|
|
| [18] |
Landuyt D, Broekx S, D'Hondt R, et al. 2013. A review of Bayesian belief networks in ecosystem service modelling. Environmental Modelling & Software, 46: 1-11.
|
|
|
| [19] |
Lee H, Lautenbach S. 2016. A quantitative review of relationships between ecosystem services. Ecological Indicators, 66: 340-351.
doi: 10.1016/j.ecolind.2016.02.004
|
|
|
| [20] |
Li B Y, Wang W. 2018. Trade-offs and synergies in ecosystem services for the Yinchuan Basin in China. Ecological Indicators, 84: 837-846.
doi: 10.1016/j.ecolind.2017.10.001
|
|
|
| [21] |
Liang Y J, Hashimoto S, Liu L J. 2021. Integrated assessment of land-use/land-cover dynamics on carbon storage services in the Loess Plateau of China from 1995 to 2050. Ecological Indicators, 120: 106939, doi:10.1016/j.ecolind.2020.106939.
|
|
|
| [22] |
Liu J M, Pei X T, Zhu W Y, et al. 2023a. Scenario modeling of ecosystem service trade-offs and bundles in a semi-arid valley basin. Science of the Total Environment, 896: 166413, doi:10.1016/j.scitotenv.2023.166413.
|
|
|
| [23] |
Liu W, Zhan J Y, Zhao F, et al. 2022. Spatio-temporal variations of ecosystem services and their drivers in the Pearl River Delta, China. Journal of Cleaner Production, 337: 130466, doi:10.1016/j.jclepro.2022.130466.
|
|
|
| [24] |
Liu Y, Yuan X L, Li J X, et al. 2023b. Trade-offs and synergistic relationships of ecosystem services under land use change in Xinjiang from 1990 to 2020: A Bayesian network analysis. Science of the Total Environment, 858: 160015, doi:10.1016/j.scitotenv.2022.160015.
|
|
|
| [25] |
Lyu R F, Zhao W P, Pang J L, et al. 2022. Towards a sustainable nature reserve management: Using Bayesian network to quantify the threat of disturbance to ecosystem services. Ecosystem Services, 58: 101483, doi:10.1016/j.ecoser.2022.101483.
|
|
|
| [26] |
Mach M E, Martone R G, Chan K M A. 2015. Human impacts and ecosystem services: Insufficient research for trade-off evaluation. Ecosystem Services, 16: 112-120.
doi: 10.1016/j.ecoser.2015.10.018
|
|
|
| [27] |
Mao B N, Wang X, Liao Z M, et al. 2023. Spatiotemporal variations and tradeoff-synergy relations of ecosystem services under ecological water replenishment in Baiyangdian Lake, North China. Journal of Environmental Management, 343: 118229, doi:10.1016/j.jenvman.2023.118229.
|
|
|
| [28] |
Marcot B G, Penman T D. 2019. Advances in Bayesian network modelling: Integration of modelling technologies. Environmental Modelling & Software, 111: 386-393.
|
|
|
| [29] |
Pearl J. 1988. Probabilistic Reasoning in Intelligent Systems:Networks of Plausible Inference. San Francisco: Morgan Kaufmann Publishers Inc., 48(1): 117-124.
|
|
|
| [30] |
Pei H W, Liu M Z, Shen Y J, et al. 2022. Quantifying impacts of climate dynamics and land-use changes on water yield service in the agro-pastoral ecotone of northern China. Science of the Total Environment, 809: 151153, doi:10.1016/j.scitotenv.2021.151153.
|
|
|
| [31] |
Peng L, Chen T T, Deng W, et al. 2022. Exploring ecosystem services trade-offs using the Bayesian belief network model for ecological restoration decision-making: A case study in Guizhou Province, China. Ecological Indicators, 135: 108569, doi:10.1016/j.ecolind.2022.108569.
|
|
|
| [32] |
Pham H V, Sperotto A, Furlan E, et al. 2021. Integrating Bayesian Networks into ecosystem services assessment to support water management at the river basin scale. Ecosystem Services, 50: 101300, doi:10.1016/j.ecoser.2021.101300.
|
|
|
| [33] |
Qin J B, Ye H, Lin K, et al. 2024. Assessment of water-related ecosystem services based on multi-scenario land use changes: focusing on the Poyang Lake Basin of southern China. Ecological Indicators, 158: 111549, doi:10.1016/j.ecolind.2024.111549.
|
|
|
| [34] |
Qiu H H, Zhang J Y, Han H R, et al. 2023. Study on the impact of vegetation change on ecosystem services in the Loess Plateau, China. Ecological Indicators, 154: 110812, doi:10.1016/j.ecolind.2023.110812.
|
|
|
| [35] |
Ren D F, Qiu A Y, Cao A H, et al. 2025. Spatial responses of ecosystem service trade-offs and synergies to impact factors in Liaoning Province. Environmental Management, 75(1): 111-123.
doi: 10.1007/s00267-023-01919-5
|
|
|
| [36] |
Rohmer J. 2020. Uncertainties in conditional probability tables of discrete Bayesian Belief Networks: A comprehensive review. Engineering Applications of Artificial Intelligence, 88: 103384, doi:10.1016/j.engappai.2019.103384.
|
|
|
| [37] |
Shaanxi Provincial Department of Water Resources. 1990-2020. Shaanxi Water Resources Bulletin. Xi'an: Shaanxi Hydrology and Water Resources Survey Center. (in Chinese)
|
|
|
| [38] |
Shi Y, Wei W. 2024. Changes in soil conservation service supply-demand coordinations and their influencing factors: Evidence from the Loess Plateau of China. Science of the Total Environment, 957: 177793, doi:10.1016/j.scitotenv.2024.177793.
|
|
|
| [39] |
Song S Y, Yu D Y, Li X Y. 2023. Impacts of changes in climate and landscape pattern on soil conservation services in a dryland landscape. CATENA, 222: 106869, doi:10.1016/j.catena.2022.106869.
|
|
|
| [40] |
Song Y N, Wang M, Sun X F, et al. 2021. Quantitative assessment of the habitat quality dynamics in Yellow River Basin, China. Environmental Monitoring and Assessment, 193(9): 614, doi:10.1007/s10661-021-09404-4.
|
|
|
| [41] |
Sun G, Hallema D, Asbjornsen H. 2017. Ecohydrological processes and ecosystem services in the Anthropocene: a review. Ecological Processes, 6(1): 35, doi:10.1186/s13717-017-0104-6.
|
|
|
| [42] |
Tao Q, Gao G H, Xi H H, et al. 2022. An integrated evaluation framework for multiscale ecological protection and restoration based on multi-scenario trade-offs of ecosystem services: Case study of Nanjing City, China. Ecological Indicators, 140: 108962, doi:10.1016/j.ecolind.2022.108962.
|
|
|
| [43] |
Wan S, Xu G C, Xiong P, et al. 2024. Microplastic pollution characteristics and ecological risk assessment in the Wuding River Basin, China. Environmental Pollution, 356: 124228, doi:10.1016/j.envpol.2024.124228.
|
|
|
| [44] |
Wang H Y, Wu L S, Yue Y S, et al. 2024a Impacts of climate and land use change on terrestrial carbon storage: A multi-scenario case study in the Yellow River Basin (1992-2050). Science of the Total Environment, 930: 172557, doi:10.1016/j.scitotenv.2024.172557.
|
|
|
| [45] |
Wang Q, Wang H J. 2023. Evaluation for the spatiotemporal patterns of ecological vulnerability and habitat quality: implications for supporting habitat conservation and healthy sustainable development. Environmental Geochemistry and Health, 45(5): 2117-2147.
doi: 10.1007/s10653-022-01328-3
|
|
|
| [46] |
Wang X Z, Wu J Z, Liu Y L, et al. 2022a. Driving factors of ecosystem services and their spatiotemporal change assessment based on land use types in the Loess Plateau. Journal of Environmental Management, 311: 114835, doi:10.1016/j.jenvman.2022.114835.
|
|
|
| [47] |
Wang Y, Li M, Jin G. 2024b. Optimizing spatial patterns of ecosystem services in the Chang-Ji-Tu region (China) through Bayesian Belief Network and multi-scenario land use simulation. Science of the Total Environment, 917: 170424, doi:10.1016/j.scitotenv.2024.170424.
|
|
|
| [48] |
Wang Y D, Li J, Wang Y D, et al. 2022b. Regional social-ecological system coupling process from a water flow perspective. Science of the Total Environment, 853: 158646, doi:10.1016/j.scitotenv.2022.158646.
|
|
|
| [49] |
Wu J S, Fan X N, Li K Y, et al. 2023a. Assessment of ecosystem service flow and optimization of spatial pattern of supply and demand matching in Pearl River Delta, China. Ecological Indicators, 153: 110452, doi:10.1016/j.ecolind.2023.110452.
|
|
|
| [50] |
Wu X Q, Zhang L L, Gao L M, et al. 2023b. Change and tradeoff/synergy analysis of watershed ecosystem services: A case study of Qinghai Lake Basin. Sustainability, 15(15): 11711, doi:10.3390/su151511711.
|
|
|
| [51] |
Xia H, Yuan S F, Prishchepov A V. 2023. Spatial-temporal heterogeneity of ecosystem service interactions and their social-ecological drivers: Implications for spatial planning and management. Resources, Conservation and Recycling, 189: 106767, doi:10.1016/j.resconrec.2022.106767.
|
|
|
| [52] |
Xiong X C, Zhou Z X, Wang X F, et al. 2025. Dynamic simulation of the supply and demand of ecosystem windbreak and sand fixation service in the Wuding River Basin. Land, 14(1): 20, doi:10.3390/land14010020.
|
|
|
| [53] |
Xu C L, Zhang Q B, Yu Q, et al. 2023. Effects of land use/cover change on carbon storage between 2000 and 2040 in the Yellow River Basin, China. Ecological Indicators, 151: 110345, doi:10.1016/j.ecolind.2023.110345.
|
|
|
| [54] |
Xu Z H, Peng J, Dong J Q, et al. 2022. Spatial correlation between the changes of ecosystem service supply and demand: An ecological zoning approach. Landscape and Urban Planning, 217: 104258, doi:10.1016/j.landurbplan.2021.104258.
|
|
|
| [55] |
Xue C L, Chen X H, Xue L R, et al. 2023. Modeling the spatially heterogeneous relationships between tradeoffs and synergies among ecosystem services and potential drivers considering geographic scale in Bairin Left Banner, China. Science of the Total Environment, 855: 158834, doi:10.1016/j.scitotenv.2022.158834.
|
|
|
| [56] |
Yang Y H, Qin T L, Yan D H, et al. 2024. Analysis of the evolution of ecosystem service value and its driving factors in the Yellow River Source Area, China. Ecological Indicators, 158: 111344, doi:10.1016/j.ecolind.2023.111344.
|
|
|
| [57] |
Zeng Y F, Chen X, Yang Z Y, et al. 2023a. Study on the relationship between ecological spatial network structure and regional carbon use Efficiency: A case study of the Wuding river basin. Ecological Indicators, 155: 110909, doi:10.1016/j.ecolind.2023.110909.
|
|
|
| [58] |
Zeng Y F, Yu Q, Wang X C, et al. 2023b. Research on the relationship between the structure of forest and grass ecological spaces and ecological service capacity: A case study of the Wuding River Basin. Remote Sensing, 15(9): 2456, doi:10.3390/rs15092456.
|
|
|
| [59] |
Zhang H, He Z L, Xu J K, et al. 2024. Analysis of spatial and temporal changes in vegetation cover and driving forces in the Wuding River Basin, Loess Plateau. Forests, 15(1): 82, doi:10.3390/f15010082.
|
|
|
| [60] |
Zhang H, Wu S H, Chen S, et al. 2025. Understanding the trade-off and synergy effects of landscape multifunctional and its driving mechanism in rapidly urbanizing areas. Scientific Reports, 15(1): 25087, doi:10.1038/s41598-025-99579-4.
|
|
|
| [61] |
Zhang P, Sun W Y, Xiao P Q, et al. 2022. Driving factors of heavy rainfall causing flash floods in the middle reaches of the Yellow River: A case study in the Wuding River Basin, China. Sustainability, 14(13): 8004, doi:10.3390/su14138004.
|
|
|
| [62] |
Zhang W, Liu G Y, Yang Q, et al. 2021. Urban ecological risk transmission model based on Bayesian network. Journal of Cleaner Production, 296: 126559, doi:10.1016/j.jclepro.2021.126559.
|
|
|
| [63] |
Zhao T, Pan J H. 2022. Ecosystem service trade-offs and spatial non-stationary responses to influencing factors in the Loess hilly-gully region: Lanzhou City, China. Science of the Total Environment, 846: 157422, doi:10.1016/j.scitotenv.2022.157422.
|
|
|
| [64] |
Zhao Y H, Qu Z, Zhang Y, et al. 2022. Effects of human activity intensity on habitat quality based on nighttime light remote sensing: A case study of Northern Shaanxi, China. Science of the Total Environment, 851: 158037, doi:10.1016/j.scitotenv.2022.158037.
|
|
|
| [65] |
Zhao Y H, Zhang L, Jia X, et al. 2023. Pattern and trend of ecosystem service value in the Loess Plateau of Northern Shaanxi. Land, 12(3): 607, doi:10.3390/land12030607.
|
|
|
| [66] |
Zhou S, Peng L. 2021. Applying Bayesian Belief Networks to assess alpine grassland degradation risks: A case study in Northwest Sichuan, China. Frontiers in Plant Science, 12: 773759, doi:10.3389/fpls.2021.773759.
|
|
|
|
Viewed |
|
|
|
Full text
|
|
|
|
|
Abstract
|
|
|
|
|
Cited |
|
|
|
|
| |
Shared |
|
|
|
|
| |
Discussed |
|
|
|
|