| Research article |
|


|
|
|
| Spatiotemporal evolution of ecological environment quality and its drivers in the Helan Mountain, China |
HE Yuanrong1,2, CHEN Yuhang1,*( ), ZHONG Liang1, LAI Yangfeng1, KANG Yuting1, LUO Ming1, ZHU Yunfei3, ZHANG Ming3 ), ZHONG Liang1, LAI Yangfeng1, KANG Yuting1, LUO Ming1, ZHU Yunfei3, ZHANG Ming3 |
1Digital Fujian Institute of Big Data for Natural Disaster Monitoring, Xiamen University of Technology, Xiamen 361000, China
2Hunan Key Laboratory of Remote Sensing Monitoring of Ecological Environment in Dongting Lake Area, Changsha 410004, China
3Zhundong Oil Production Plant, Xinjiang Oilfield Company, Changji 831511, China |
|
|
|
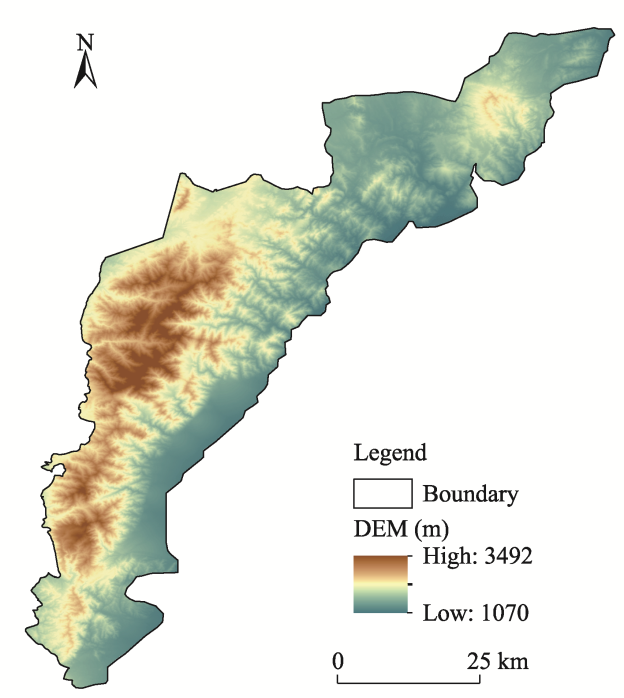
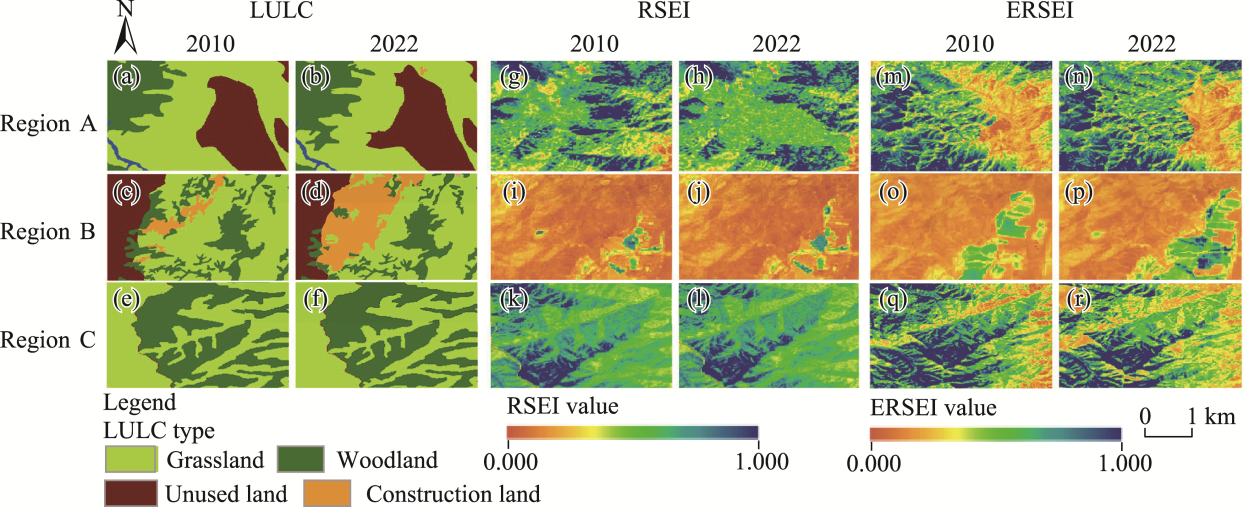
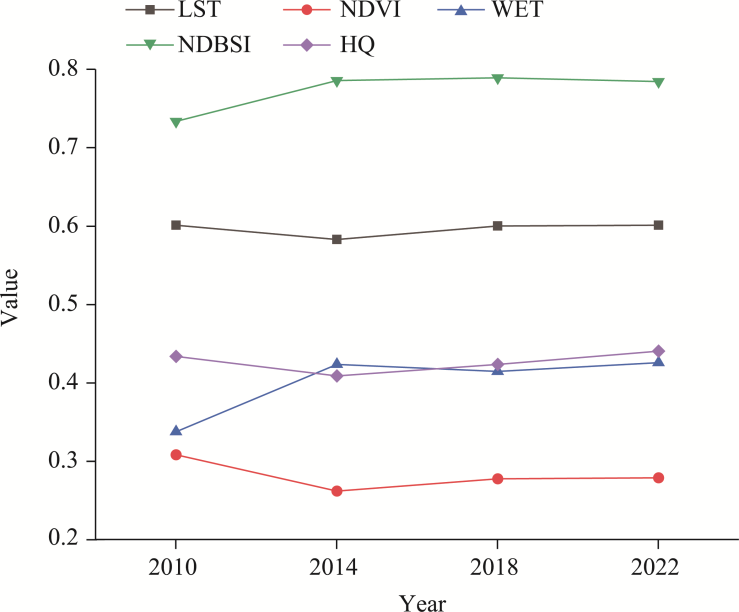
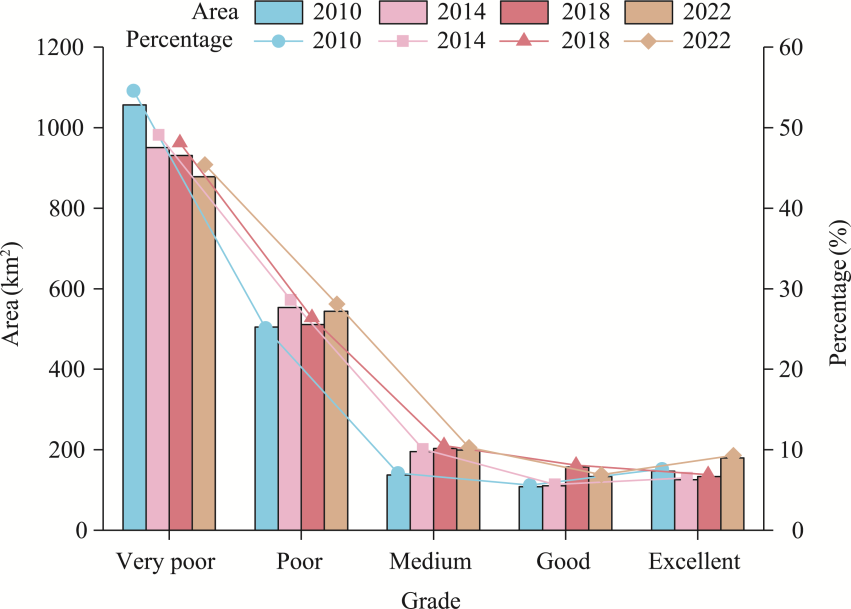
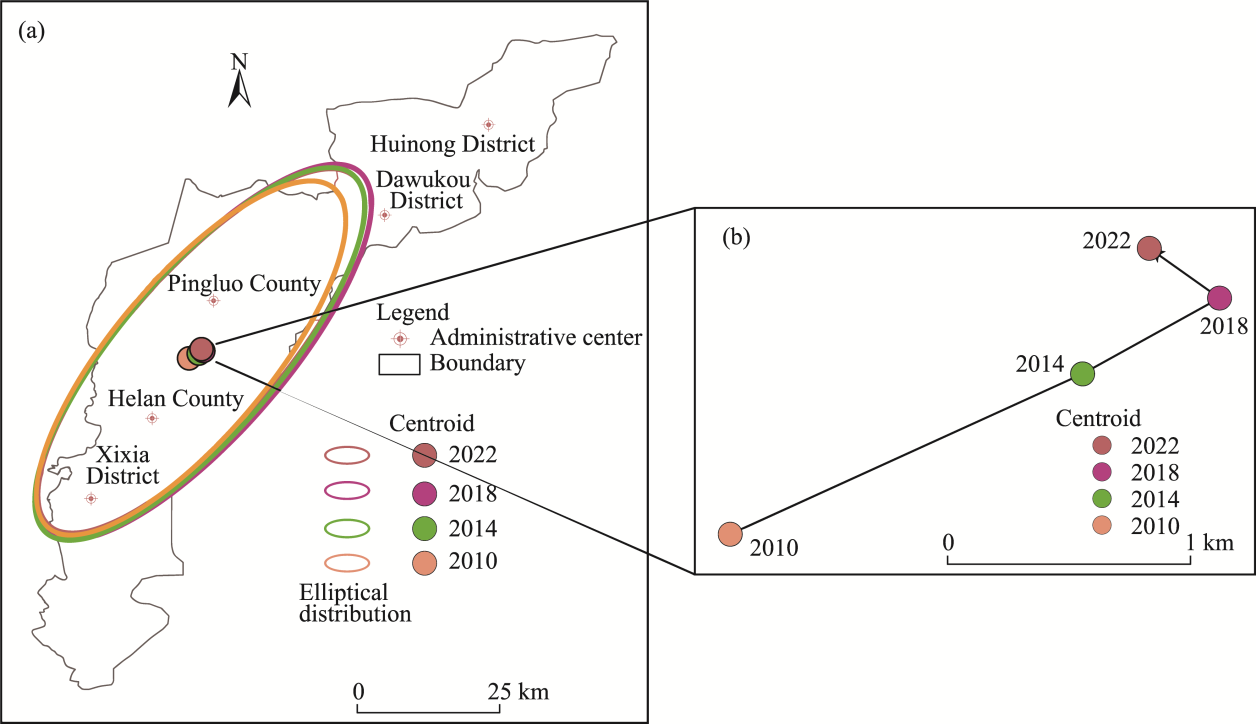
Abstract Understanding the ecological evolution is of great significance in addressing the impacts of climate change and human activities. However, the ecological evolution and its drivers remain inadequately explored in arid and semi-arid areas. This study took the Helan Mountain, a typical arid and semi-arid area in China, as the study area. By adopting an Enhanced Remote Sensing Ecological Index (ERSEI) that integrates the habitat quality (HQ) index with the Remote Sensing Ecological Index (RSEI), we quantified the ecological environment quality of the Helan Mountain during 2010-2022 and analyzed the driving factors behind the changes. Principal Component Analysis (PCA) was used to validate the composite ERSEI, enabling the extraction of key features and the reduction of redundant information. The results showed that the contributions of first principal component (PC1) for ERSEI and RSEI were 80.23% and 78.72%, respectively, indicating that the ERSEI can provide higher precision and more details than the RSEI in assessing ecological environment quality. Temporally, the ERSEI in the Helan Mountain exhibited an initial decline followed by an increase from 2010 to 2022, with the average value of ERSEI ranging between 0.298 and 0.346. Spatially, the ERSEI showed a trend of being higher in the southwest and lower in the northeast, with high-quality ecological environments mainly concentrated in the western foothills at higher altitudes. The centroid of ERSEI shifted northeastward toward Helan County from 2010 to 2022. Temperature and digital elevation model (DEM) emerged as the primary drivers of ERSEI changes. This study highlights the necessity of using comprehensive monitoring tools to guide policy-making and conservation strategies, ensuring the resilience of fragile ecosystems in the face of ongoing climatic and anthropogenic pressures. The findings offer valuable insights for the sustainable management and conservation in arid and semi-arid ecosystems.
|
|
Received: 08 August 2024
Published: 28 February 2025
|
|
Corresponding Authors:
*CHEN Yuhang (E-mail: 2222031097@stu.xmut.edu.cn)
|
| Cite this article:
HE Yuanrong, CHEN Yuhang, ZHONG Liang, LAI Yangfeng, KANG Yuting, LUO Ming, ZHU Yunfei, ZHANG Ming. Spatiotemporal evolution of ecological environment quality and its drivers in the Helan Mountain, China. Journal of Arid Land, 2025, 17(2): 224-244.
URL:
http://jal.xjegi.com/10.1007/s40333-025-0073-z OR http://jal.xjegi.com/Y2025/V17/I2/224
|
|
|
| [1] |
Akhoondzadeh M. 2022. Advances in seismo-LAI anomalies detection within Google Earth Engine (GEE) cloud platform. Advances in Space Research, 69(12): 4351-4357.
|
|
|
| [2] |
Bai Z F, Han L, Liu H Q, et al. 2023. Spatiotemporal change and driving factors of ecological status in Inner Mongolia based on the modified remote sensing ecological index. Environmental Science and Pollution Research, 30(18): 52593-52608.
|
|
|
| [3] |
Chen Y G. 2023. Spatial autocorrelation equation based on Moran's index. Scientific Reports, 13(1): 19296, doi: 10.1038/s41598-023-45947-x.
|
|
|
| [4] |
Fei C, Dong Y Q, An S Z. 2022. Factors driving the biomass and species richness of desert plants in northern Xinjiang China. PLoS ONE, 17(7): e0271575, doi: 10.1371/journal.pone.0271575.
|
|
|
| [5] |
Feng Z X, She L, Wang X H, et al. 2024. Spatial and temporal changes of ecological environment quality in Ningxia based on improved remote sensing ecological indexes. Journal of Ecology and Environment, 33(1): 131-143. (in Chinese)
|
|
|
| [6] |
Fu K X, Jia G D, Yu X X, et al. 2024. Evaluation of ecological environment quality and analysis of driving mechanisms in Turpan-Hami region based on improved remote sensing ecological indices. Journal of Ecology, 44(9): 3911-3923. (in Chinese)
|
|
|
| [7] |
Hu K H, Zhang Z. 2021. Analysis of spatiotemporal characteristics and influencing factors of ecological quality in Liuba County, Qinling Mountains, Shaanxi. Journal of Ecology and Rural Environment, 37(6): 751-760. (in Chinese)
|
|
|
| [8] |
Jiang F, Zhang Y Q, Li J Y, et al. 2021. Research on remote sensing ecological environmental assessment method optimized by regional scale. Environmental Science and Pollution Research, 28(48): 68174-68187.
|
|
|
| [9] |
Li D J, Xu E Q, Zhang H Q. 2020. Influence of ecological land change on wind erosion prevention service in arid area of northwest China from 1990 to 2015. Ecological Indicators, 117: 106686, doi: 10.1016/j.ecolind.2020.106686.
|
|
|
| [10] |
Li J Y, Cui L B, Dou M, et al. 2021. Water resources allocation model based on ecological priority in the arid region. Environmental Research, 199: 111201, doi: 10.1016/j.envres.2021.111201.
|
|
|
| [11] |
Li Y L, Huang S P, Kong X L, et al. 2022. Ecological effects of surface water evolution in the Yellow River Delta. Sustainability, 14(20): 13544, doi: 10.3390/su142013544.
|
|
|
| [12] |
Liang L W, Xian L, Chen M X. 2022. Evolution trend and influencing factors of regional population and economy center in China since the reform and opening-up. Economic Geography, 42(2): 93-103. (in Chinese)
|
|
|
| [13] |
Lin Y M, Nan X X, Hu Z R, et al. 2022. Spatial and temporal changes of vegetation cover in typical ecologically fragile areas in northwest China and evaluation of its ecological security: A case study of Helan Mountain in Ningxia. Journal of Ecology and Rural Environment, 38(5): 599-608. (in Chinese)
|
|
|
| [14] |
Liu J, Ding J, Li L, et al. 2020. Characteristics of aerosol optical depth over land types in central Asia. Science of the Total Environment, 727: 138676, doi: 10.1016/j.scitotenv.2020.138676.
|
|
|
| [15] |
Liu J Y, Xu D W, Xu J. 2024a. Spatiotemporal evolution analysis of landscape pattern and habitat quality in the Puhe River Basin based on InVEST model. Journal of Soil and Water Conservation, 38(2): 258-267. (in Chinese)
|
|
|
| [16] |
Liu Y Z, Zhou T G, Yu W P. 2024b. Analysis of changes in ecological environment quality and influencing factors in Chongqing based on a remote-sensing ecological index mode. Land, 13(2): 227, doi: 10.3390/land13020227.
|
|
|
| [17] |
Long Z J, Zhu H, Bing H J, et al. 2022. Predicting soil cadmium uptake by plants in a tailings reservoir during 48-year vegetation restoration. Science of the Total Environment, 818: 151802, doi: 10.1016/j.scitotenv.2021.151802.
|
|
|
| [18] |
Lu G, Ümüt H, Lei S, et al. 2023. Multi-scenario dynamic prediction of ecological risk assessment in an arid area of northwest China. Ecological Indicators, 154: 110727, doi: 10.1016/j.ecolind.2023.110727.
|
|
|
| [19] |
Luo R J, Wang H T, Wang C. 2023. Ecological quality evaluation of Gulang County in Gansu Province based on improved remote sensing ecological index. Arid Land Geography, 46(4): 539-549. (in Chinese)
doi: 10.12118/j.issn.1000-6060.2022.322
|
|
|
| [20] |
Ma D L, Huang Q J, Zhang Q, et al. 2024. Evaluation of eco-environmental quality and analysis of driving forces in the Yellow River Delta based on improved remote sensing ecological indices. Stochastic Environmental Research and Risk Assessment, 38(8): 3199-3220.
|
|
|
| [21] |
Peng X F, Zhang S Q, Peng P H, et al. 2023. Unraveling the ecological tapestry: A comprehensive assessment of Changtang Nature Reserve's ecological and environmental using RSEI and GEE. Land, 12(8): 1581, doi: 10.3390/land12081581.
|
|
|
| [22] |
Shi H, Shi T, Liu Q, et al. 2021. Ecological vulnerability of tourism scenic spots: Based on remote sensing ecological index. Polish Journal of Environmental Studies, 30(4): 3231-3248.
|
|
|
| [23] |
Shi M, Lin F, Jing X, et al. 2023. Ecological environment quality assessment of arid areas based on improved remote sensing ecological index: A case study of the Loess Plateau. Sustainability, 15(18): 13881, doi: 10.3390/su151813881.
|
|
|
| [24] |
Srivastava P K, Pandey P C, Petropoulos G P, et al. 2019. GIS and remote sensing aided information for soil moisture estimation: A comparative study of interpolation techniques. Resources, 8(2): 70, doi: 10.3390/resources8020070.
|
|
|
| [25] |
Tariq A, Sardans J, Zeng F, et al. 2024. Impact of aridity rise and arid lands expansion on carbon-storing capacity, biodiversity loss, and ecosystem services. Global Change Biology, 30(4): e17292, doi: 10.1111/gcb.17292.
|
|
|
| [26] |
Thompson D R, Babu K N, Braverman A J, et al. 2019. Optimal estimation of spectral surface reflectance in challenging atmospheres. Remote Sensing of Environment, 232: 111258, doi: 10.1016/j.rse.2019.111258.
|
|
|
| [27] |
Tillé Y, Dickson M M, Espa G, et al. 2018. Measuring the spatial balance of a sample: A new measure based on Moran's I index. Spatial Statistics, 23: 182-192.
|
|
|
| [28] |
Wang J, Liu D W, Ma J L, et al. 2021. Development of a large-scale remote sensing ecological index in arid areas and its application in the Aral Sea Basin. Journal of Arid Land, 13(1): 40-55.
doi: 10.1007/s40333-021-0052-y
|
|
|
| [29] |
Wang J, Wang J, Xu J Q. 2023a. Spatio-temporal variation and prediction of ecological quality based on remote sensing ecological index: A case study of Zhanjiang City, China. Frontiers in Ecology and Evolution, 11: 1153342, doi: 10.3389/fevo.2023.1153342.
|
|
|
| [30] |
Wang X F, Gong L, Luo Y, et al. 2024. Phylogenetic diversity drives soil multifunctionality in arid montane forest-grassland transition zone. Frontiers in Plant Science, 15: 1344948, doi: 10.3389/fpls.2024.1344948.
|
|
|
| [31] |
Wang Y F, Cheng L L, Zheng Y. 2023b. An adjusted landscape ecological security of cultivated land evaluation method based on the interaction between cultivated land and surrounding land types. Land, 12(4): 833, doi: 10.3390/land12040833.
|
|
|
| [32] |
Willis K S. 2015. Remote sensing change detection for ecological monitoring in United States protected areas. Biological Conservation, 182: 233-242.
|
|
|
| [33] |
Xu B W, Liu H, Wang J M, et al. 2024. Ecological design approach for urban green space in arid and semi-arid areas in Northwest China based on habitat and vegetation characteristics thereof. Landscape Architecture, 31(6): 12-18. (in Chinese)
|
|
|
| [34] |
Xu H Q. 2013. A remote sensing urban ecological index and its application. Acta Ecologica Sinica, 33(24): 7853-7862. (in Chinese)
|
|
|
| [35] |
Yang X Y, Dong Y P. 2020. Multiple phases of deformation in the southern Helanshan tectonic belt, northern China. Journal of Asian Earth Sciences, 201: 104497, doi: 10.1016/j.jseaes.2020.104497.
|
|
|
| [36] |
Yu M Y, Xu Y, Li J Q, et al. 2021. Geographic detector-based spatiotemporal variation and influence factors analysis of PM2.5 in Shandong, China. Polish Journal of Environmental Studies, 30(1): 463-475.
|
|
|
| [37] |
Yulianti M, Kusmana C, Setiawan Y, et al. 2024. Analysis of land cover change in Sagara Anakan Cilacap, Central Java using principal component analysis (PCA). IOP Conference Series: Earth and Environmental Science, 1315(1): 012046, doi: 10.1088/1755-1315/1315/1/012046.
|
|
|
| [38] |
Zhang W, Du P J, Guo S C, et al. 2023. Enhanced remote sensing ecological index and ecological environment evaluation in arid area. National Remote Sensing Bulletin, 27(2): 299-317. (in Chinese)
|
|
|
| [39] |
Zhao X, Wang P, Yasir M, et al. 2022. Decision support system based on spatial and temporal pattern evolution of ecological environmental quality in the Yellow River Delta from 2000 to 2020. Soft Computing, 26(20): 11033-11044.
|
|
|
|
Viewed |
|
|
|
Full text
|
|
|
|
|
Abstract
|
|
|
|
|
Cited |
|
|
|
|
| |
Shared |
|
|
|
|
| |
Discussed |
|
|
|
|