| Research article |
|


|
|
|
| Impact of extreme weather and climate events on crop yields in the Tarim River Basin, China |
WANG Xiaochen1,2, LI Zhi1,*( ), CHEN Yaning1, ZHU Jianyu1,3, WANG Chuan1,2, WANG Jiayou1,2, ZHANG Xueqi1, FENG Meiqing1,2, LIANG Qixiang1,2 ), CHEN Yaning1, ZHU Jianyu1,3, WANG Chuan1,2, WANG Jiayou1,2, ZHANG Xueqi1, FENG Meiqing1,2, LIANG Qixiang1,2 |
1State Key Laboratory of Desert and Oasis Ecology, Key Laboratory of Ecological Safety and Sustainable Development in Arid Lands, Xinjiang Institute of Ecology and Geography, Chinese Academy of Sciences, Urumqi 830011, China
2University of the Chinese Academy of Sciences, Beijing 100049, China
3Chifeng Institute of Agricultural and Animal Husbandry Science, Inner Mongolia, Chifeng 024000, China |
|
|
|
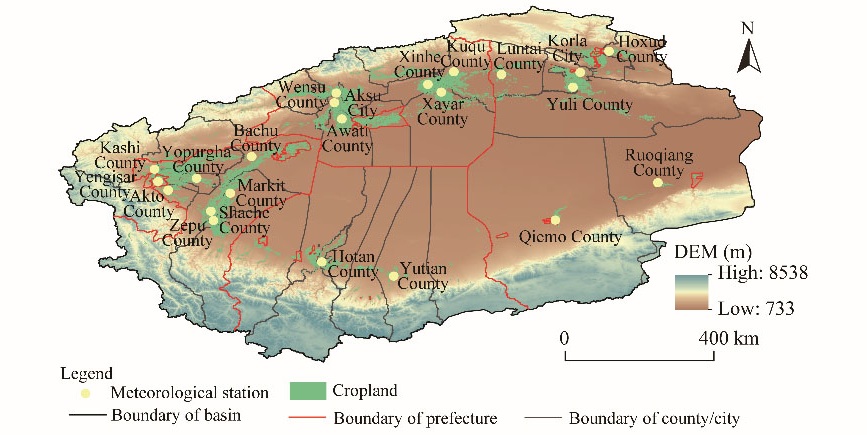
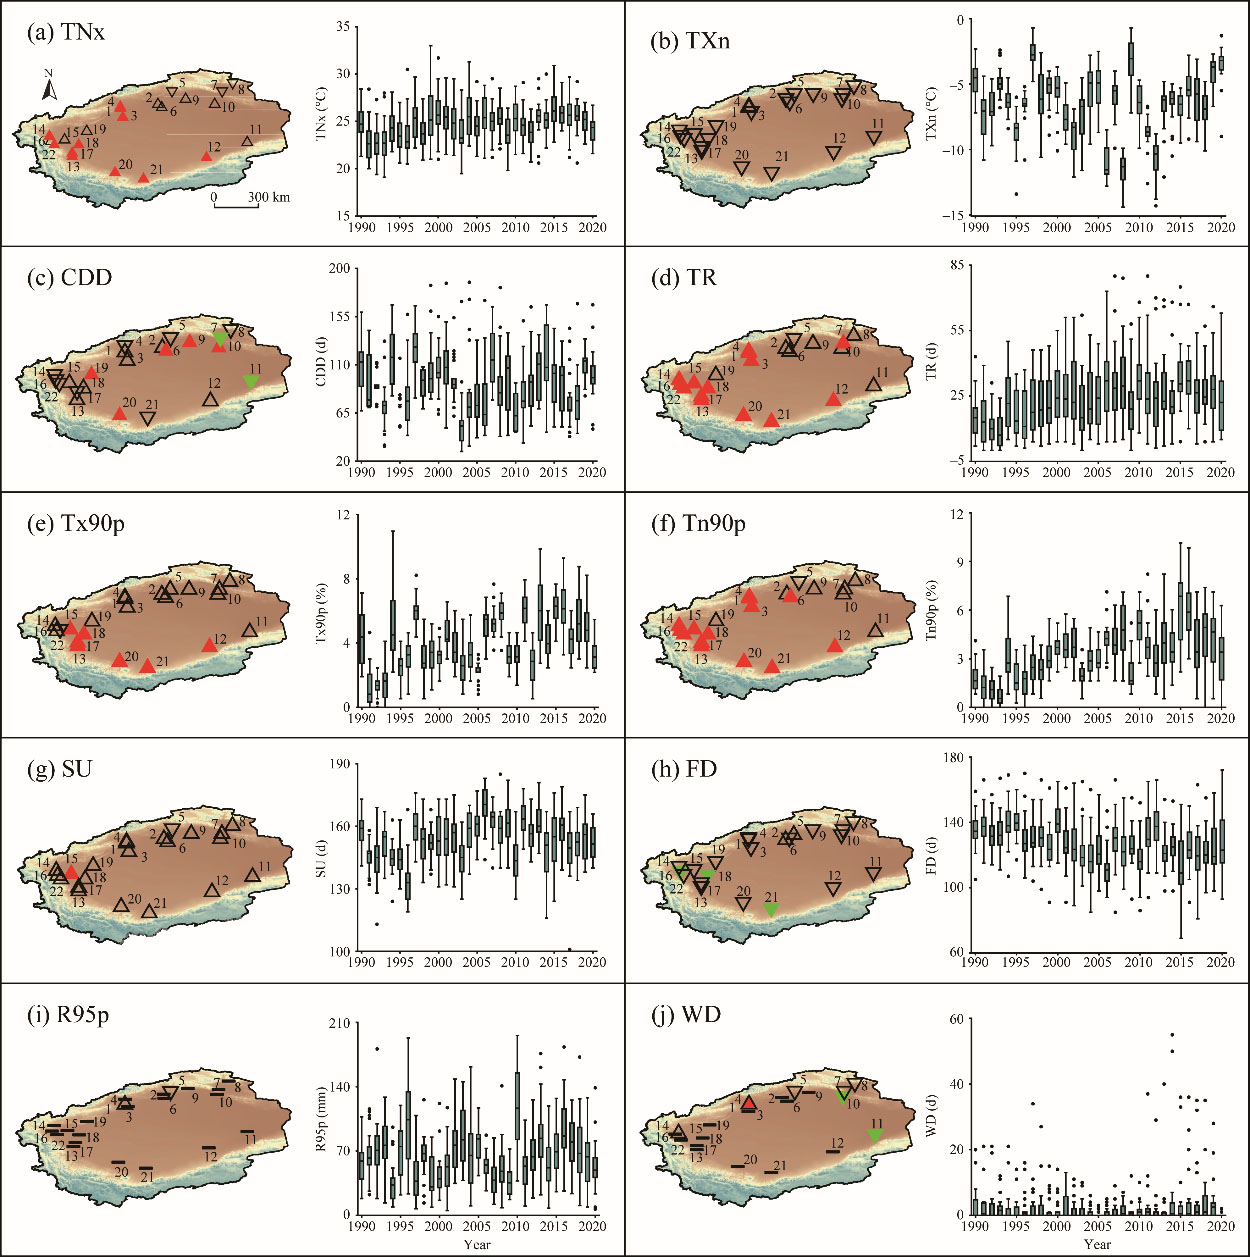
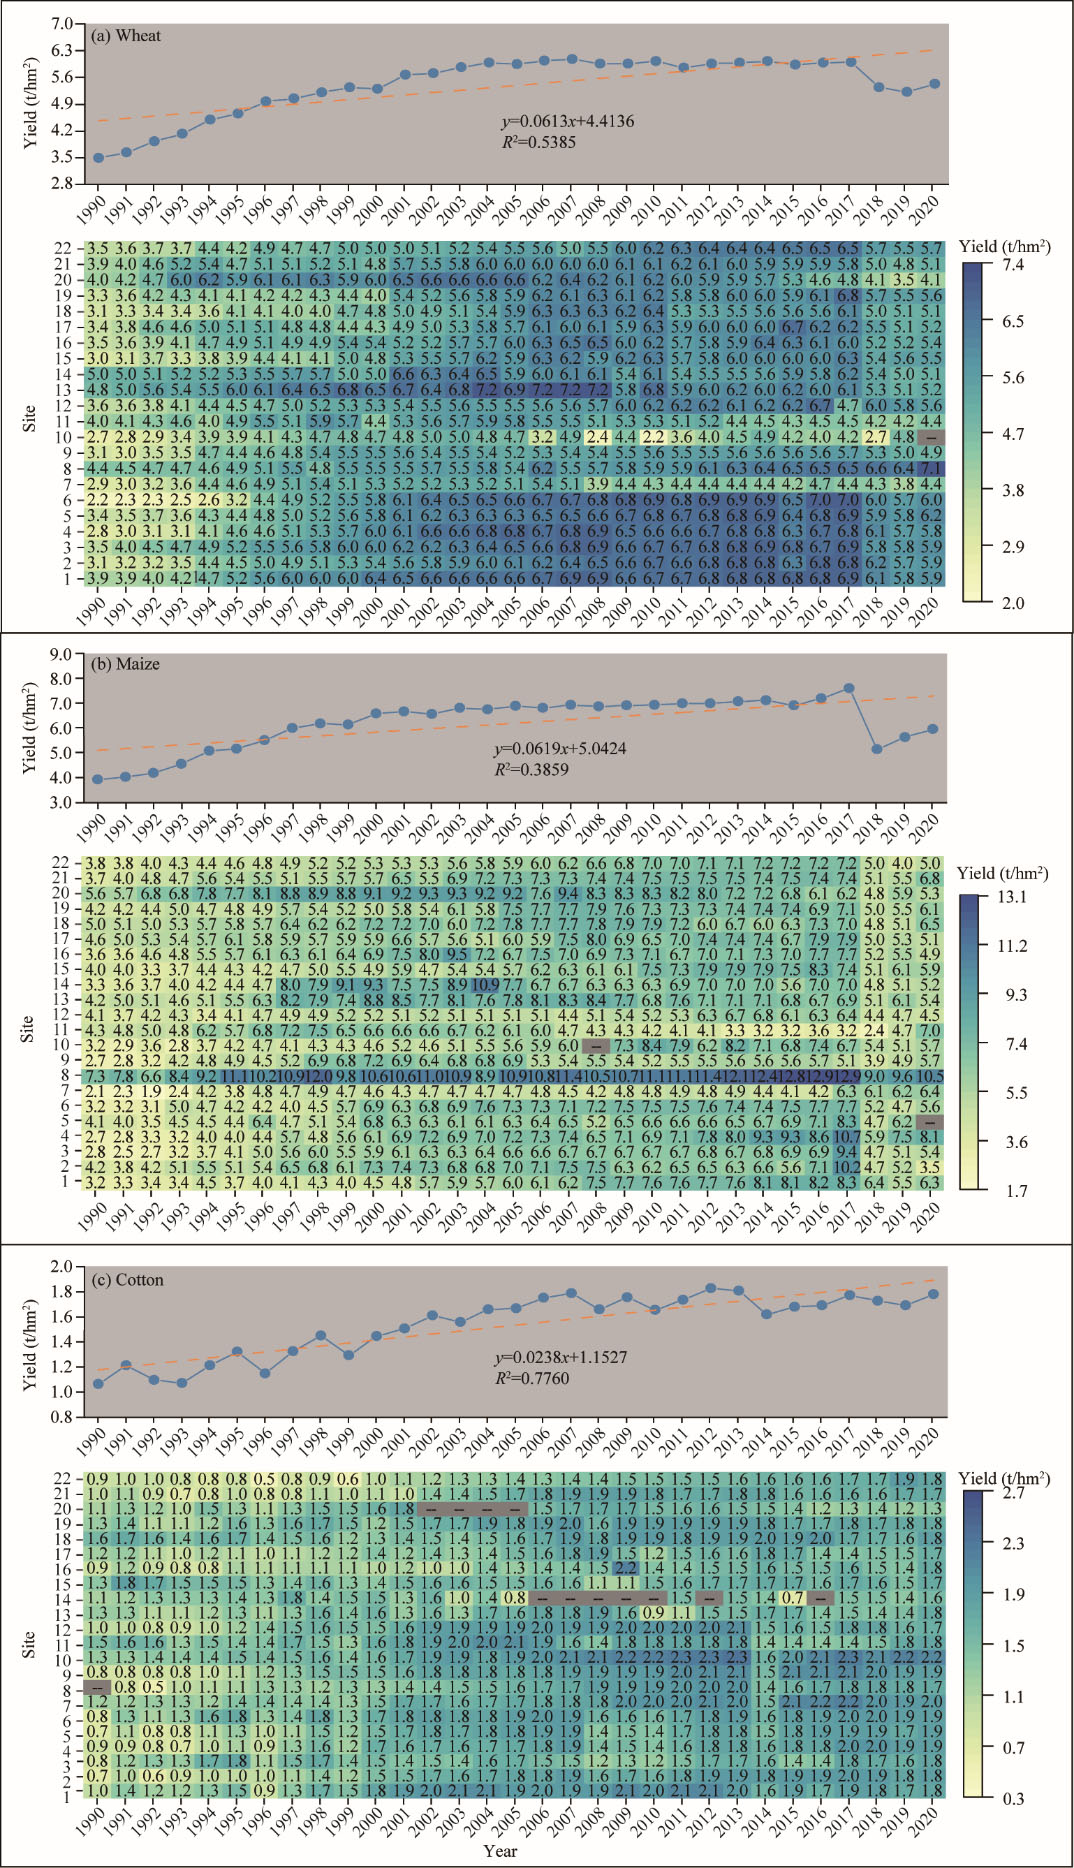
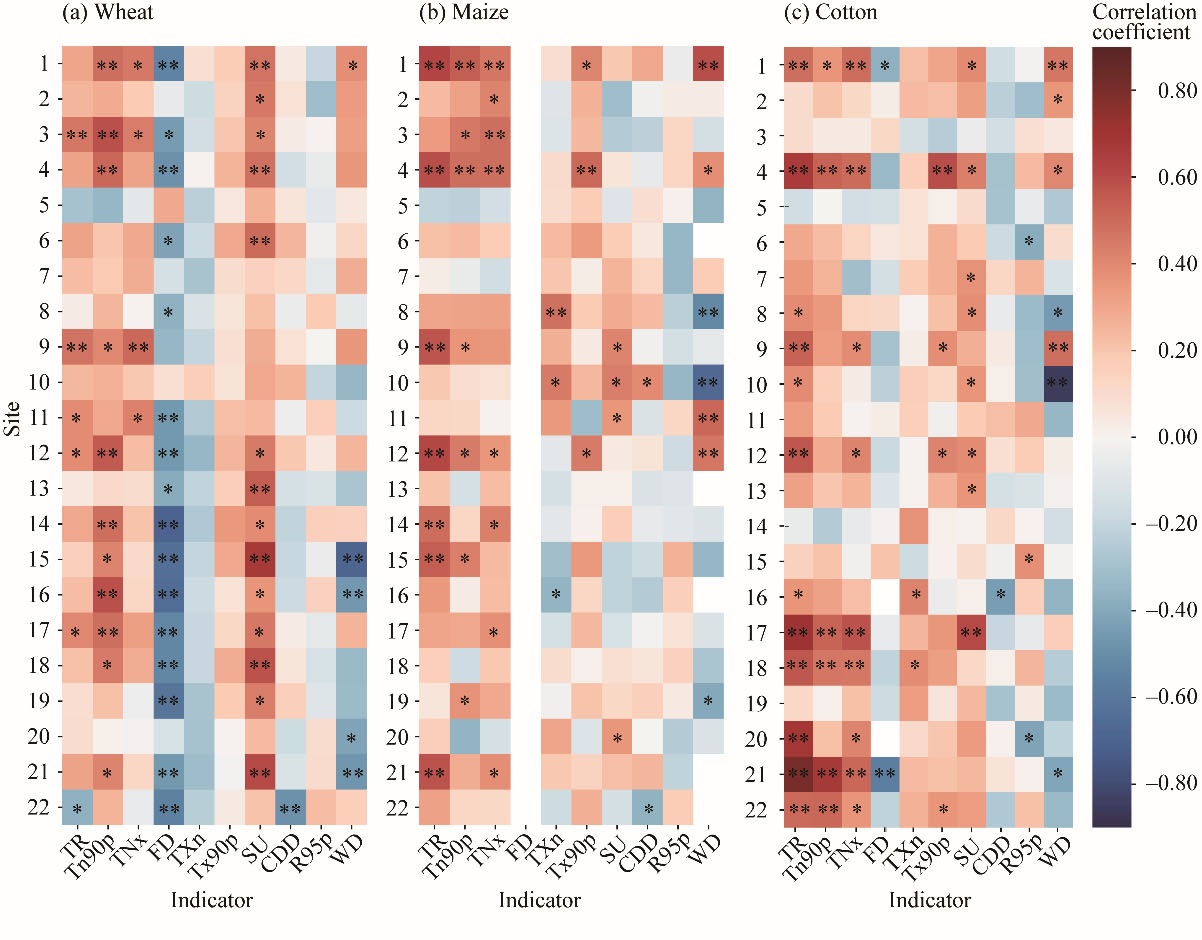
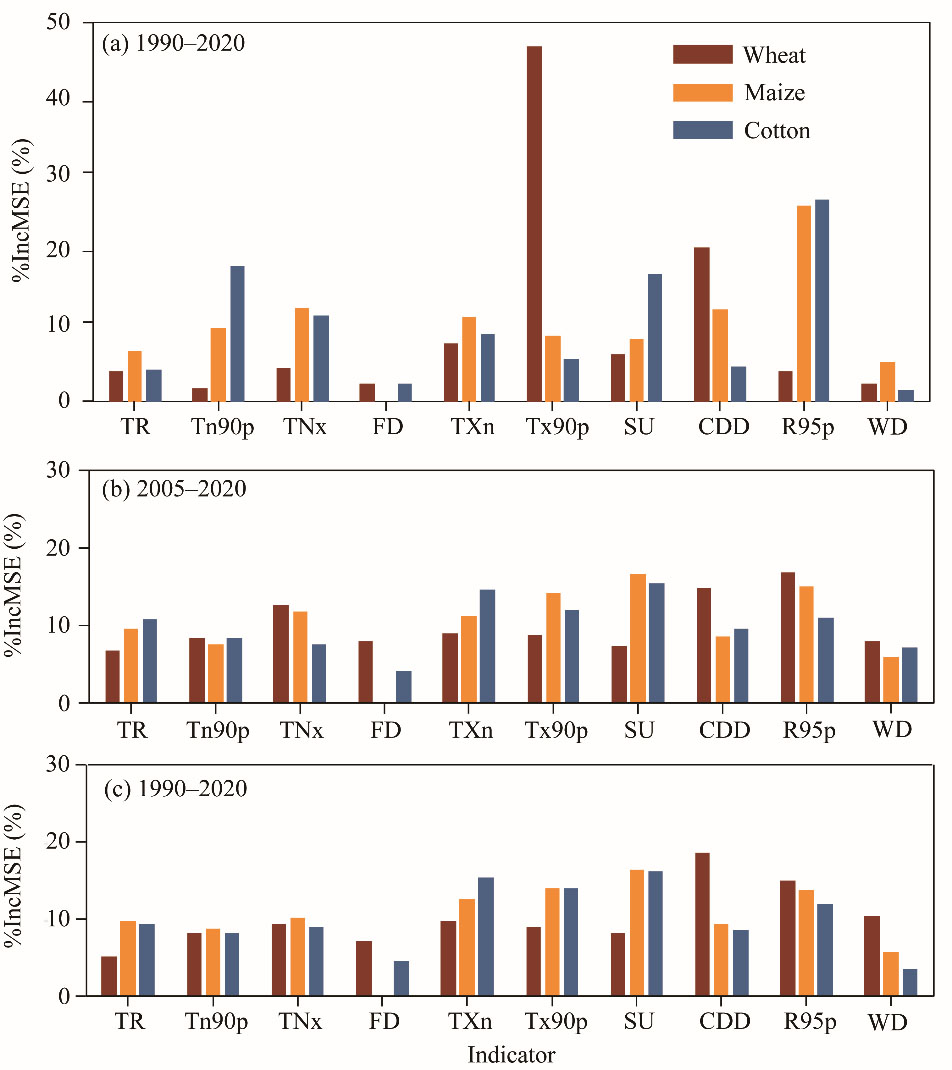
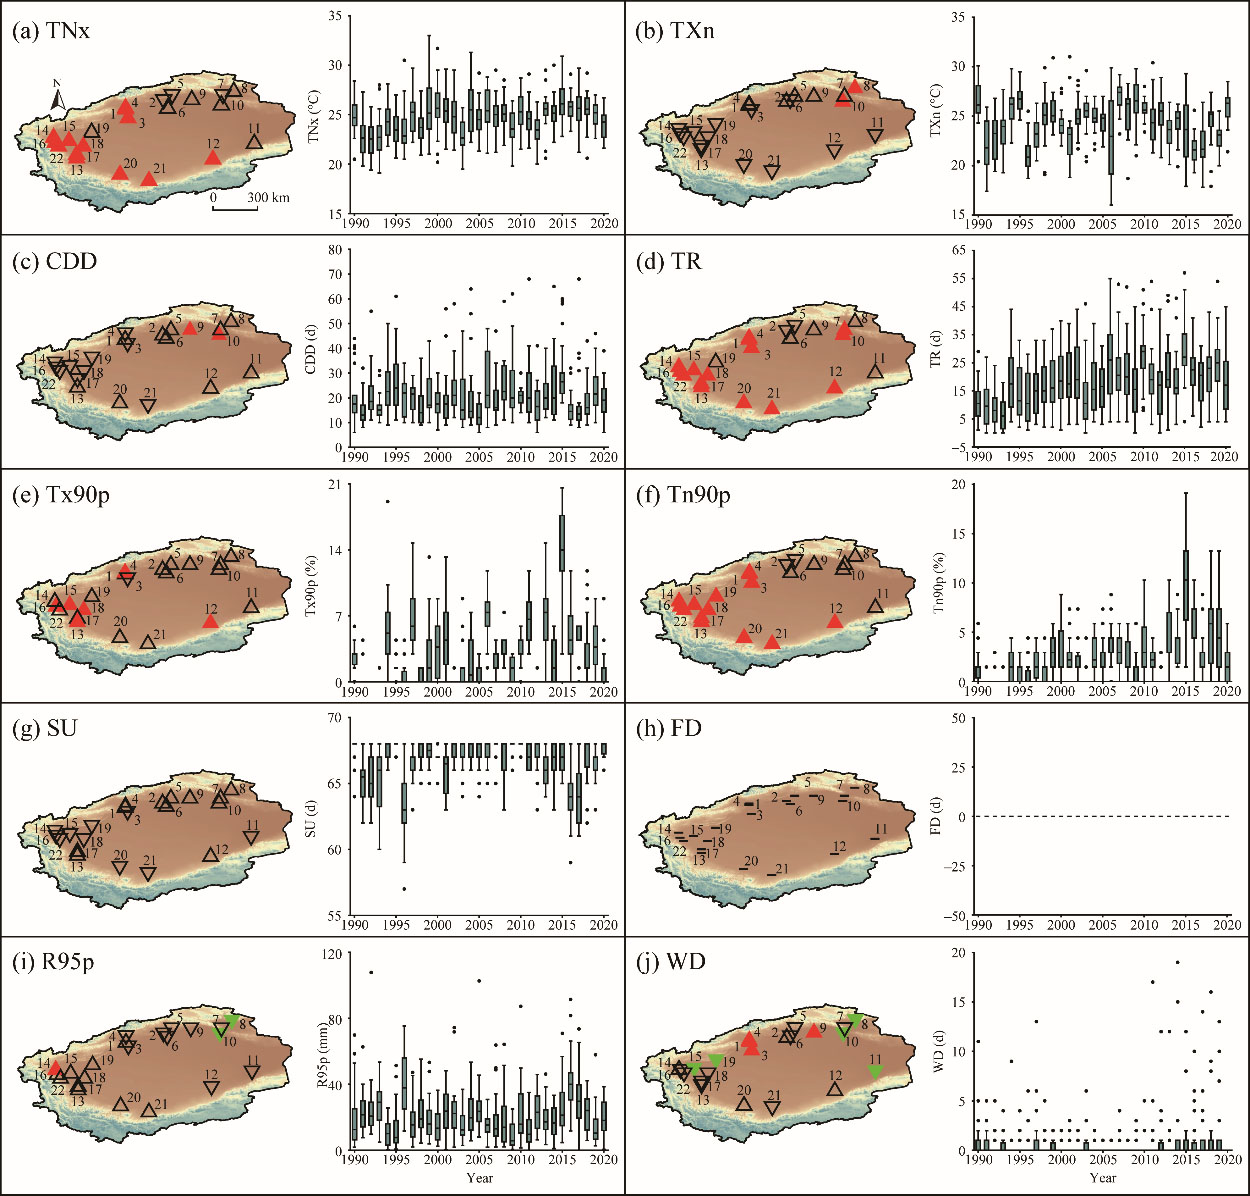
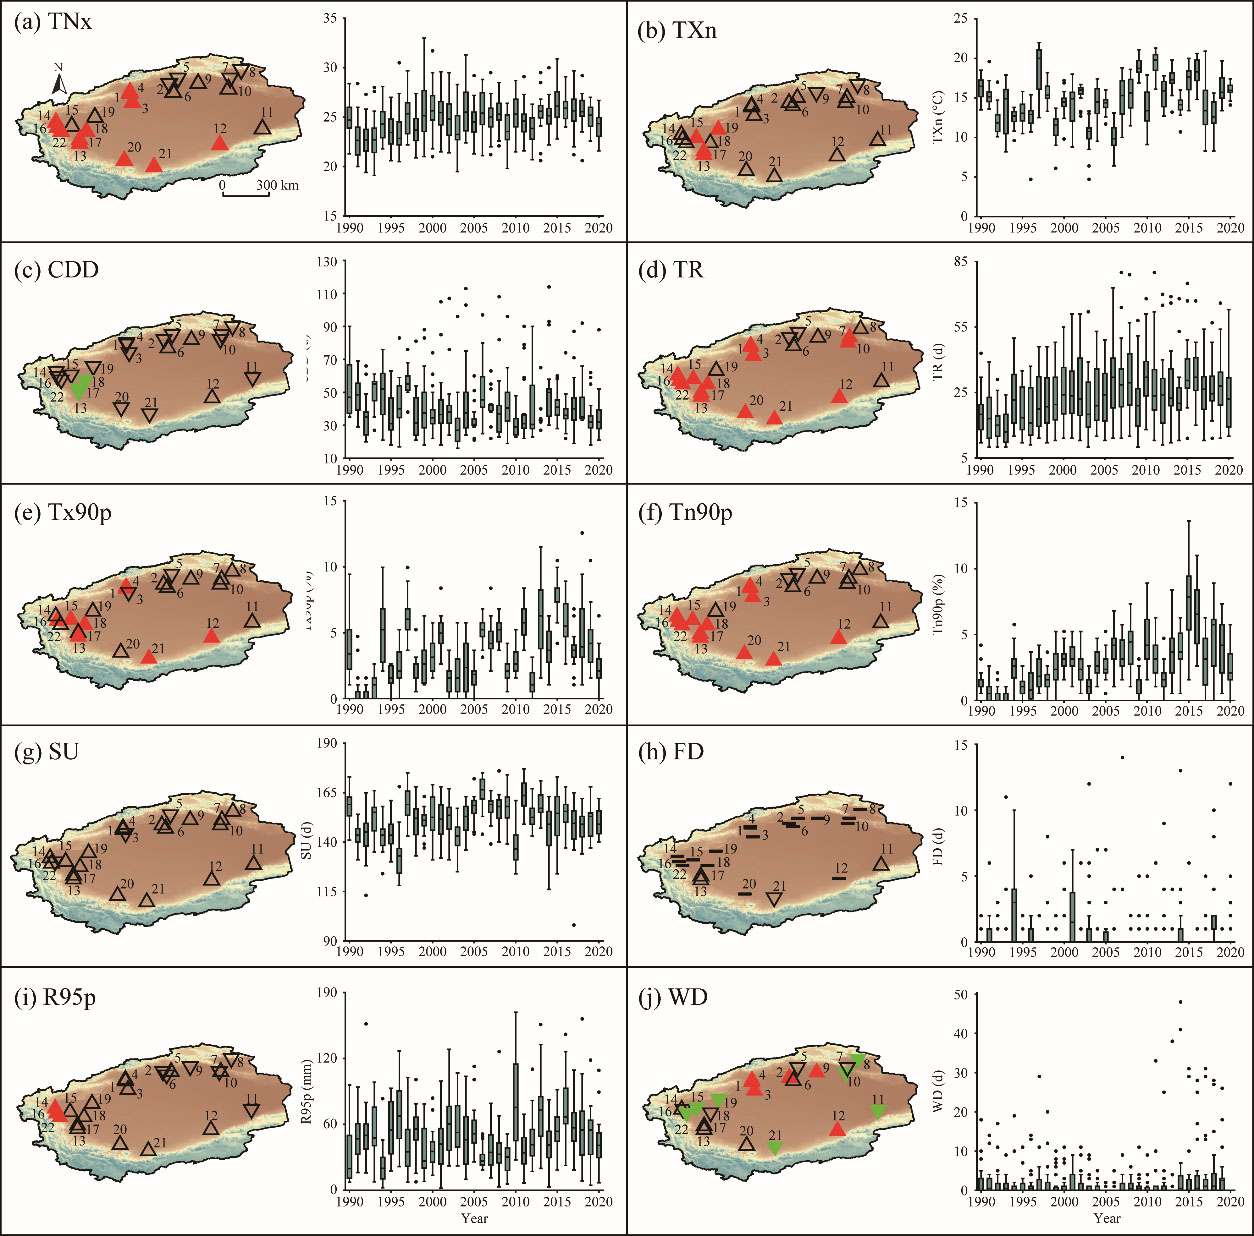
Abstract The Tarim River Basin (TRB) is a vast area with plenty of light and heat and is an important base for grain and cotton production in Northwest China. In the context of climate change, however, the increased frequency of extreme weather and climate events is having numerous negative impacts on the region's agricultural production. To better understand how unfavorable climatic conditions affect crop production, we explored the relationship of extreme weather and climate events with crop yields and phenology. In this research, ten indicators of extreme weather and climate events (consecutive dry days (CDD), min Tmax (TXn), max Tmin (TNx), tropical nights (TR), warm days (Tx90p), warm nights (Tn90p), summer days (SU), frost days (FD), very wet days (R95p), and windy days (WD)) were selected to analyze the impact of spatial and temporal variations on the yields of major crops (wheat, maize, and cotton) in the TRB from 1990 to 2020. The three key findings of this research were as follows: extreme temperatures in southwestern TRB showed an increasing trend, with higher extreme temperatures at night, while the occurrence of extreme weather and climate events in northeastern TRB was relatively low. The number of FD was on the rise, while WD also increased in recent years. Crop yields were higher in the northeast compared with the southwest, and wheat, maize, and cotton yields generally showed an increasing trend despite an earlier decline. The correlation of extreme weather and climate events on crop yields can be categorized as extreme nighttime temperature indices (TNx, Tn90p, TR, and FD), extreme daytime temperature indices (TXn, Tx90p, and SU), extreme precipitation indices (CDD and R95p), and extreme wind (WD). By using Random Forest (RF) approach to determine the effects of different extreme weather and climate events on the yields of different crops, we found that the importance of extreme precipitation indices (CDD and R95p) to crop yield decreased significantly over time. As well, we found that the importance of the extreme nighttime temperature (TR and TNx) for the yields of the three crops increased during 2005-2020 compared with 1990-2005. The impact of extreme temperature events on wheat, maize, and cotton yields in the TRB is becoming increasingly significant, and this finding can inform policy decisions and agronomic innovations to better cope with current and future climate warming.
|
|
Received: 28 August 2024
Published: 28 February 2025
|
|
Corresponding Authors:
*LI Zhi (E-mail: liz@ms.xjb.ac.cn)
|
| Cite this article:
WANG Xiaochen, LI Zhi, CHEN Yaning, ZHU Jianyu, WANG Chuan, WANG Jiayou, ZHANG Xueqi, FENG Meiqing, LIANG Qixiang. Impact of extreme weather and climate events on crop yields in the Tarim River Basin, China. Journal of Arid Land, 2025, 17(2): 200-223.
URL:
http://jal.xjegi.com/10.1007/s40333-025-0094-7 OR http://jal.xjegi.com/Y2025/V17/I2/200
|
|
|
| [1] |
Abdullaev S F, Sokolik I N. 2020. Assessment of the influences of dust storms on cotton production in Tajikistan. In: Gutman G, Chen J Q, Henebry G M, et al. Landscape Dynamics of Drylands across Greater Central Asia: People, Societies and Ecosystems. Landscape Series, Vol. 17. Cham: Springer, 87-105.
|
|
|
| [2] |
Adhikari P, Ale S, Bordovsky J P, et al. 2016. Simulating future climate change impacts on seed cotton yield in the Texas High Plains using the CSM-CROPGRO-Cotton model. Agricultural Water Management, 164(Part 2): 317-330.
|
|
|
| [3] |
Bhatt I, Deryng D, Farrell A, et al. 2022. Food, fibre, and other ecosystem products. In: Climate Change 2022:Impacts, Adaptation and Vulnerability. Contribution of Working Group II to the Sixth Assessment Report of the Intergovernmental Panel on Climate Change. Cambridge: Cambridge University Press, 713-906.
|
|
|
| [4] |
Bowden C, Foster T, Parkes B. 2023. Identifying links between monsoon variability and rice production in India through machine learning. Scientific Reports, 13: 2446, doi: 10.1038/s41598-023-27752-8.
pmid: 36765155
|
|
|
| [5] |
Breiman L. 2001. Random forests. Machine Learning, 45: 5-32.
|
|
|
| [6] |
Chen X P, Qi Z M, Gui D W, et al. 2019. Simulating impacts of climate change on cotton yield and water requirement using RZWQM2. Agricultural Water Management, 222: 231-241.
|
|
|
| [7] |
Cutler D R, Edwards Jr. T C, Beard K H, et al. 2007. Random forests for classification in ecology. Ecology, 88(11): 2783-2792.
doi: 10.1890/07-0539.1
pmid: 18051647
|
|
|
| [8] |
Daloz A S, Rydsaa J H, Hodnebrog Ø, et al. 2021. Direct and indirect impacts of climate change on wheat yield in the Indo-Gangetic Plain in India. Journal of Agriculture and Food Research, 4: 100132: doi: 10.1016/j.jafr.2021.100132.
|
|
|
| [9] |
Eck M A, Murray A R, Ward A R, et al. 2020. Influence of growing season temperature and precipitation anomalies on crop yield in the southeastern United States. Agricultural and Forest Meteorology, 291: 108053, doi: 10.1016/j.agrformet.2020.108053.
|
|
|
| [10] |
Elahi E, Khalid Z, Tauni M Z, et al. 2022. Extreme weather events risk to crop-production and the adaptation of innovative management strategies to mitigate the risk: A retrospective survey of rural Punjab, Pakistan. Technovation, 117: 102255, doi: 10.1016/j.technovation.2021.102255.
|
|
|
| [11] |
Feng P Y, Wang B, Liu D L, et al. 2018. Impacts of rainfall extremes on wheat yield in semi-arid cropping systems in eastern Australia. Climatic Change, 147: 555-569.
|
|
|
| [12] |
Gilbert R O. 1987. Statistical Methods for Environmental Pollution Monitoring. Chichester: John Wiley & Sons, 26-57.
|
|
|
| [13] |
Guan J Y, Yao J Q, Li M Y, et al. 2022. Historical changes and projected trends of extreme climate events in Xinjiang, China. Climate Dynamics, 59: 1753-1774.
|
|
|
| [14] |
Guan X F, Yang L M, Zhang Y X, et al. 2019. Spatial distribution, temporal variation, and transport characteristics of atmospheric water vapor over Central Asia and the arid region of China. Global and Planetary Change, 172: 159-178.
|
|
|
| [15] |
Guntukula R. 2020. Assessing the impact of climate change on Indian agriculture: Evidence from major crop yields. Journal of Public Affairs, 20(1): e2040, doi: 10.1002/pa.2040.
|
|
|
| [16] |
Guo S B, Guo E J, Zhang Z T, et al. 2022. Impacts of mean climate and extreme climate indices on soybean yield and yield components in Northeast China. Science of the Total Environment, 838(Part 3): 156284, doi: 10.1016/j.scitotenv.2022.156284.
|
|
|
| [17] |
Hoffman A L, Kemanian A R, Forest C E. 2020. The response of maize, sorghum, and soybean yield to growing-phase climate revealed with machine learning. Environmental Research Letters, 15: 094013, doi: 10.1088/1748-9326/ab7b22.
|
|
|
| [18] |
Horton D E, Johnson N C, Singh D, et al. 2015. Contribution of changes in atmospheric circulation patterns to extreme temperature trends. Nature, 522(7557): 465-469.
|
|
|
| [19] |
Hou Y F, Chen Y N, Ding J L, et al. 2022. Ecological impacts of land use change in the arid Tarim River Basin of China. Remote Sensing, 14(8): 1894, doi: 10.3390/rs14081894.
|
|
|
| [20] |
Jacovides C P, Kontoyiannis H. 1995. Statistical procedures for the evaluation of evapotranspiration computing models. Agricultural Water Management, 27: 365-371.
|
|
|
| [21] |
Jeong J H, Resop J P, Mueller N D, et al. 2016. Random forests for global and regional crop yield predictions. PLoS ONE, 11(6): e0156571, doi: 10.1371/journal.pone.0156571.
|
|
|
| [22] |
Kendall M G. 1973. Rank correlation methods. International Statistical Review, 41(3): 399-400.
|
|
|
| [23] |
Khan A A, Zhao Y J, Khan J, et al. 2021. Spatial and temporal analysis of rainfall and drought condition in Southwest Xinjiang in Northwest China, using various climate indices. Earth Systems and Environment, 5: 201-216.
|
|
|
| [24] |
Kuradusenge M, Hitimana E, Hanyurwimfura D, et al. 2023. Crop yield prediction using machine learning models: case of Irish potato and maize. Agriculture, 13(1): 225, doi: 10.3390/agriculture13010225.
|
|
|
| [25] |
Legates D R, McCabe Jr. G J. 1999. Evaluating the use of "goodness-of-fit" measures in hydrologic and hydroclimatic model validation. Water Resources Research, 35(1): 233-241.
|
|
|
| [26] |
Li C, Wang R H, Ning H S, et al. 2016. Changes in climate extremes and their impact on wheat yield in Tianshan Mountains region, Northwest China. Environmental Earth Sciences, 75: 1228, doi: 10.1007/s12665-016-6030-6.
|
|
|
| [27] |
Li M Y, Yao J Q, Guan J Y, et al. 2021. Observed changes in vapor pressure deficit suggest a systematic drying of the atmosphere in Xinjiang of China. Atmospheric Research, 248: 105199, doi: 10.1016/j.atmosres.2020.105199.
|
|
|
| [28] |
Li N, Lin H X, Wang T X, et al. 2020. Impact of climate change on cotton growth and yields in Xinjiang, China. Field Crops Research, 247: 107590, doi: 10.1016/j.fcr.2019.107590.
|
|
|
| [29] |
Li N, Li Y, Yang Q L, et al. 2024. Simulating climate change impacts on cotton using AquaCrop model in China. Agricultural Systems, 216: 103897, doi: 10.1016/j.agsy.2024.103897.
|
|
|
| [30] |
Luan J, Zhang C L, Xu B D, et al. 2020. The predictive performances of random forest models with limited sample size and different species traits. Fisheries Research, 227: 105534, doi: 10.1016/j.fishres.2020.105534.
|
|
|
| [31] |
Mahato A. 2014. Climate change and its impact on agriculture. International Journal of Scientific and Research Publications, 4(4): 2250-3153.
|
|
|
| [32] |
Mann H B. 1945. Non-parametric tests against trend. Econometrica, 13(3): 245, doi: 10.2307/1907187.
|
|
|
| [33] |
Meerburg B G, Verhagen A, Jongschaap R E E, et al. 2009. Do nonlinear temperature effects indicate severe damages to U.S. crop yields under climate change? Proceedings of the National Academy of Sciences, 106(43): E120, doi: 10.1073pnas.0910618106.
|
|
|
| [34] |
Mueller B, Hauser M, Iles C, et al. 2015. Lengthening of the growing season in wheat and maize producing regions. Weather and Climate Extremes, 9: 47-56.
|
|
|
| [35] |
Newman R, Noy I. 2023. The global costs of extreme weather that are attributable to climate change. Nature Communications, 14: 6103, doi: 10.1038/s41467-023-41888-1.
|
|
|
| [35] |
Peterson T C, Manton M J. 2008. Monitoring changes in climate extremes: a tale of international collaboration. Bulletin of the American Meteorological Society, 89(9): 1266-1271.
|
|
|
| [37] |
Rezaei E E, Webber H, Asseng S, et al. 2023. Climate change impacts on crop yields. Nature Reviews Earth & Environment, 4: 831-846.
|
|
|
| [38] |
Sadok W, Jagadish S V K. 2020. The hidden costs of nighttime warming on yields. Trends in Plant Science, 25(7): 644-651.
doi: S1360-1385(20)30052-2
pmid: 32526169
|
|
|
| [39] |
Schmitt J, Offermann F, Söder M, et al. 2022. Extreme weather events cause significant crop yield losses at the farm level in German agriculture. Food Policy, 112: 102359, doi: 10.1016/j.foodpol.2022.102359.
|
|
|
| [40] |
Sen P K. 1968. Estimates of the regression coefficient based on Kendall's tau. Journal of the American Statistical Association, 63(324): 1379-1389.
|
|
|
| [41] |
Shen Y-J, Shen Y J, Guo Y, et al. 2020. Review of historical and projected future climatic and hydrological changes in mountainous semiarid Xinjiang (northwestern China), Central Asia. Catena, 187: 104343, doi: 10.1016/j.catena.2019.104343.
|
|
|
| [42] |
Srinivasarao Ch, Kundu S, Shanker A K, et al. 2016. Continuous cropping under elevated CO2: Differential effects on C4 and C3 crops, soil properties and carbon dynamics in semi-arid alfisols. Agriculture, Ecosystems & Environment, 218: 73-86.
|
|
|
| [43] |
Statistic Bureau of Xinjiang Uygur Autonomous Region. 1991-2021. Xinjiang Statistical Yearbook. Beijing: China Statistical Publishing House. (in Chinese)
|
|
|
| [44] |
Tao H, Fischer T, Su B, et al. 2017. Observed changes in maximum and minimum temperatures in Xinjiang Autonomous Region, China. International Journal of Climatology, 37: 5120-5128.
|
|
|
| [45] |
Troy T J, Kipgen C, Pal I. 2015. The impact of climate extremes and irrigation on US crop yields. Environmental Research Letters, 10: 054013, doi: 10.1088/1748-9326/10/5/054013.
|
|
|
| [46] |
Ureta C, González E J, Espinosa A, et al. 2020. Maize yield in Mexico under climate change. Agricultural Systems, 177: 102697, doi: 10.1016/j.agsy.2019.102697.
|
|
|
| [47] |
Vogel E, Donat M G, Alexander L V, et al. 2019. The effects of climate extremes on global agricultural yields. Environmental Research Letters, 14(5): 054010, doi: 10.1088/1748-9326/ab154b.
|
|
|
| [48] |
Wang H J, Chen Y N, Chen Z S. 2013. Spatial distribution and temporal trends of mean precipitation and extremes in the arid region, northwest of China, during 1960-2010. Hydrological Processes, 27(12): 1807-1818.
|
|
|
| [49] |
Wang P, Zhang Z, Song X, et al. 2014. Temperature variations and rice yields in China: historical contributions and future trends. Climatic Change, 124: 777-789.
|
|
|
| [50] |
Wang Y Y, Liu S N, Shi H Y. 2023. Comparison of climate change impacts on the growth of C3 and C4 crops in China. Ecological Informatics, 74: 101968, doi: 10.1016/j.ecoinf.2022.101968.
|
|
|
| [51] |
Wei J L, Pan X H, Deng Q H. 2010. Effects of nighttime temperature increase on the yield of double season rice. Acta Ecologica Sinica, 30(10): 2793-2798. (in Chinese)
|
|
|
| [52] |
Wu J Z, Zhang J, Ge Z M, et al. 2021. Impact of climate change on maize yield in China from 1979 to 2016. Journal of Integrative Agriculture, 20(1): 289-299.
|
|
|
| [53] |
Xu L, Zheng C L, Ma Y. 2021. Variations in precipitation extremes in the arid and semi-arid regions of China. International Journal of Climatology, 41(3): 1542-1554.
|
|
|
| [54] |
Yang Y, Chang W. 2024. Analysis of spatial and temporal distribution and changes in extreme climate events in Northwest China from 1960 to 2021: a case study of Xinjiang. Sustainability, 16(12): 4960, doi: 10.3390/su16124960.
|
|
|
| [55] |
Yin Z L, Feng Q, Yang L S, et al. 2020. Projected spatial patterns in precipitation and air temperature for China's northwest region derived from high-resolution regional climate models. International Journal of Climatology, 40(8): 3922-3941.
|
|
|
| [56] |
Yue S, Wang C Y. 2002. Regional streamflow trend detection with consideration of both temporal and spatial correlation. International Journal of Climatology, 22(8): 933-946.
|
|
|
| [57] |
Zhang J, Liu Y J. 2022. Decoupling of impact factors reveals the response of cash crops phenology to climate change and adaptive management practice. Agricultural and Forest Meteorology, 322: 109010, doi: 10.1016/j.agrformet.2022.109010.
|
|
|
| [58] |
Zhang Q, Sun P, Singh V P, et al. 2012a. Spatial-temporal precipitation changes (1956-2000) and their implications for agriculture in China. Global and Planetary Change, 82: 86-95.
|
|
|
| [59] |
Zhang X D, Lu C H, Guan Z Y. 2012b. Weakened cyclones, intensified anticyclones and recent extreme cold winter weather events in Eurasia. Environmental Research Letters, 7(4): 044044, doi: 10.1088/1748-9326/7/4/044044.
|
|
|
| [60] |
Zhang Z, Li Y, Chen X G, et al. 2023. Impact of climate change and planting date shifts on growth and yields of double cropping rice in southeastern China in future. Agricultural Systems, 205: 103581, doi: 10.1016/j.agsy.2022.103581.
|
|
|
| [61] |
Zhao W J. 2020. Extreme weather and climate events in China under changing climate. National Science Review, 7(5): 938-943.
doi: 10.1093/nsr/nwaa069
pmid: 34692114
|
|
|
| [62] |
Zheng C Y, Zhang J, Chen J, et al. 2017. Nighttime warming increases winter-sown wheat yield across major Chinese cropping regions. Field Crops Research, 214: 202-210.
|
|
|
| [63] |
Zhu J Y, Chen Y N, Li Z, et al. 2023. Using film-mulched drip irrigation to improve the irrigation water productivity of cotton in the Tarim River Basin, Central Asia. Remote Sensing, 15(18): 4615, doi: 10.3390/rs15184615.
|
|
|
| [64] |
Zhu X F, Liu T T, Xu K, et al. 2022. The impact of high temperature and drought stress on the yield of major staple crops in northern China. Journal of Environmental Management, 314: 115092, doi: 10.1016/j.jenvman.2022.115092.
|
|
|
| [65] |
Zou S, Abuduwaili J, Duan W L, et al. 2021. Attribution of changes in the trend and temporal non-uniformity of extreme precipitation events in Central Asia. Scientific Reports, 11: 15032, doi: 10.1038/s41598-021-94486-w.
pmid: 34294830
|
|
|
|
Viewed |
|
|
|
Full text
|
|
|
|
|
Abstract
|
|
|
|
|
Cited |
|
|
|
|
| |
Shared |
|
|
|
|
| |
Discussed |
|
|
|
|