| Research article |
|


|
|
|
| Response of vegetation to climate change along the elevation gradient in High Mountain Asia |
HE Bing1,2,3, LI Ying1,2, GAO Fan1,2,*( ), XU Hailiang4, WU Bin1,2, YANG Pengnian1,2, BAN Jingya1,2, LIU Zeyi3, LIU Kun1,2, HAN Fanghong1,2, MA Zhenghu1,2, WANG Lu5 ), XU Hailiang4, WU Bin1,2, YANG Pengnian1,2, BAN Jingya1,2, LIU Zeyi3, LIU Kun1,2, HAN Fanghong1,2, MA Zhenghu1,2, WANG Lu5 |
1College of Hydraulic and Civil Engineering, Xinjiang Agricultural University, Urumqi 830052, China
2Xinjiang Key Laboratory of Hydraulic Engineering Security and Water Disasters Prevention, Urumqi 830052, China
3Xinjiang Water Conservancy Development Investment (Group) Co., Ltd., Urumqi 830063, China
4Xinjiang Institute of Ecology and Geography, Chinese Academy of Sciences, Urumqi 830011, China
5State Key Laboratory of Eco-hydraulics in Northwest Arid Region of China, Xi'an University of Technology, Xi'an 710048, China |
|
|
|
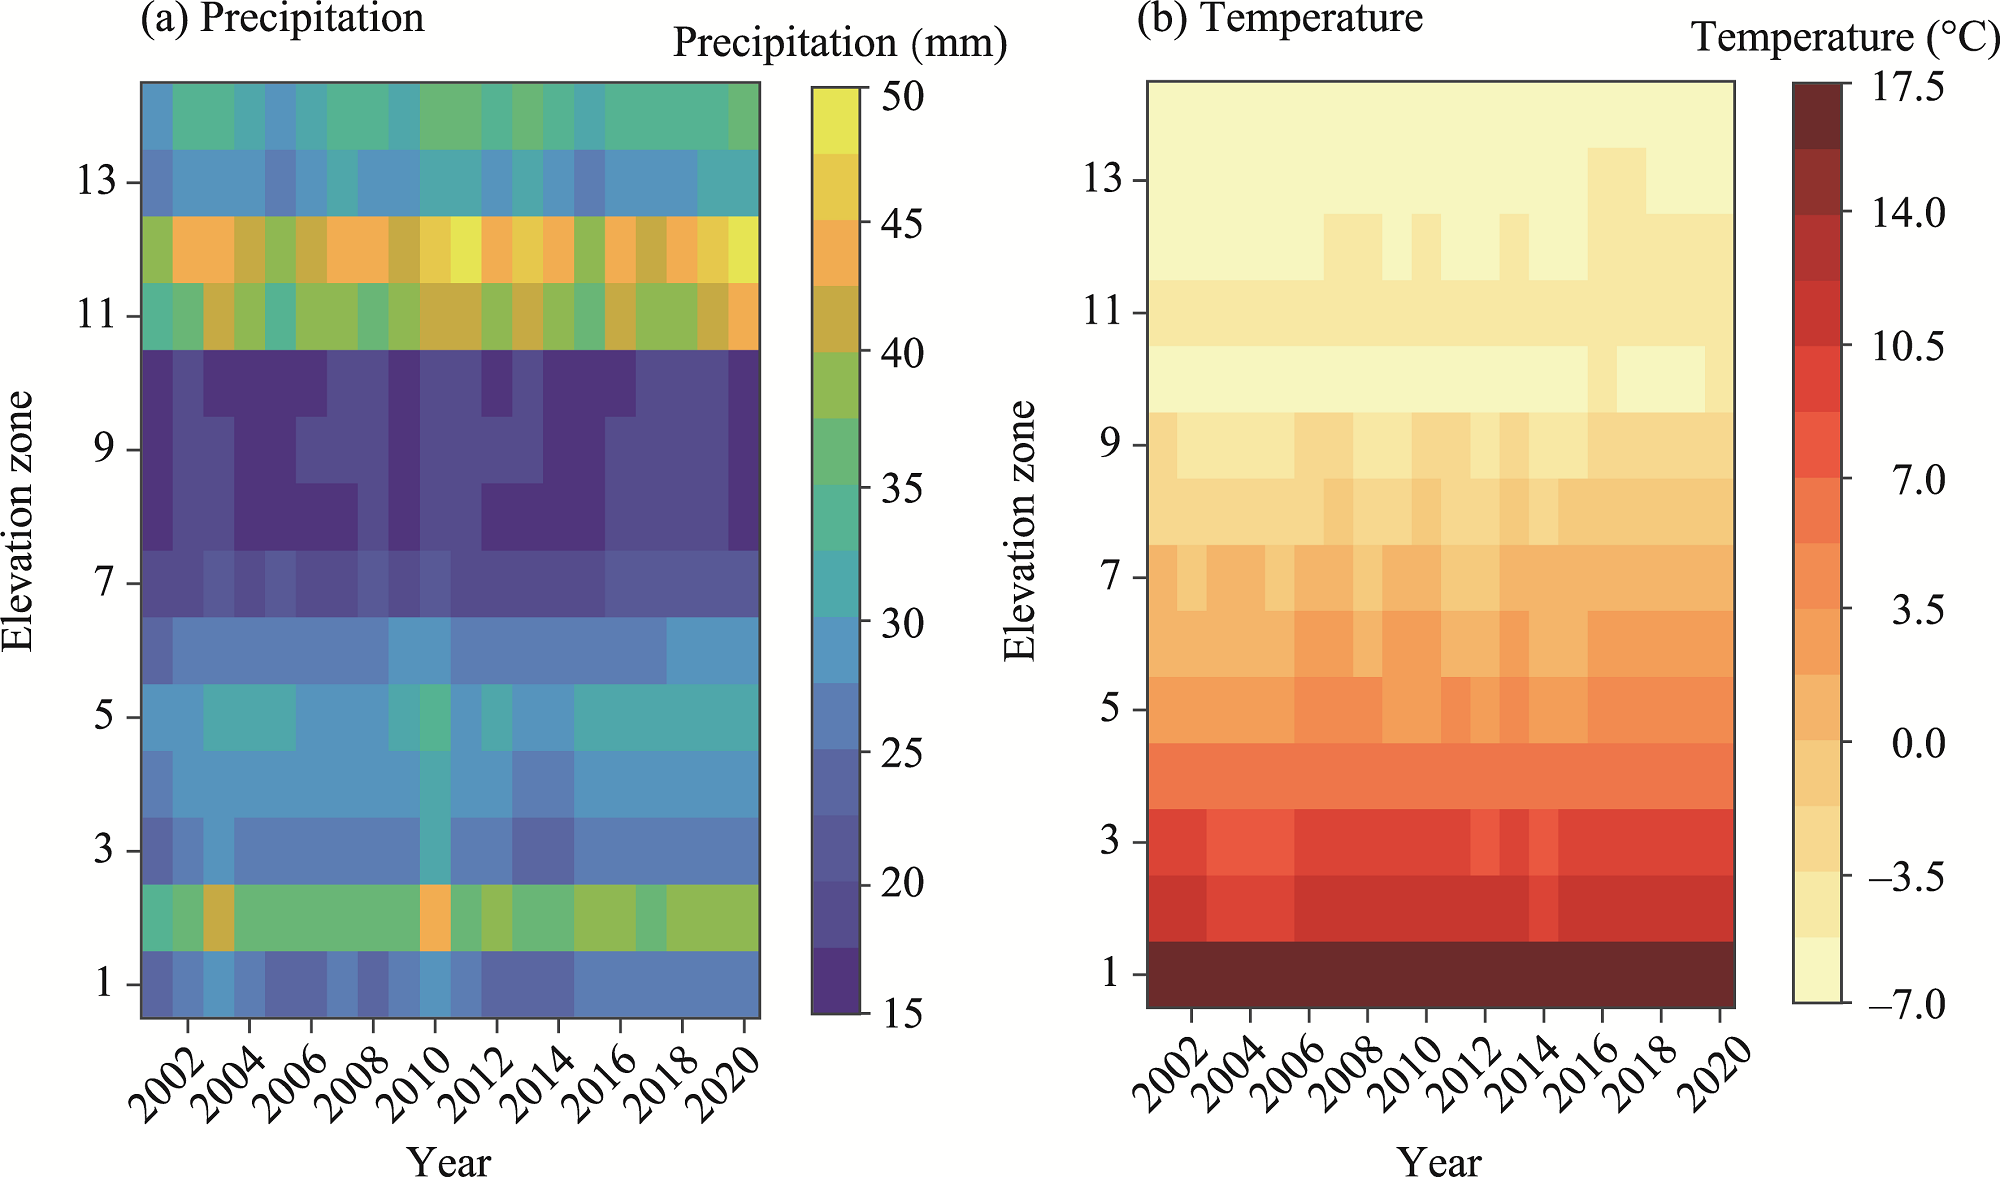
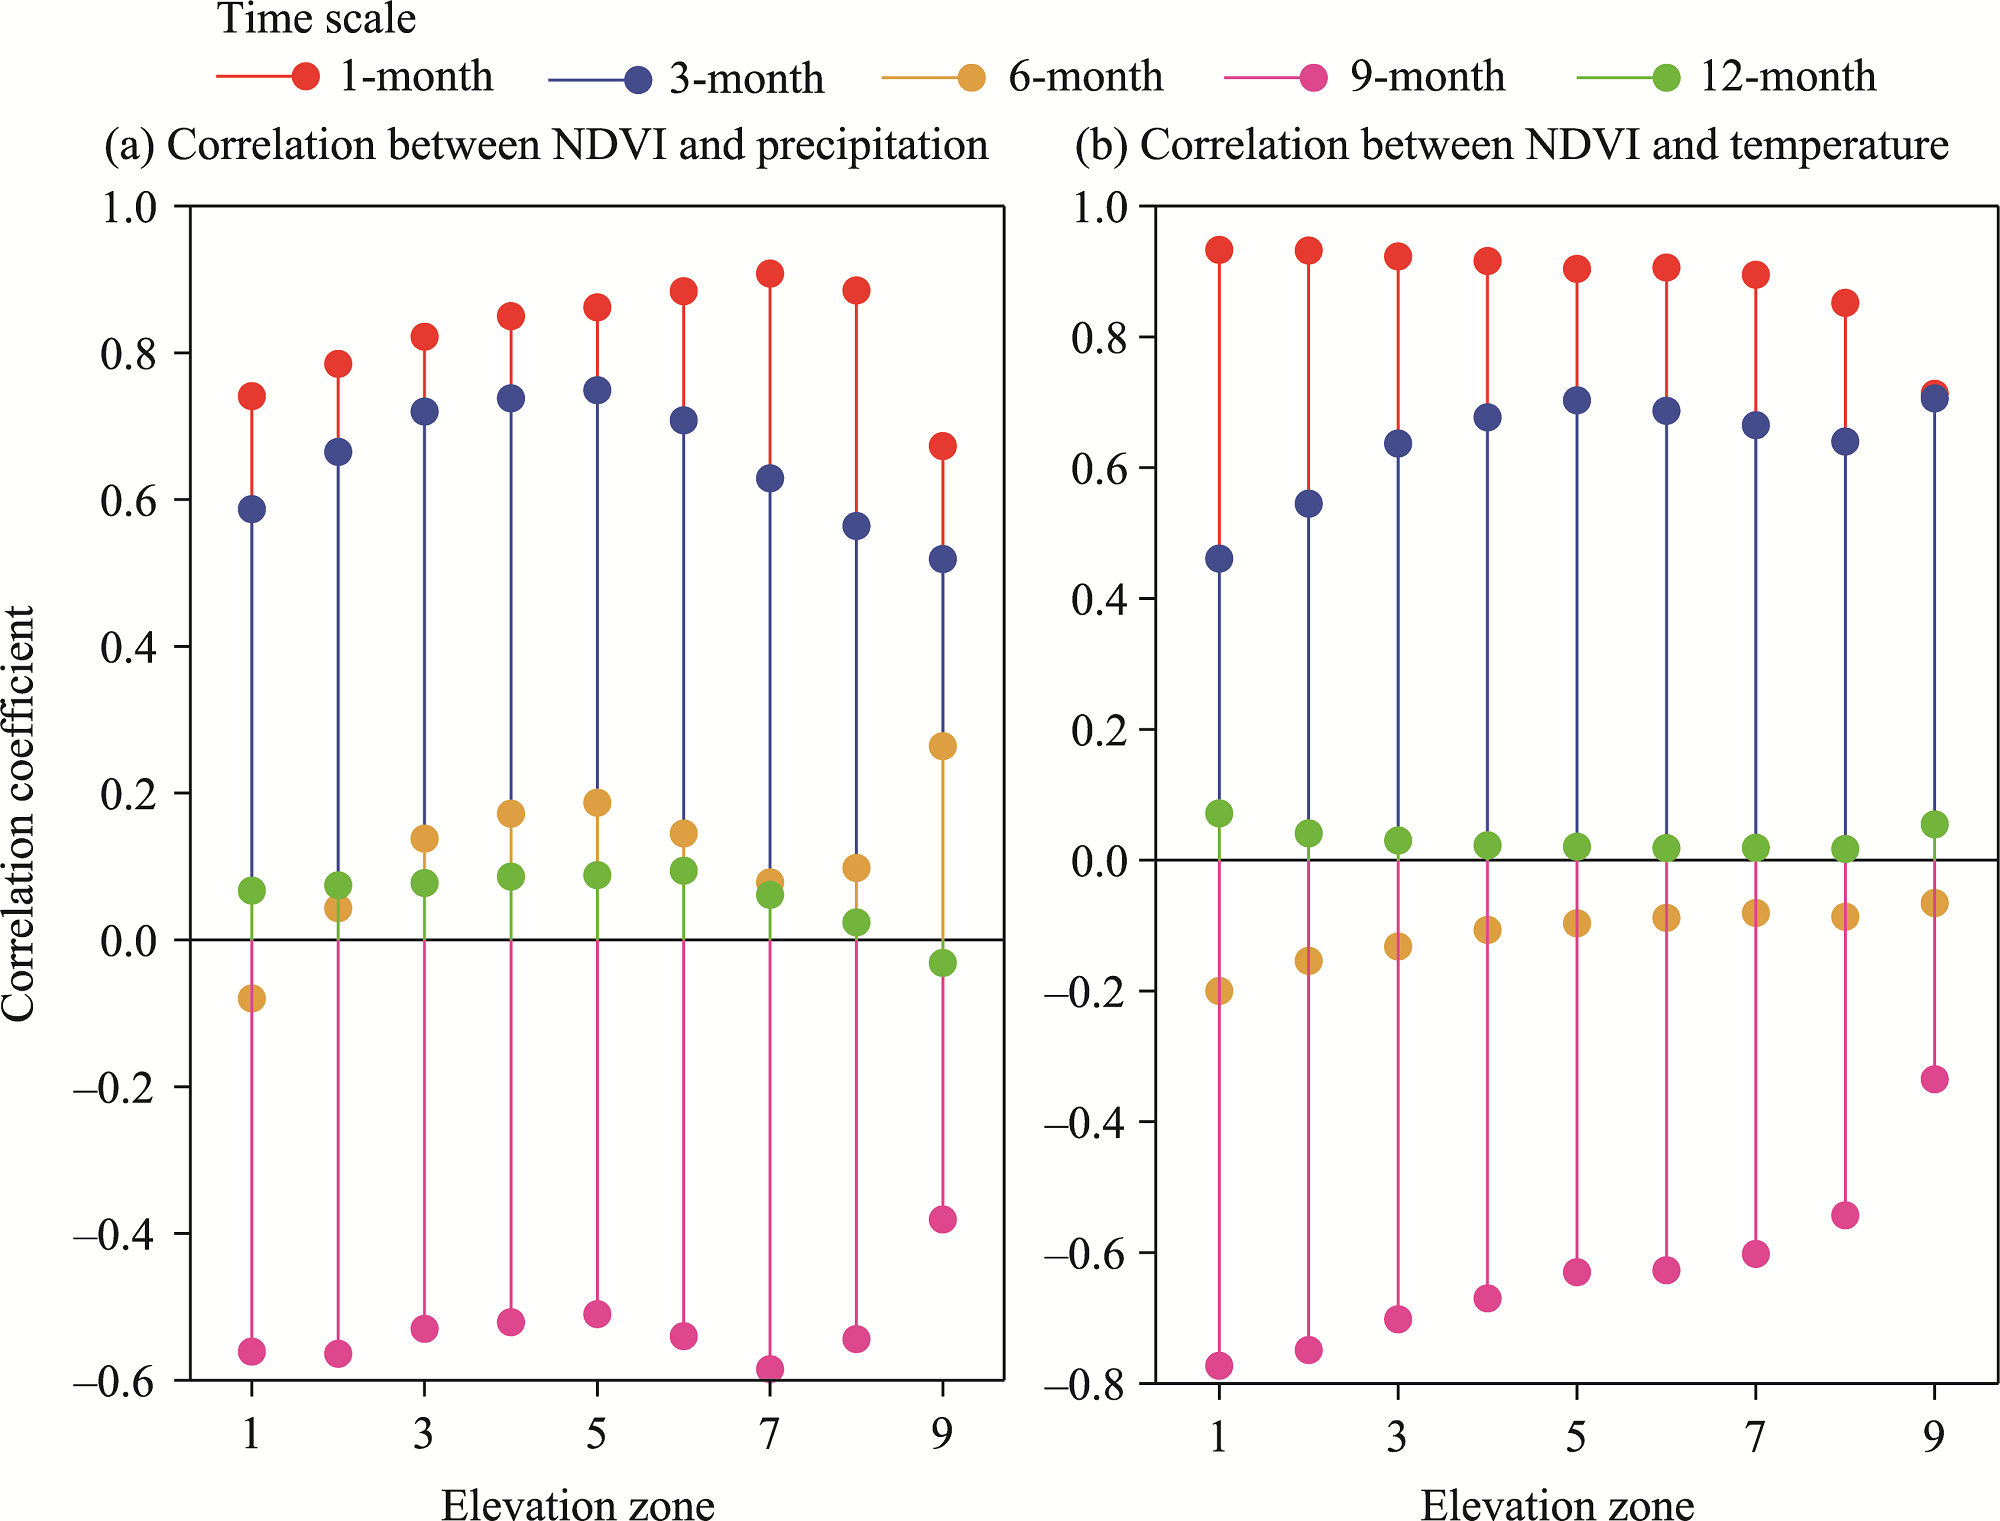
Abstract Climate change in High Mountain Asia (HMA) is characterized by elevation dependence, which results in vertical zoning of vegetation distribution. However, few studies have been conducted on the distribution patterns of vegetation, the response of vegetation to climate change, and the key climatic control factors of vegetation along the elevation gradient in this region. In this study, based on the Normalized Difference Vegetation index (NDVI), we investigated the evolution pattern of vegetation in HMA during 2001-2020 using linear trend and Bayesian Estimator of Abrupt change, Seasonality, and Trend (BEAST) methods. Pearson correlation analysis and partial correlation analysis were used to explore the response relationship between vegetation and climatic factors along the elevation gradient. Path analysis was employed to quantitatively reveal the dominant climatic factors affecting vegetation distribution along the elevation gradient. The results showed that NDVI in HMA increased at a rate of 0.011/10a from 2001 to 2020, and the rate of increase abruptly slowed down after 2017. NDVI showed a fluctuating increase at elevation zones 1-2 (<2500 m) and then decreased at elevation zones 3-9 (2500-6000 m) with the increase of elevation. NDVI was most sensitive to precipitation and temperature at a 1-month lag. With the increase of elevation, the positive response relationship of NDVI with precipitation gradually weakened, while that of NDVI with temperature was the opposite. The total effect coefficient of precipitation (0.95) on vegetation was larger than that of temperature (0.87), indicating that precipitation is the dominant control factor affecting vegetation growth. Spacially, vegetation growth is jointly influenced by precipitation and temperature, but the influence of precipitation on vegetation growth is dominant at each elevation zone. The results of this study contribute to understanding how the elevation gradient effect influences the response of vegetation to climate change in alpine ecosystems.
|
|
Received: 30 December 2024
Published: 30 September 2025
|
|
Corresponding Authors:
*GAO Fan (E-mail: gutongfan0202@163.com)
|
| Cite this article:
HE Bing, LI Ying, GAO Fan, XU Hailiang, WU Bin, YANG Pengnian, BAN Jingya, LIU Zeyi, LIU Kun, HAN Fanghong, MA Zhenghu, WANG Lu. Response of vegetation to climate change along the elevation gradient in High Mountain Asia. Journal of Arid Land, 2025, 17(9): 1215-1233.
URL:
http://jal.xjegi.com/10.1007/s40333-025-0087-6 OR http://jal.xjegi.com/Y2025/V17/I9/1215
|
|
|
| [1] |
Brun F, Berthier E, Wagnon P, et al. 2017. A spatially resolved estimate of High Mountain Asia glacier mass balances from 2000 to 2016. Nature Geoscience, 10(9): 668-673.
|
|
|
| [2] |
Cai Y T, Liu S T, Lin H. 2020. Monitoring the vegetation dynamics in the Dongting Lake wetland from 2000 to 2019 using the BEAST algorithm based on dense Landsat time series. Applied Sciences, 10(12): 4209, doi: 10.3390/app10124209.
|
|
|
| [3] |
Cao R, Jiang W G, Yuan L H, et al. 2014. Inter-annual variations in vegetation and their response to climatic factors in the upper catchments of the Yellow River from 2000 to 2010. Journal of Geographical Sciences, 24(6): 963-979.
doi: 10.1007/s11442-014-1131-1
|
|
|
| [4] |
Chen B Z, Xu G, Coops N C, et al. 2014. Changes in vegetation photosynthetic activity trends across the Asia-Pacific region over the last three decades. Remote Sensing of Environment, 144: 28-41.
|
|
|
| [5] |
Cui X L, Bai H Y, Wang T. 2013. Difference in NDVI with altitudinal gradient and temperature in Qinling area. Resources Science, 35(3): 618-626. (in Chinese)
|
|
|
| [6] |
Fang X Q, Zhu Q A, Ren L L, et al. 2018. Large-scale detection of vegetation dynamics and their potential drivers using MODIS images and BFAST: A case study in Quebec, Canada. Remote Sensing of Environment, 206: 391-402.
|
|
|
| [7] |
Feng K, Wang T, Liu S L, et al. 2021. Path analysis model to identify and analyse the causes of aeolian desertification in Mu Us Sandy Land, China. Ecological Indicators, 124: 107386, doi: 10.1016/j.ecolind.2021.107386.
|
|
|
| [8] |
Furian W, Loibl D, Schneider C. 2021. Future glacial lakes in High Mountain Asia: an inventory and assessment of hazard potential from surrounding slopes. Journal of Glaciology, 67(264): 653-670.
|
|
|
| [9] |
Gao M D, Piao S L, Chen A P, et al. 2019. Divergent changes in the elevational gradient of vegetation activities over the last 30 years. Nature Communications, 10(1): 2970, doi: 10.1038/s41467-019-11035-w.
|
|
|
| [10] |
Holben B N. 1986. Characteristics of maximum-value composite images from temporal AVHRR data. International Journal of Remote Sensing, 7(11): 1417-1434.
|
|
|
| [11] |
Li B G, Tao S. 2000. Correlation between AVHRR NDVI and climate factors. Acta Ecologica Sinica, 20(5): 898-902. (in Chinese)
|
|
|
| [12] |
Li H D, Li Y K, Shen W S, et al. 2015. Elevation-dependent vegetation greening of the Yarlungzangbo River basin in the southern Tibetan Plateau, 1999-2013. Remote Sensing, 7(12): 16672-16687.
|
|
|
| [13] |
Li N, Zhan P, Pan Y Z, et al. 2024. Quantifying uncertainty: The benefits of removing snow cover from remote sensing time series on the extraction of climate-influenced grassland phenology on the Qinghai-Tibet Plateau. Agricultural and Forest Meteorology, 345: 109862, doi: 10.1016/j.agrformet.2023.109862.
|
|
|
| [14] |
Li X P, Wang L, Guo X Y, et al. 2017. Does summer precipitation trend over and around the Tibetan Plateau depend on elevation? International Journal of Climatology, 37(Supp1.): 1278-1284.
|
|
|
| [15] |
Linscheid N, Estupinan-Suarez L M, Brenning A, et al. 2020. Towards a global understanding of vegetation-climate dynamics at multiple timescales. Biogeosciences, 17(4): 945-962.
doi: 10.5194/bg-17-945-2020
|
|
|
| [16] |
Liu C L, Li W L, Wang W Y, et al. 2021a. Quantitative spatial analysis of vegetation dynamics and potential driving factors in a typical alpine region on the northeastern Tibetan Plateau using the Google Earth Engine. CATENA, 206: 105500, doi: 10.1016/j.catena.2021.105500.
|
|
|
| [17] |
Liu L B, Wang Y, Wang Z, et al. 2019. Elevation-dependent decline in vegetation greening rate driven by increasing dryness based on three satellite NDVI datasets on the Tibetan Plateau. Ecological Indicators, 107: 105569, doi: 10.1016/j.ecolind.2019.105569.
|
|
|
| [18] |
Liu Y C, Li Z, Chen Y N. 2021b. Continuous warming shift greening towards browning in the Southeast and Northwest High Mountain Asia. Scientific Reports, 11(1): 17920, doi: 10.1038/s41598-021-97240-4.
|
|
|
| [19] |
Liu Y C, Li Z, Chen Y N, et al. 2022. Evaluation of consistency among three NDVI products applied to High Mountain Asia in 2000-2015. Remote Sensing of Environment, 269: 112821, doi: 10.1016/j.rse.2021.112821.
|
|
|
| [20] |
Ma L, Wang J R, Liu T X, et al. 2016. Response relationship between vegetation and climate factors in Horqin sandy land from 2000 to 2012. Transactions of the Chinese Society for Agricultural Machinery, 47(4): 162-172. (in Chinese)
|
|
|
| [21] |
Ma Y R, Guan Q Y, Sun Y F, et al. 2022. Three-dimensional dynamic characteristics of vegetation and its response to climatic factors in the Qilian Mountains. CATENA, 208: 105694, doi: 10.1016/j.catena.2021.105694.
|
|
|
| [22] |
Maina F Z, Kumar S V, Albergel C, et al. 2022. Warming, increase in precipitation, and irrigation enhance greening in High Mountain Asia. Communications Earth & Environment, 3: 43, doi: 10.1038/s43247-022-00374-0.
|
|
|
| [23] |
Mardian J, Berg A, Daneshfar B. 2021. Evaluating the temporal accuracy of grassland to cropland change detection using multitemporal image analysis. Remote Sensing of Environment, 255: 112292, doi: 10.1016/j.rse.2021.112292
|
|
|
| [24] |
Meng M, Niu Z, Ma C, et al. 2018. Variation trend of NDVI and response to climate change in Tibetan Plateau. Research of Soil and Water Conservation, 25(3): 360-365, 372. (in Chinese)
|
|
|
| [25] |
Mishra N B, Mainali K P. 2017. Greening and browning of the Himalaya: Spatial patterns and the role of climatic change and human drivers. Science of the Total Environment, 587-588: 326-339.
|
|
|
| [26] |
Morán-Tejeda E, López-Moreno J I, Sanmiguel-Vallelado A. 2017. Changes in climate, snow and water resources in the Spanish Pyrenees:observations and projections in a warming climate. In: Catalan J, Ninot J M, Aniz M M. High Mountain Conservation in a Changing World. Cham: Springer, 305-323.
|
|
|
| [27] |
Myneni R B, Keeling C D, Tucker C J, et al. 1997. Increased plant growth in the northern high latitudes from 1981 to 1991. Nature, 386(6626): 698-702.
|
|
|
| [28] |
Palazzi E, Filippi L, von Hardenberg J. 2017. Insights into elevation-dependent warming in the Tibetan Plateau-Himalayas from CMIP 5 model simulations. Climate Dynamics, 48(11): 3991-4008.
|
|
|
| [29] |
Peng W F, Kuang T T, Tao S. 2019. Quantifying influences of natural factors on vegetation NDVI changes based on geographical detector in Sichuan, western China. Journal of Cleaner Production, 233: 353-367.
|
|
|
| [30] |
Piao S L, Fang J Y, Zhou L M, et al. 2006. Variations in satellite-derived phenology in China's temperate vegetation. Global Change Biology, 12(4): 672-685.
|
|
|
| [31] |
Rani S, Mal S. 2022. Trends in land surface temperature and its drivers over the High Mountain Asia. The Egyptian Journal of Remote Sensing and Space Science, 25(3): 717-729.
|
|
|
| [32] |
Satti Z, Naveed M, Shafeeque M, et al. 2024. Investigating the impact of climate change on trend shifts of vegetation growth in Gilgit Baltistan. Global and Planetary Change, 232: 104341, doi: 10.1016/j.gloplacha.2023.104341.
|
|
|
| [33] |
Shao W Y, Wang Q Z, Guan Q Y, et al. 2022. Distribution of soil available nutrients and their response to environmental factors based on path analysis model in arid and semi-arid area of northwest China. Science of the Total Environment, 827: 154254, doi: 10.1016/j.scitotenv.2022.154254.
|
|
|
| [34] |
Shen M G, Zhang G X, Cong N, et al. 2014. Increasing altitudinal gradient of spring vegetation phenology during the last decade on the Qinghai-Tibetan Plateau. Agricultural and Forest Meteorology, 189-190: 71-80.
|
|
|
| [35] |
Shen M G, Piao S L, Chen X Q, et al. 2016. Strong impacts of daily minimum temperature on the green-up date and summer greenness of the Tibetan Plateau. Global Change Biology, 22(9): 3057-3066.
doi: 10.1111/gcb.13301
pmid: 27103613
|
|
|
| [36] |
Sun F, Chen Y N, Li Y P, et al. 2022. Incorporating relative humidity improves the accuracy of precipitation phase discrimination in High Mountain Asia. Atmospheric Research, 271: 106094, doi: 10.1016/j.atmosres.2022.106094.
|
|
|
| [37] |
Tai X L, Epstein H E, Li B. 2020. Elevation and climate effects on vegetation greenness in an arid mountain-basin system of Central Asia. Remote Sensing, 12(10): 1665, doi: 10.3390/rs12101665.
|
|
|
| [38] |
Tao J, Xu T Q, Dong J W, et al. 2018. Elevation-dependent effects of climate change on vegetation greenness in the high mountains of southwest China during 1982-2013. International Journal of Climatology, 38(4): 2029-2038.
|
|
|
| [39] |
Verdhen A, Chahar B R, Ganju A, et al. 2016. Modeling snow line altitudes in the Himalayan Watershed. Journal of Hydrologic Engineering, 21(1): 04015056, doi: 10.1061/(ASCE)HE.1943-5584.0001255.
|
|
|
| [40] |
Wang Y J, Fu B J, Liu Y X, et al. 2021a. Response of vegetation to drought in the Tibetan Plateau: Elevation differentiation and the dominant factors. Agricultural and Forest Meteorology, 306: 108468, doi: 10.1016/j.agrformet.2021.108468.
|
|
|
| [41] |
Wang Y J, Shen X J, Jiang M, et al. 2021b. Spatiotemporal change of aboveground biomass and its response to climate change in marshes of the Tibetan Plateau. International Journal of Applied Earth Observation and Geoinformation, 102: 102385, doi: 10.1016/j.jag.2021.102385.
|
|
|
| [42] |
Wen Z F, Wu S J, Chen J L, et al. 2017. NDVI indicated long-term interannual changes in vegetation activities and their responses to climatic and anthropogenic factors in the Three Gorges Reservoir Region, China. Science of the Total Environment, 574: 947-959.
|
|
|
| [43] |
Xie S D, Mo X G, Hu S, et al. 2020. Responses of vegetation greenness to temperature and precipitation in the Three-North Shelter Forest Program. Geographical Research, 39(1): 152-165. (in Chinese)
|
|
|
| [44] |
Xu X K, Chen H, Levy J K. 2008. Spatiotemporal vegetation cover variations in the Qinghai-Tibet Plateau under global climate change. Science Bulletin, 53(6): 915-922.
|
|
|
| [45] |
Yan L K. 2003. Application of correlation coefficient and biased correlation coefficient in related analysis. Journal of Yunnan University of Finance and Economics, 19(3): 78-80. (in Chinese)
|
|
|
| [46] |
Yang X L, Ding W K, Zhou H, et al. 2024. Normalized difference vegetation index change and its driving factors in Shiyang River Basin. Arid Land Geography, 47(10): 1735-1744. (in Chinese)
doi: 10.12118/j.issn.1000-6060.2024.036
|
|
|
| [47] |
Zhang L, Shen M G, Yang Z Y, et al. 2024. Spatial variations in the difference in elevational shifts between greenness and temperature isolines across the Tibetan Plateau grasslands under warming. Science of the Total Environment, 906: 167715, doi: 10.1016/j.scitotenv.2023.167715.
|
|
|
| [48] |
Zhang Y, Feng X M, Fu B J, et al. 2021. Satellite-observed global terrestrial vegetation production in response to water availability. Journal of Hydrology, 13(7): 1289, doi: 10.3390/rs13071289.
|
|
|
| [49] |
Zhao K G, Wulder M A, Hu T X, et al. 2019. Detecting change-point, trend, and seasonality in satellite time series data to track abrupt changes and nonlinear dynamics: A Bayesian ensemble algorithm. Remote Sensing of Environment, 232: 111181, doi: 10.1016/j.rse.2019.04.034.
|
|
|
| [50] |
Zhao L, Dai A G, Dong B. 2018. Changes in global vegetation activity and its driving factors during 1982-2013. Agricultural and Forest Meteorology, 249: 198-209.
|
|
|
| [51] |
Zhou L M, Tian Y H, Myneni R B, et al. 2014. Widespread decline of Congo rainforest greenness in the past decade. Nature, 509(7498): 86-90.
|
|
|
| [52] |
Zhuang Q W, Wu S X, Feng X Y, et al. 2020. Analysis and prediction of vegetation dynamics under the background of climate change in Xinjiang, China. PeerJ, 8: e8282, doi: 10.7717/peerj.8282.
|
|
|
|
Viewed |
|
|
|
Full text
|
|
|
|
|
Abstract
|
|
|
|
|
Cited |
|
|
|
|
| |
Shared |
|
|
|
|
| |
Discussed |
|
|
|
|