| Research article |
|


|
|
|
| Land use/cover change and ecological network in Gansu Province, China during 2000-2020 and their simulations in 2050 |
MA Xinshu1, XIN Cunlin1,*( ), CHEN Ning1, XIN Shunjie2, CHEN Hongxiang1, ZHANG Bo1, KANG Ligang1, WANG Yu1, JIAO Jirong3 ), CHEN Ning1, XIN Shunjie2, CHEN Hongxiang1, ZHANG Bo1, KANG Ligang1, WANG Yu1, JIAO Jirong3 |
1College of Geography and Environmental Science, Northwest Normal University, Lanzhou 730070, China
2College of Earth and Environment Science, Lanzhou University, Lanzhou 730030, China
3School of Architecture and Urban Planning, Lanzhou Jiaotong University, Lanzhou 730070, China |
|
|
|
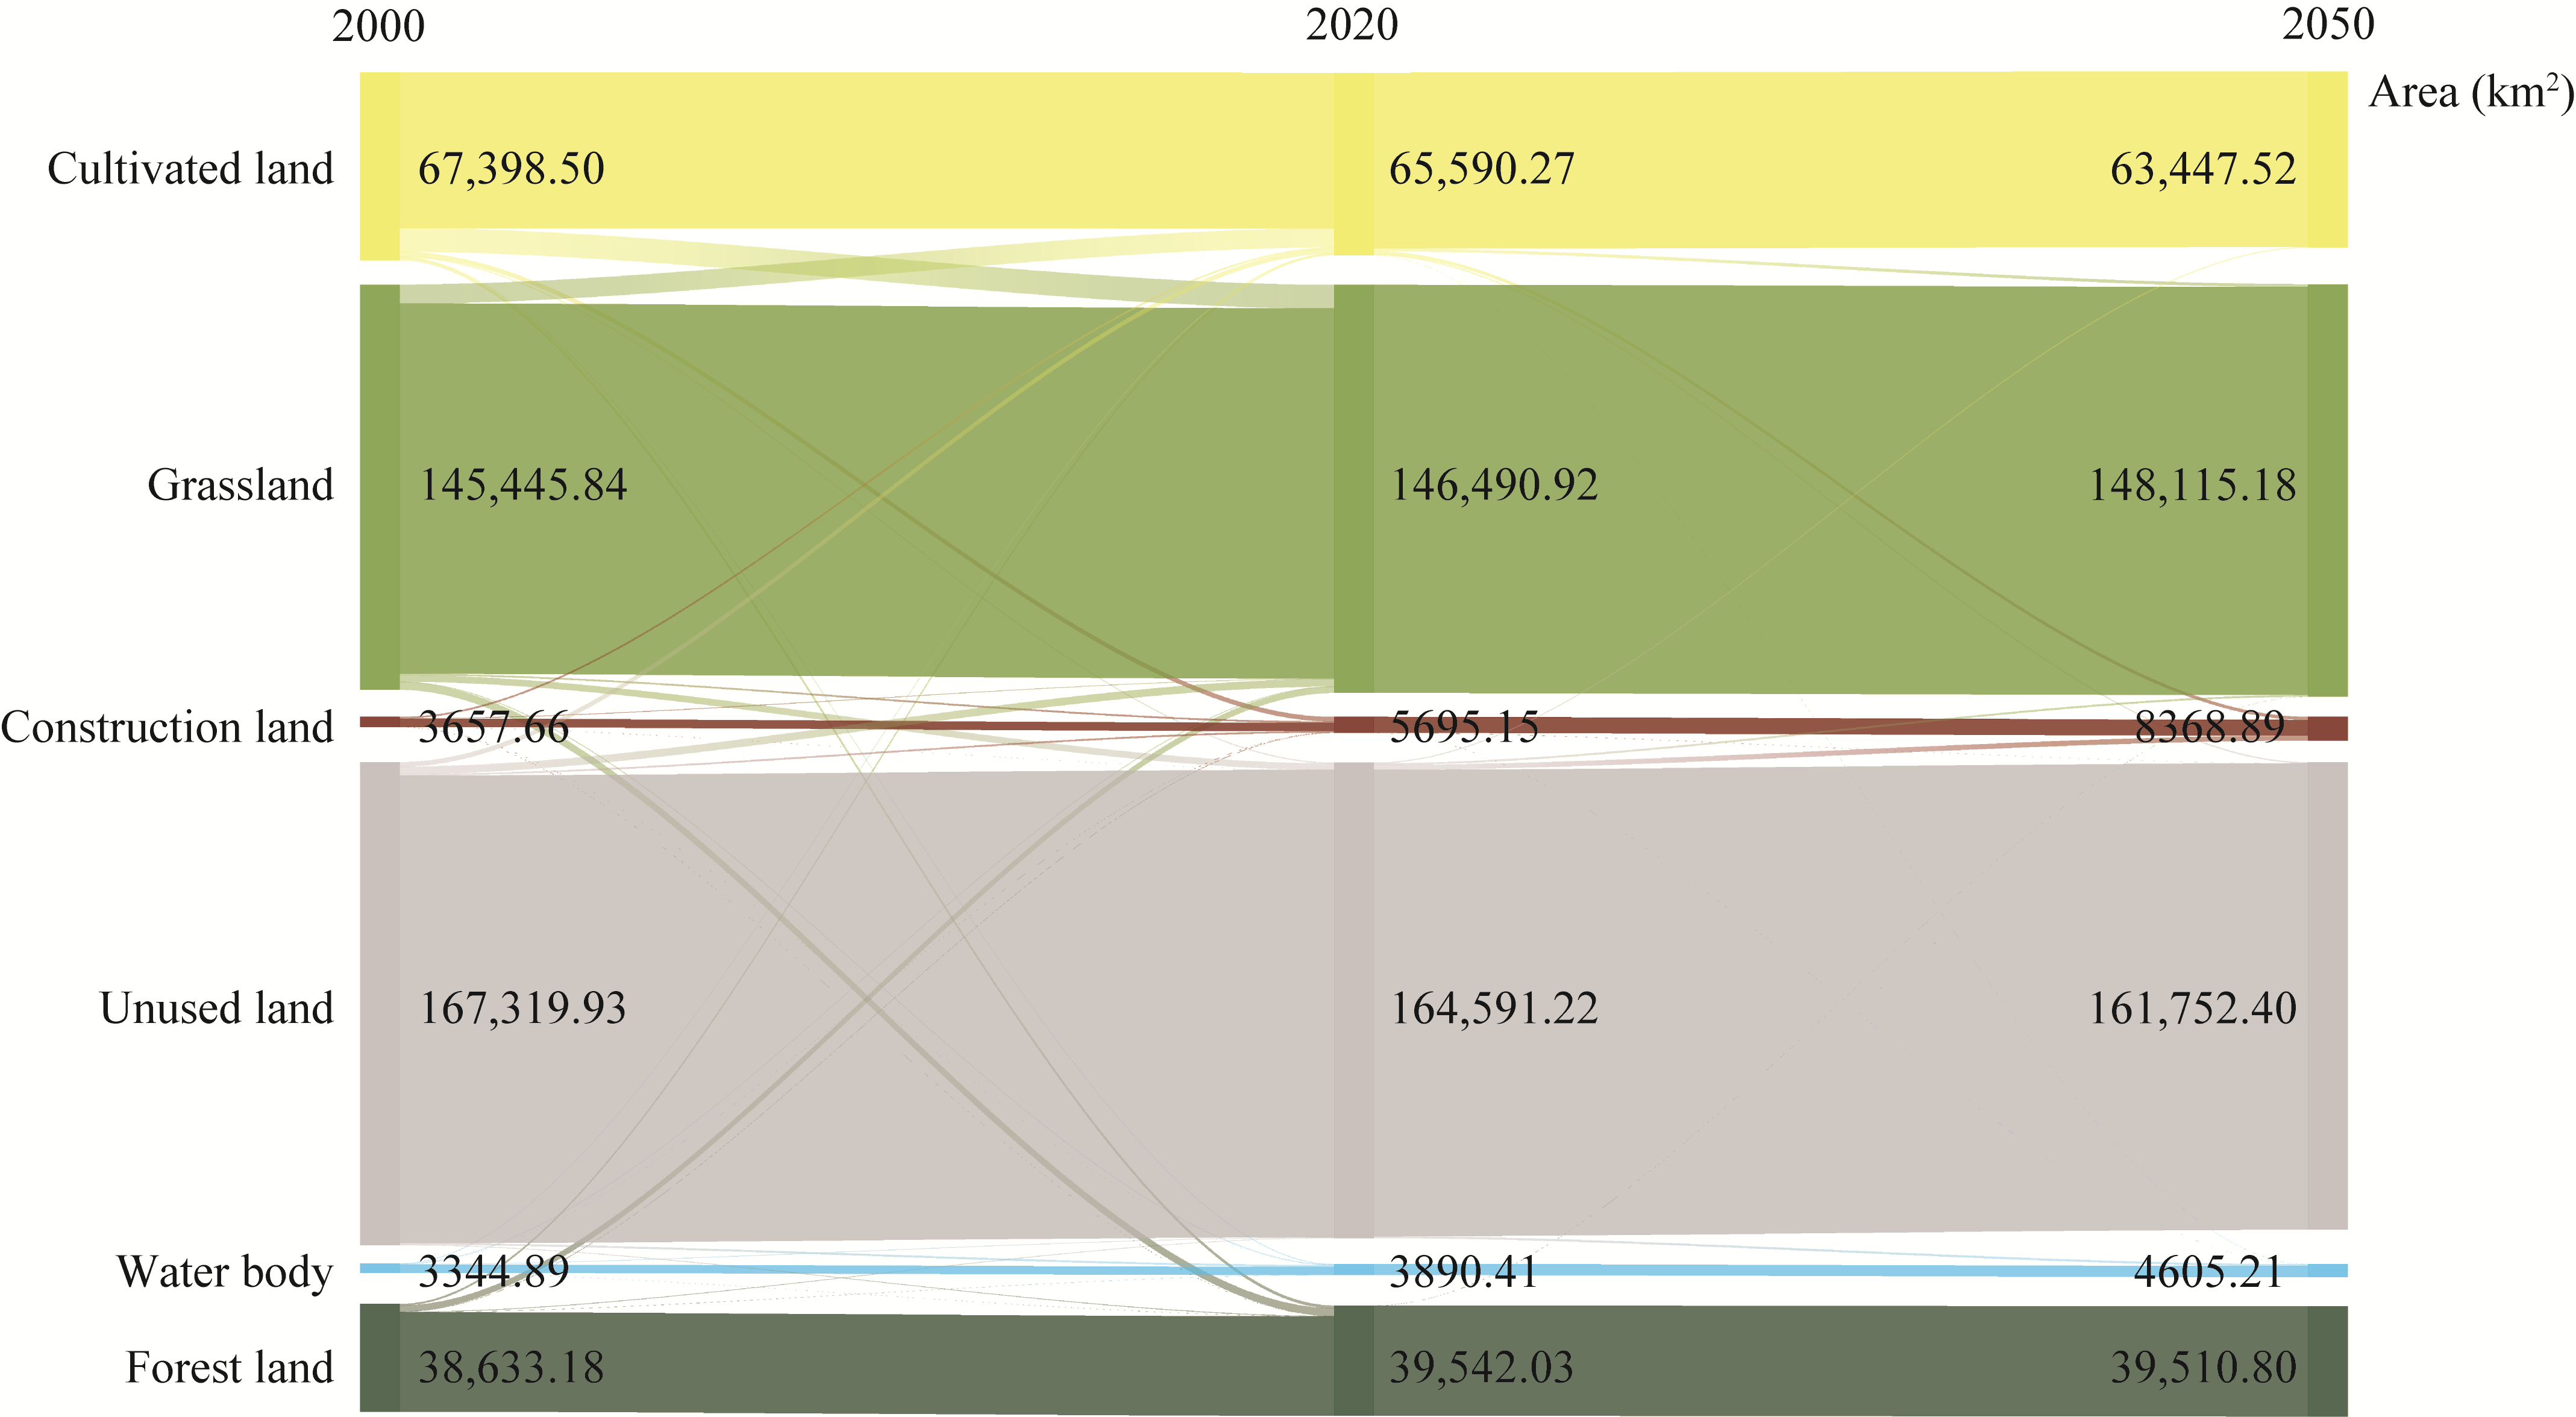
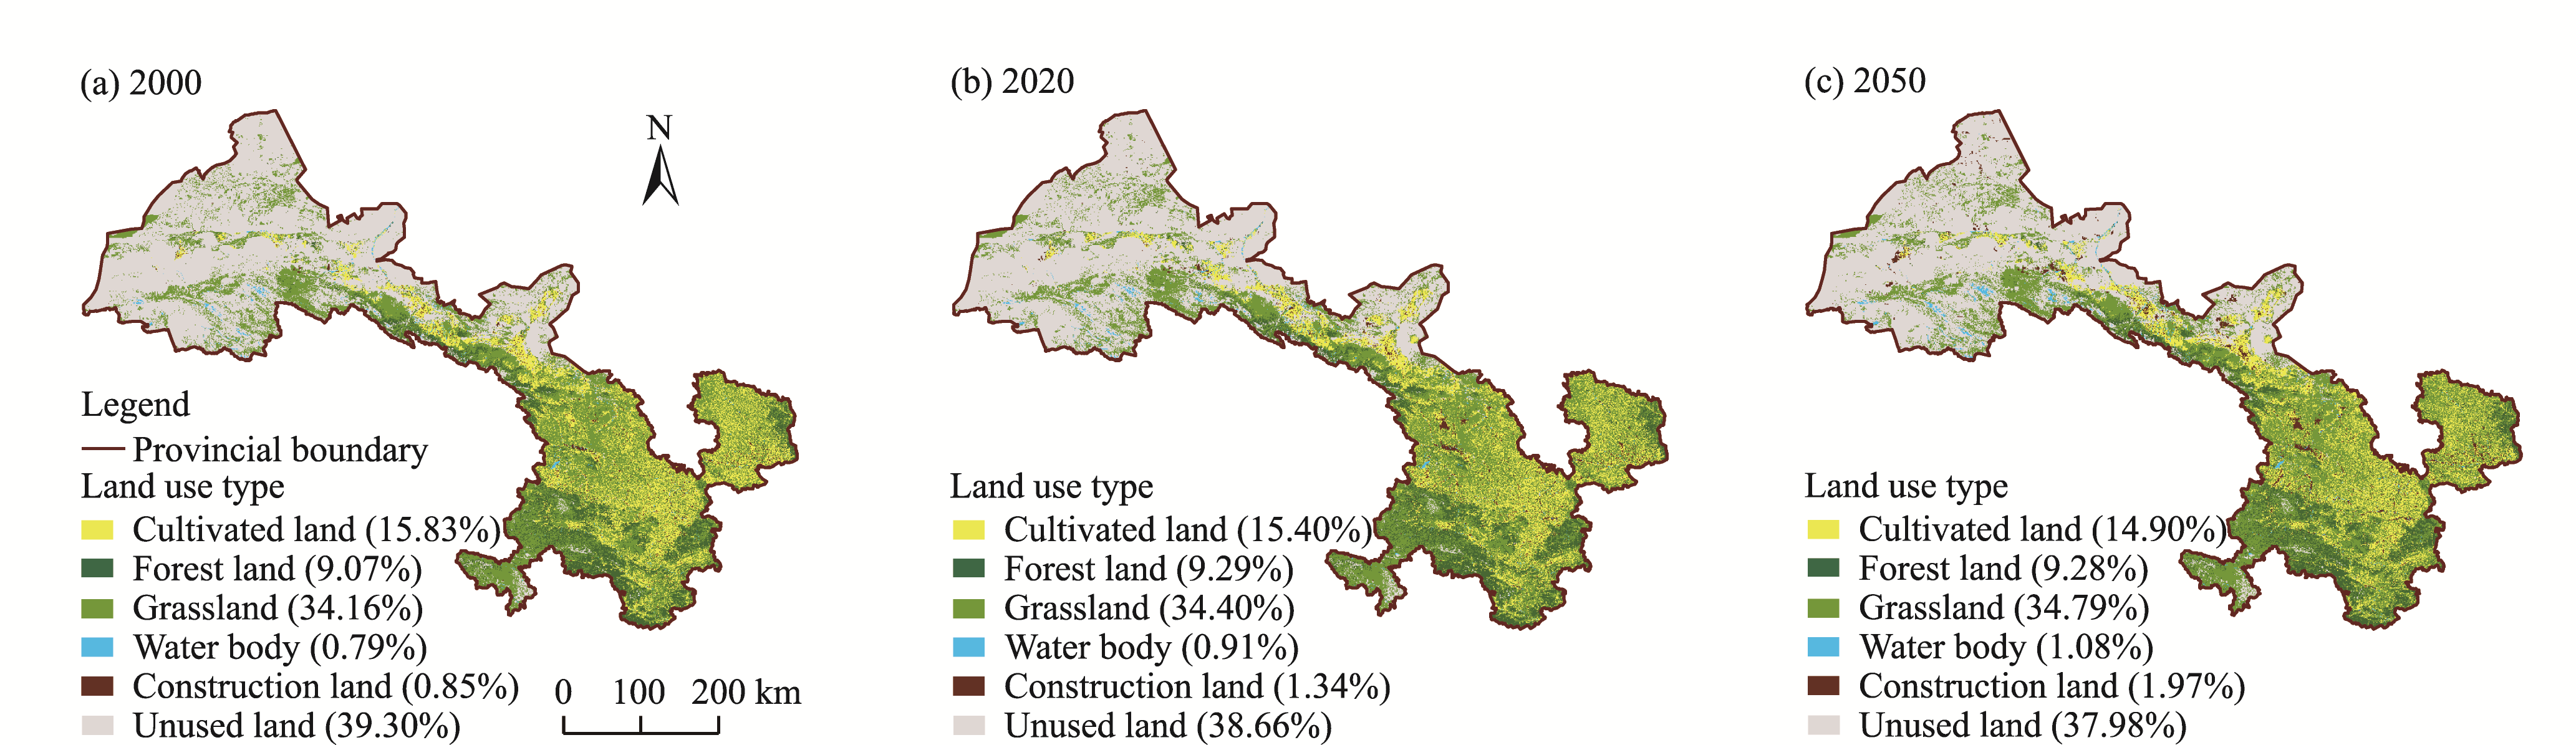
Abstract Land use/cover change (LUCC) constitutes the spatial and temporal patterns of ecological security, and the construction of ecological networks is an effective way to ensure ecological security. Exploring the spatial and temporal change characteristics of ecological network and analyzing the integrated relationship between LUCC and ecological security are crucial for ensuring regional ecological security. Gansu is one of the provinces with fragile ecological environment in China, and rapid changes in land use patterns in recent decades have threatened ecological security. Therefore, taking Gansu Province as the study area, this study simulated its land use pattern in 2050 using patch-generating land use simulation (PLUS) model based on the LUCC trend from 2000 to 2020 and integrated the LUCC into morphological spatial pattern analysis (MSPA) to identify ecological sources and extract the ecological corridors to construct ecological network using circuit theory. The results revealed that, according to the prediction results in 2050, the areas of cultivated land, forest land, grassland, water body, construction land, and unused land would be 63,447.52, 39,510.80, 148,115.18, 4605.21, 8368.89, and 161,752.40 km2, respectively. The number of ecological sources in Gansu Province would increase to 80, with a total area of 99,927.18 km2. The number of ecological corridors would increase to 191, with an estimated total length of 6120.66 km. Both ecological sources and ecological corridors showed a sparse distribution in the northwest and dense distribution in the southeast of the province at the spatial scale. The number of ecological pinch points would reach 312 and the total area would expect to increase to 842.84 km2, with the most pronounced increase in the Longdong region. Compared with 2020, the number and area of ecological barriers in 2050 would decrease significantly by 63 and 370.71 km2, respectively. In general, based on the prediction results, the connectivity of ecological network of Gansu Province would increase in 2050. To achieve the predicted ecological network in 2050, emphasis should be placed on the protection of cultivated land and ecological land, the establishment of ecological sources in desert areas, the reinforcement of the protection for existing ecological sources, and the construction of ecological corridors to enhance the stability of ecological network. This study provides valuable theoretical support and references for the future construction of ecological networks and regional land resource management decision-making.
|
|
Received: 03 July 2024
Published: 31 January 2025
|
|
Corresponding Authors:
*XIN Cunlin (E-mail: xincunling@163.com)
|
| Cite this article:
MA Xinshu, XIN Cunlin, CHEN Ning, XIN Shunjie, CHEN Hongxiang, ZHANG Bo, KANG Ligang, WANG Yu, JIAO Jirong. Land use/cover change and ecological network in Gansu Province, China during 2000-2020 and their simulations in 2050. Journal of Arid Land, 2025, 17(1): 43-57.
URL:
http://jal.xjegi.com/10.1007/s40333-025-0092-9 OR http://jal.xjegi.com/Y2025/V17/I1/43
|
|
|
| [1] |
Aminzadeh B, Khansefid M. 2010. A case study of urban ecological networks and a sustainable city: Tehran's metropolitan area. Urban Ecosystems, 13: 23-36.
|
|
|
| [2] |
An Y, Liu S L, Sun Y X, et al. 2021. Construction and optimization of an ecological network based on morphological spatial pattern analysis and circuit theory. Landscape Ecology, 36: 2059-2076.
|
|
|
| [3] |
Bryan B A, Gao L, Ye Y Q, et al. 2018. China's response to a national land-system sustainability emergency. Nature, 559: 193-204.
|
|
|
| [4] |
Chen Q B, Ning Y. 2024. Projecting LUCC dynamics and ecosystem services in an emerging urban agglomeration under SSP-RCP scenarios and their management implications. Science of the Total Environment, 949: 175100, doi: 10.1016/j.scitotenv.2024.175100.
|
|
|
| [5] |
Chen X Q, Kang B Y, Lei M Y, et al. 2023. Identification of priority areas for territorial ecological conservation and restoration based on ecological networks: A case study of Tianjin City, China. Ecological Indicators, 146: 109809, doi: 10.1016/j.ecolind.2022.109809.
|
|
|
| [6] |
Cui L, Wang J, Sun L, et al. 2020. Construction and optimization of green space ecological networks in urban fringe areas: A case study with the urban fringe area of Tongzhou District in Beijing. Journal of Cleaner Production, 276: 124266, doi: 10.1016/j.jclepro.2020.124266.
|
|
|
| [7] |
Cui X F, Deng W, Yang J X, et al. 2022. Construction and optimization of ecological security patterns based on social equity perspective: A case study in Wuhan, China. Ecological Indicators, 136: 108714, doi: 10.1016/j.ecolind.2022.108714.
|
|
|
| [8] |
Dickson B G, Albano C M, Anantharaman R, et al. 2019. Circuit‐theory applications to connectivity science and conservation. Conservation Biology, 33(2): 239-249.
doi: 10.1111/cobi.13230
pmid: 30311266
|
|
|
| [9] |
Fan F F, Liu Y X, Chen J X, et al. 2021. Scenario-based ecological security patterns to indicate landscape sustainability: a case study on the Qinghai-Tibet Plateau. Landscape Ecology, 36: 2175-2188.
|
|
|
| [10] |
Fu Q, Hou Y, Wang B, et al. 2018. Scenario analysis of ecosystem service changes and interactions in a mountain-oasis-desert system: a case study in Altay Prefecture, China. Scientific Reports, 8: 12939, doi: 10.1038/s41598-018-31043-y.
pmid: 30154514
|
|
|
| [11] |
Gao L N, Tao F, Liu R R, et al. 2022. Multi-scenario simulation and ecological risk analysis of land use based on the PLUS model: A case study of Nanjing. Sustainable Cities and Society, 85: 104055, doi: 10.1016/j.scs.2022.104055.
|
|
|
| [12] |
Guo Z C, Xie Y W, Guo H, et al. 2023. Do the ecosystems of Gansu Province in Western China's crucial ecological security barrier remain vulnerable? Evidence from remote sensing based on geospatial analysis. Journal of Cleaner Production, 402: 136740, doi: 10.1016/j.jclepro.2023.136740.
|
|
|
| [13] |
Hou W, Zhou W, Li J Y, et al. 2022. Simulation of the potential impact of urban expansion on regional ecological corridors: A case study of Taiyuan, China. Sustainable Cities and Society, 83: 103933, doi: 10.1016/j.scs.2022.103933.
|
|
|
| [14] |
Islam S, Li Y C, Ma M G, et al. 2021. Simulation and prediction of the spatial dynamics of land use changes modelling through CLUE-S in the southeastern region of Bangladesh. Journal of the Indian Society of Remote Sensing, 49: 2755-2777.
|
|
|
| [15] |
Jia Q Q, Jiao L M, Lian X H, et al. 2023. Linking supply-demand balance of ecosystem services to identify ecological security patterns in urban agglomerations. Sustainable Cities and Society, 92: 104497, doi: 10.1016/j.scs.2023.104497.
|
|
|
| [16] |
Jiang H P, Guo H D, Sun Z C, et al. 2023. Urban-rural disparities of carbon storage dynamics in China's human settlements driven by population and economic growth. Science of the Total Environment, 871: 162092, doi: 10.1016/j.scitotenv.2023.162092.
|
|
|
| [17] |
Kang J M, Qing Y X, Lu W. 2023. Construction and optimization of the Saihanba ecological network. Ecological Indicators, 153: 110401, doi: 10.1016/j.ecolind.2023.110401.
|
|
|
| [18] |
Kucsicsa G, Popovici E-A, Bălteanu D, et al. 2019. Future land use/cover changes in Romania: regional simulations based on CLUE-S model and CORINE land cover database. Landscape and Ecological Engineering, 15: 75-90.
|
|
|
| [19] |
Li C, Wu Y M, Gao B P, et al. 2021a. Multi-scenario simulation of ecosystem service value for optimization of land use in the Sichuan-Yunnan ecological barrier, China. Ecological Indicators, 132: 108328, doi: 10.1016/j.ecolind.2021.108328.
|
|
|
| [20] |
Li L, Huang X J, Wu D F, et al. 2022. Optimization of ecological security patterns considering both natural and social disturbances in China's largest urban agglomeration. Ecological Engineering, 180: 106647, doi: 10.1016/j.ecoleng.2022.106647.
|
|
|
| [21] |
Li L, Huang X J, Wu D F, et al. 2023a. Construction of ecological security pattern adapting to future land use change in Pearl River Delta, China. Applied Geography, 154: 102946, doi: 10.1016/j.apgeog.2023.102946.
|
|
|
| [22] |
Li Y G, Liu W, Feng Q, et al. 2023b. The role of land use change in affecting ecosystem services and the ecological security pattern of the Hexi Regions, Northwest China. Science of the Total Environment, 855: 158940, doi: 10.1016/j.scitotenv.2022.158940.
|
|
|
| [23] |
Li Z X, Feng Q, Li Z J, et al. 2021b. Reversing conflict between humans and the environment—The experience in the Qilian Mountains. Renewable and Sustainable Energy Reviews, 148: 111333, doi: 10.1016/j.rser.2021.111333.
|
|
|
| [24] |
Lian H G, Liu C F, Ni B W, et al. 2024. Construction and optimization of the ecological network of natural reserves system in the northwestern arid region: A case study of the Hexi Corridor. Chinese Journal of Applied Ecology, doi: 10.13287/j.1001-9332.202501.02. (in Chinese)
|
|
|
| [25] |
Liang X, Liu X P, Li D, et al. 2018. Urban growth simulation by incorporating planning policies into a CA-based future land-use simulation model. International Journal of Geographical Information Science, 32(11): 2294-2316.
|
|
|
| [26] |
Liang X, Guan Q F, Clarke K C, et al. 2021. Understanding the drivers of sustainable land expansion using a patch-generating land use simulation (PLUS) model: A case study in Wuhan, China. Computers, Environment and Urban Systems, 85: 101569, doi: 10.1016/j.compenvurbsys.2020.101569.
|
|
|
| [27] |
Liu H L, Wang Z L, Zhang L P, et al. 2023. Construction of an ecological security network in the Fenhe River Basin and its temporal and spatial evolution characteristics. Journal of Cleaner Production, 417: 137961, doi: 10.1016/j.jclepro.2023.137961.
|
|
|
| [28] |
Liu J M, Pei X T, Yu W J, et al. 2024. How much carbon storage will loss in a desertification area? Multiple policy scenario analysis from Gansu Province. Science of the Total Environment, 913: 169668, doi: 10.1016/j.scitotenv.2023.169668.
|
|
|
| [29] |
Liu J Y, Zhang Z X, Xu X L, et al. 2010. Spatial patterns and driving forces of land use change in China during the early 21st century. Journal of Geographical Sciences, 20: 483-494.
|
|
|
| [30] |
Men D, Pan J H. 2023. Incorporating network topology and ecosystem services into the optimization of ecological network: A case study of the Yellow River Basin. Science of the Total Environment, 912: 169004, doi: 10.1016/j.scitotenv.2023.169004.
|
|
|
| [31] |
Modica G, Praticò S, Laudari L, et al. 2021. Implementation of multispecies ecological networks at the regional scale: analysis and multi-temporal assessment. Journal of Environmental Management, 289: 112494, doi: 10.1016/j.jenvman.2021.112494.
|
|
|
| [32] |
Mondal M S, Sharma N, Garg P K, et al. 2016. Statistical independence test and validation of CA Markov land use land cover (LULC) prediction results. The Egyptian Journal of Remote Sensing and Space Science, 19(2): 259-272.
|
|
|
| [33] |
Nie W B, Shi Y, Siaw M J, et al. 2021. Constructing and optimizing ecological network at county and town scale: The case of Anji County, China. Ecological Indicators, 132: 108294, doi: 10.1016/j.ecolind.2021.108294.
|
|
|
| [34] |
Opdam P, Steingröver E, van Rooij S. 2006. Ecological networks: A spatial concept for multi-actor planning of sustainable landscapes. Landscape and Urban Planning, 75(3-4): 322-332.
|
|
|
| [35] |
Pan J H, Wang Y M, Zhang Z. 2023. Identification and optimization of ecological network in arid inland river basin using MSPA and spatial syntax: a case study of Shule River Basin, NW China. Land, 12(2): 292, doi: 10.3390/land12020292.
|
|
|
| [36] |
Peng J, Yang Y, Liu Y, et al. 2018. Linking ecosystem services and circuit theory to identify ecological security patterns. Science of the Total Environment, 644: 781-790.
|
|
|
| [37] |
Popescu O-C, Tache A-V, Petrișor A-I. 2022. Methodology for identifying ecological corridors: a spatial planning perspective. Land, 11(7): 1013, doi: 10.3390/land11071013.
|
|
|
| [38] |
Qiu S, Fang M Z, Yu Q, et al. 2023. Study of spatialtemporal changes in Chinese forest eco-space and optimization strategies for enhancing carbon sequestration capacity through ecological spatial network theory. Science of the Total Environment, 859(Part 1): 160035, doi: 10.1016/j.scitotenv.2022.160035.
|
|
|
| [39] |
Ran Y J, Lei D M, Li J, et al. 2022. Identification of crucial areas of territorial ecological restoration based on ecological security pattern: A case study of the central Yunnan urban agglomeration, China. Ecological Indicators, 143: 109318, doi: 10.1016/j.ecolind.2022.109318.
|
|
|
| [40] |
Shi F N, Liu S L, An Y, et al. 2020. Spatio-temporal dynamics of landscape connectivity and ecological network construction in Long Yangxia Basin at the upper Yellow River. Land, 9(8): 265, doi: 10.3390/land9080265.
|
|
|
| [41] |
Théau J, Bernier A, Fournier R A. 2015. An evaluation framework based on sustainability-related indicators for the comparison of conceptual approaches for ecological networks. Ecological Indicators, 52: 444-457.
|
|
|
| [42] |
Wang J J, Liu Z P, Gao J L, et al. 2021a. The Grain for Green project eliminated the effect of soil erosion on organic carbon on China's Loess Plateau between 1980 and 2008. Agriculture, Ecosystems & Environment, 322: 107636, doi: 10.1016/j.agee.2021.107636.
|
|
|
| [43] |
Wang M M, Jiang Z Z, Li T B, et al. 2023a. Analysis on absolute conflict and relative conflict of land use in Xining Metropolitan Area under different scenarios in 2030 by PLUS and PFCI. Cities, 137: 104314, doi: 10.1016/j.cities.2023.104314.
|
|
|
| [44] |
Wang N N, Zhao Y. 2024. Construction of an ecological security pattern in Jiangnan water network area based on an integrated Approach: A case study of Gaochun, Nanjing. sEcological Indicators, 158: 111314, doi: 10.1016/j.ecolind.2023.111314.
|
|
|
| [45] |
Wang Q Z, Guan Q Y, Sun Y F, et al. 2023b. Simulation of future land use/cover change (LUCC) in typical watersheds of arid regions under multiple scenarios. Journal of Environmental Management, 335: 117543, doi: 10.1016/j.jenvman.2023.117543.
|
|
|
| [46] |
Wang S, Wu M Q, Hu M M, et al. 2021b. Promoting landscape connectivity of highly urbanized area: An ecological network approach. Ecological Indicators, 125: 107487, doi: 10.1016/j.ecolind.2021.107487.
|
|
|
| [47] |
Wang S T, Bai X M, Zhang X L, et al. 2021c. Urbanization can benefit agricultural production with large-scale farming in China. Nature Food, 2: 183-191.
|
|
|
| [48] |
Wu J S, Zhang L Q, Peng J, et al. 2013. The integrated recognition of the source area of the urban ecological security pattern in Shenzhen. Acta Ecological Sinica, 33(13): 4125-4133. (in Chinese)
|
|
|
| [49] |
Xiang H X, Zhang J, Mao D H, et al. 2023. Optimizing ecological security patterns considering zonal vegetation distribution for regional sustainability. Ecological Engineering, 194: 107055, doi: 10.1016/j.ecoleng.2023.107055.
|
|
|
| [50] |
Xu L F, Liu X, Tong D, et al. 2022. Forecasting urban land use change based on cellular automata and the PLUS Model. Land, 11(5): 652, doi: 10.3390/land11050652.
|
|
|
| [51] |
Ying B, Liu T, Ke l, et al. 2023. Identifying the landscape security pattern in karst rocky desertification area based on ecosystem services and ecological ensitivity: a case tudy of Guanling County, Guizhou Province. Forests, 14(3): 613, doi: 10.3390/f14030613
|
|
|
| [52] |
Yin Z L, Feng Q, Zhu R, et al. 2023. Analysis and prediction of the impact of land use/cover change on ecosystem services value in Gansu Province, China. Ecological Indicators, 154: 110868, doi: 10.1016/j.ecolind.2023.110868.
|
|
|
| [53] |
Yu H C, Huang J, Ji C N, et al. 2021. Construction of a landscape ecological network for a large-scale energy and chemical industrial base: a case study of Ningdong, China. Land, 10(4): 344, doi: 10.3390/land10040344.
|
|
|
| [54] |
Yu Q, Yue D P, Wang J P, et al. 2017. The optimization of urban ecological infrastructure network based on the changes of county landscape patterns: a typical case study of ecological fragile zone located at Deng Kou (Inner Mongolia). Journal of Cleaner Production, 163: S54-S67.
|
|
|
| [55] |
Zeng W, Tang H, Liang X, et al. 2023. Using ecological security pattern to identify priority protected areas: A case study in the Wuhan Metropolitan Area, China. Ecological Indicators, 148: 110121, doi: 10.1016/j.ecolind.2023.110121.
|
|
|
| [56] |
Zhang S H, Zhong Q L, Cheng D L, et al. 2022. Landscape ecological risk projection based on the PLUS model under the localized shared socioeconomic pathways in the Fujian Delta region. Ecological Indicators, 136: 108642, doi: 10.1016/j.ecolind.2022.108642.
|
|
|
| [57] |
Zhang Z, Wang Q, Feng Y G, et al. 2024. The spatio-temporal evolution of spatial structure and supply-demand relationships of the ecological network in the Yellow River Delta region of China. Journal of Cleaner Production, 471: 143388, doi: 10.1016/j.jclepro.2024.143388.
|
|
|
| [58] |
Zhao M M, He Z B, Du J, et al. 2019. Assessing the effects of ecological engineering on carbon storage by linking the CA-Markov and InVEST models. Ecological Indicators, 98: 29-38.
|
|
|
| [59] |
Zheng H W, Shen G Q, Wang H, et al. 2015. Simulating land use change in urban renewal areas: A case study in Hong Kong. Habitat International, 46: 23-34.
|
|
|
| [60] |
Zhou D, Song W. 2021. Identifying ecological corridors and networks in mountainous areas. International Journal of Environmental Research and Public Health, 18(9): 4797, doi: 10.3390/ijerph18094797.
|
|
|
|
Viewed |
|
|
|
Full text
|
|
|
|
|
Abstract
|
|
|
|
|
Cited |
|
|
|
|
| |
Shared |
|
|
|
|
| |
Discussed |
|
|
|
|