| Research article |
|


|
|
|
| Effects of wetland connectivity on plant communities and vegetation patterns in the Qaidam Basin |
YUE Yifan1, MA Dengke2,3, MA Yuanyuan2,3, KANG Wenrong2,3, ZHOU Guoying4, ZHAO Wenzhi2,*( ) ) |
1 School of Forestry and Grassland Science, Ningxia University, Yinchuan 750021, China
2 Linze Inland River Basin Research Station, Northwest Institute of Eco-Environment and Resources, Chinese Academy of Sciences, Lanzhou 730000, China
3 University of Chinese Academy of Sciences, Beijing 100049, China
4 Northwest Institute of Plateau Biology, Chinese Academy of Sciences, Qinghai 810008, China |
|
|
|
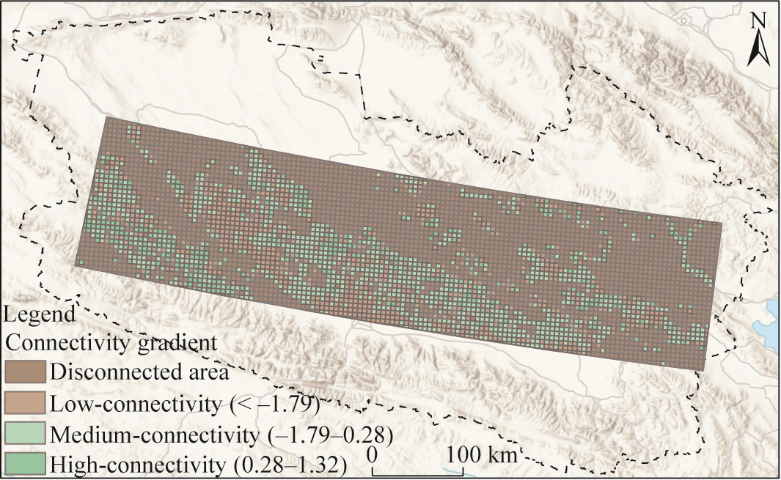
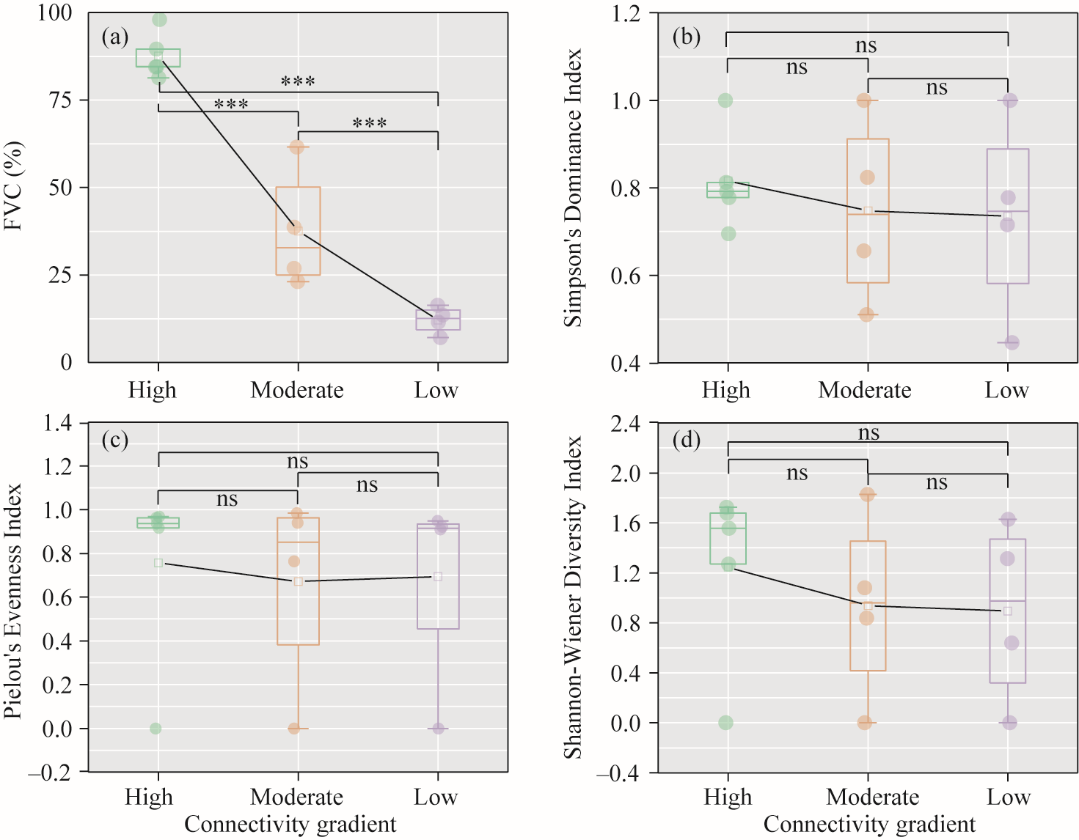
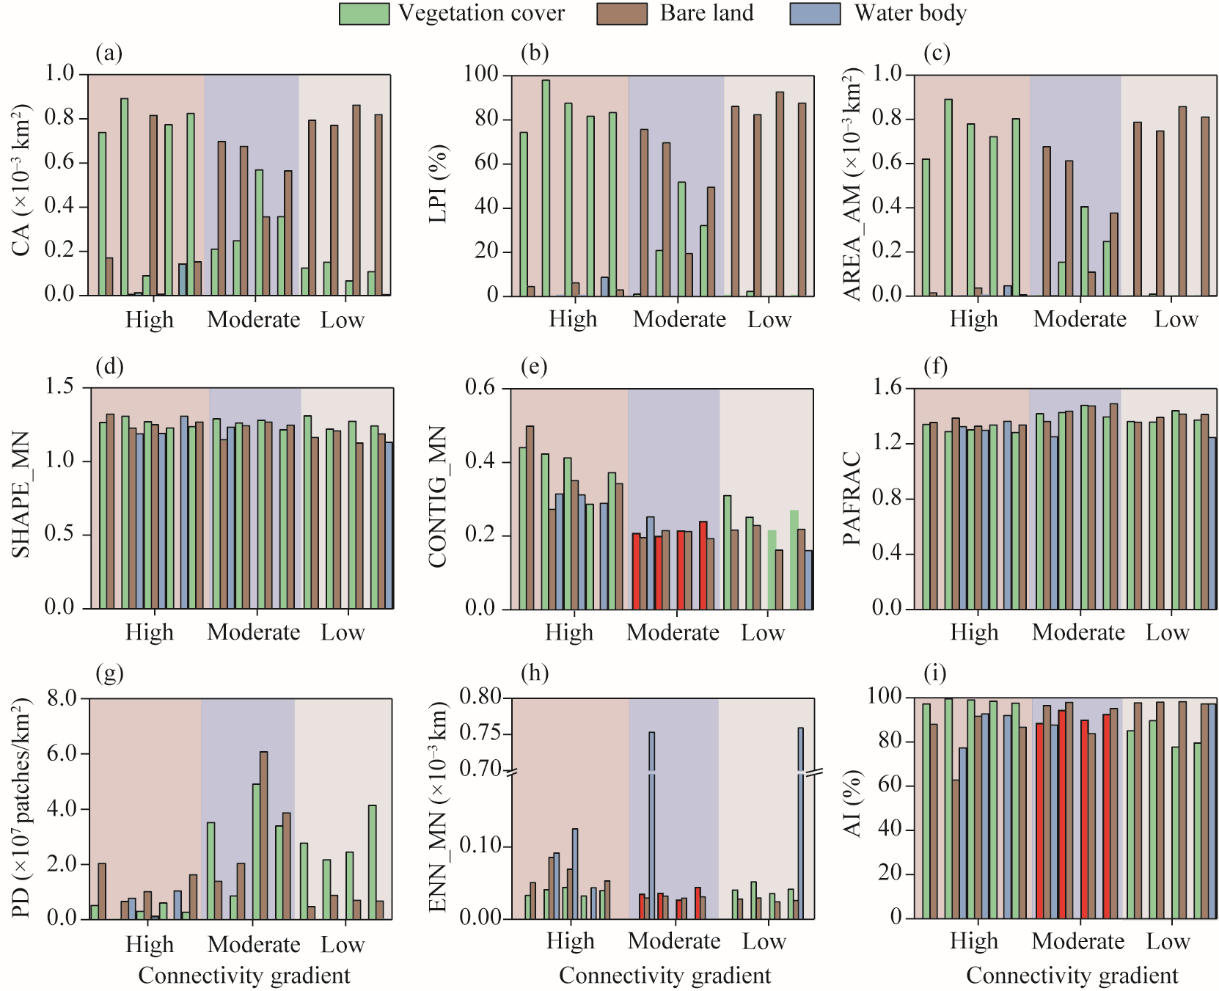
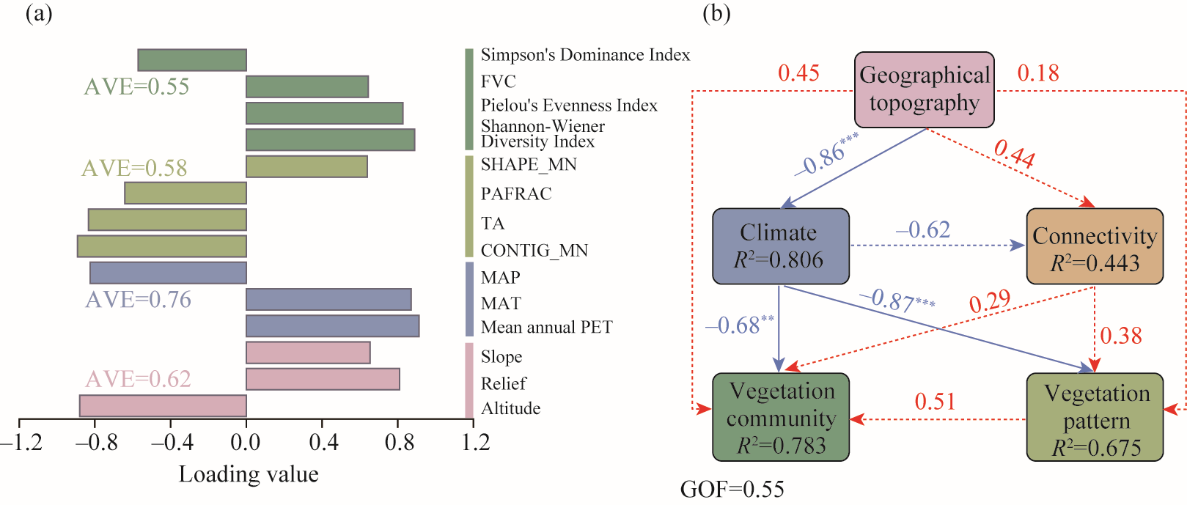
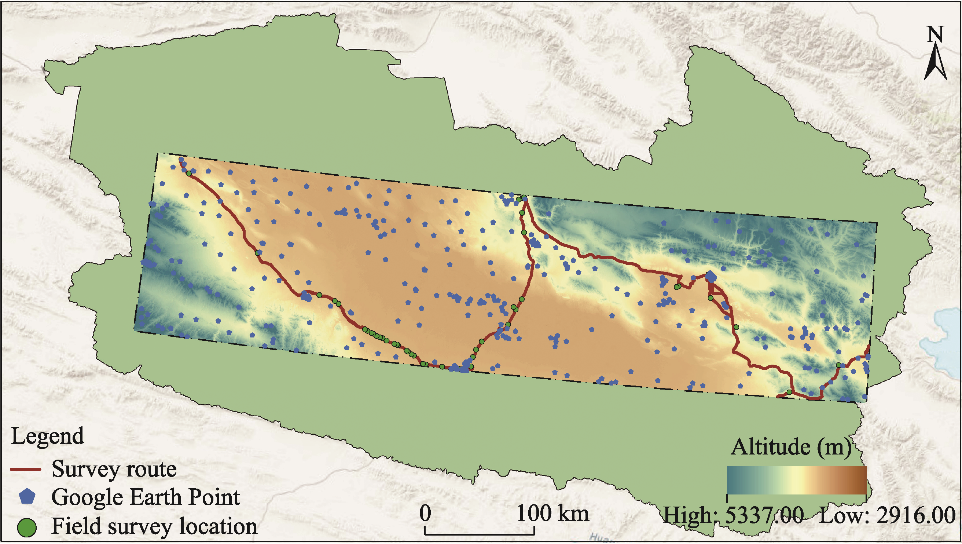
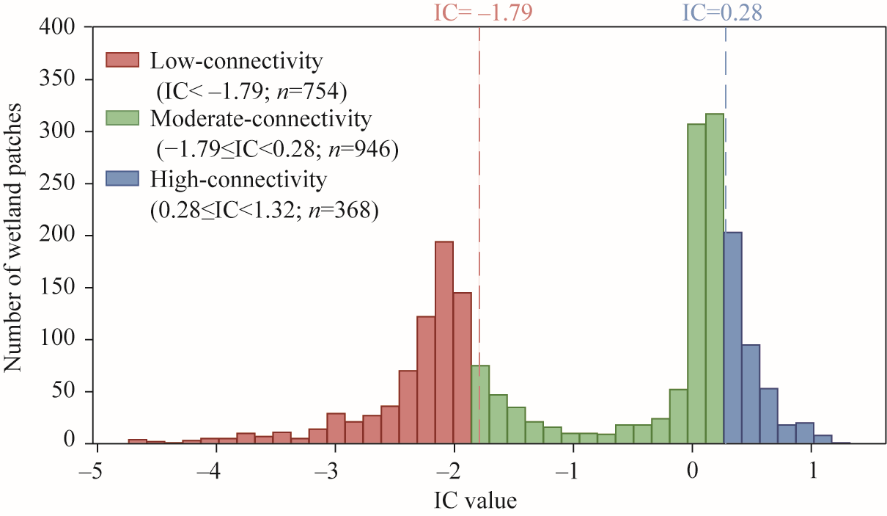
Abstract The Qaidam Basin, a typical alpine arid inland basin on the northern Qinghai-Xizang Plateau, China, hosts wetland ecosystems that are strongly constrained by topography and extreme climate. These ecosystems exhibit pronounced spatiotemporal heterogeneity and fragmented distribution patterns, rendering them highly sensitive to environmental change. This study integrated Sentinel-2 remote sensing imagery with the SedInConnect model to delineate wetland patch distributions and calculate the Index of Connectivity (IC) values across the basin. Based on IC values, we stratified field sampling sites into high-, moderate-, and low- connectivity gradient groups to analyze the relationships among plant community characteristics, vegetation spatial patterns, and wetland connectivity in the Qaidam Basin. Partial Least Squares Path Modeling (PLS-PM) was further employed to quantify the driving mechanisms underlying wetland vegetation characteristics. The results revealed that wetland connectivity across the basin was generally low, with IC values up to 1.32 and displaying a west-to-east decreasing gradient. The west and northwest were characterized by relatively continuous high-connectivity wetland networks, while fragmented and low-connectivity wetlands predominated in the east and southeast. Connectivity regulated wetland vegetation patterns primarily by affecting patch size, fragmentation, and internal adjacency. High-connectivity areas had higher class area (CA), largest patch index (LPI), and area-weighted mean patch size (AREA_AM) than low-connectivity areas. Connectivity had the strongest effect on vegetation coverage, which declined sharply from 87.577% in high-connectivity areas to 12.152% in low-connectivity areas. Meanwhile, species diversity showed a moderately negative response to connectivity changes, whereas species evenness remained relatively unaffected. PLS-PM explained 78.300% and 67.500% of the variance in vegetation community and vegetation pattern, respectively. Climate played a dominant role in shaping vegetation characteristics, with significant negative effects on both vegetation community and pattern. Topography influenced vegetation indirectly through climate, and connectivity was influenced by both drivers and exerted positive effects on vegetation community and pattern. This study reveals the multi-pathway driving mechanisms underlying vegetation pattern formation in alpine wetlands, providing a theoretical foundation and decision-support framework for the scientific conservation and adaptive management of wetlands in the Qaidam Basin.
|
|
Received: 21 December 2025
Published: 30 April 2026
|
|
Corresponding Authors:
*ZHAO Wenzhi (E-mail: zhaowzh@lzb.ac.cn)
|
|
|
| [1] |
Ameli A A, Creed I F. 2017. Quantifying hydrologic connectivity of wetlands to surface water systems. Hydrology and Earth System Sciences, 21(3): 1791-1808.
doi: 10.5194/hess-21-1791-2017
|
|
|
| [2] |
Amoros C, Bornette G. 2002. Connectivity and biocomplexity in waterbodies of riverine floodplains. Freshwater Biology, 47(4): 761-776.
doi: 10.1046/j.1365-2427.2002.00905.x
|
|
|
| [3] |
Biswas G, Sengupta A, Alfaisal F M, et al. 2023. Evaluating the effects of landscape fragmentation on ecosystem services: A three-decade perspective. Ecological Informatics, 77: 102283, doi: 10.1016/j.ecoinf.2023.102283.
|
|
|
| [4] |
Borselli L, Cassi P, Torri D. 2008. Prolegomena to sediment and flow connectivity in the landscape: A GIS and field numerical assessment. CATENA, 75(3): 268-277.
doi: 10.1016/j.catena.2008.07.006
|
|
|
| [5] |
Bracken L J, Croke J. 2007. The concept of hydrological connectivity and its contribution to understanding runoff-dominated geomorphic systems. Hydrological Processes, 21(13): 1749-1763.
doi: 10.1002/hyp.v21:13
|
|
|
| [6] |
Bracken L J, Wainwright J, Ali G A, et al. 2013. Concepts of hydrological connectivity: Research approaches, pathways and future agendas. Earth-Science Reviews, 119: 17-34.
doi: 10.1016/j.earscirev.2013.02.001
|
|
|
| [7] |
Caine N, Swanson F J. 2013. Geomorphic coupling of hillslope and channel systems in two small mountain basins. In: Geomorphology:Critical Concepts in Geography. Oxfordshire: Routledge, 159-173.
|
|
|
| [8] |
Cavalli M, Trevisani S, Comiti F, et al. 2013. Geomorphometric assessment of spatial sediment connectivity in small alpine catchments. Geomorphology, 188(15): 31-41.
doi: 10.1016/j.geomorph.2012.05.007
|
|
|
| [9] |
Chen F H, Wang Y F, Zhen X L, et al. 2021. Environmental impacts and response strategies for the Qinghai-Tibet Plateau under global change. China Tibetology, 4: 21-28. (in Chinese)
|
|
|
| [10] |
Chen W, Geng Y, Huang B B, et al. 2019. Emergy analysis of ecological-economic system in underdeveloped western regions: A case study of Haixi Mongolian and Tibetan Autonomous Prefecture, Qinghai Province. Acta Ecologica Sinica, 39(21): 7904-7913. (in Chinese)
|
|
|
| [11] |
Crema S, Cavalli M. 2018. SedInConnect: a stand-alone, free and open source tool for the assessment of sediment connectivity. Computers & Geosciences, 111: 39-45.
doi: 10.1016/j.cageo.2017.10.009
|
|
|
| [12] |
Dang X Y, Lu N, Gu X F, et al. 2019. Groundwater threshold of ecological vegetation in Qaidam Basin. Hydrogeology & Engineering Geology, 46(3): 1-8. (in Chinese)
|
|
|
| [13] |
Dao R N, Zhang Y, Li X L, et al. 2025. Effects of succession process on soil bacterial diversity in alpine wetlands. Environmental Science, 46(3): 1897-1904. (in Chinese)
|
|
|
| [14] |
DeKeyser E S, Kirby D R, Ell M J. 2003. An index of plant community integrity: development of the methodology for assessing Prairie wetland plant communities. Ecological Indicators, 3(2): 119-133.
doi: 10.1016/S1470-160X(03)00015-3
|
|
|
| [15] |
Doughty C L, Ambrose R F, Okin G S, et al. 2021. Characterizing spatial variability in coastal wetland biomass across multiple scales using UAV and satellite imagery. Remote Sensing in Ecology and Conservation, 7(3): 411-429.
doi: 10.1002/rse2.198
|
|
|
| [16] |
Duan S Q. 2018. Lake evolution in the Qaidam Basin from 1976 to 2015 and its response to climate change and human activities. Journal of Lake Sciences, 30(1): 256-265. (in Chinese)
doi: 10.18307/2018.0125
|
|
|
| [17] |
Flinn K M, Lechowicz M J, Waterway M J. 2008. Plant species diversity and composition of wetlands within an upland forest. American Journal of Botany, 95(10): 1216-1224.
doi: 10.3732/ajb.0800098
pmid: 21632326
|
|
|
| [18] |
Frazier A E, Kedron P. 2017. Landscape metrics: past progress and future directions. Current Landscape Ecology Reports, 2(3): 63-72.
doi: 10.1007/s40823-017-0026-0
|
|
|
| [19] |
Fu B J. 2011. Erta and Applications of Landscape Ecology (2nd ed.). Beijing: Science Press, 87-92. (in Chinese)
|
|
|
| [20] |
Gnann S, Baldwin J W, Cuthbert M O, et al. 2025. The influence of topography on the global terrestrial water cycle. Reviews of Geophysics, 63(1): e2023RG000810, doi: 10.1029/2023RG000810.
|
|
|
| [21] |
Golden H E, Lane C R, Amatya D M, et al. 2014. Hydrologic connectivity between geographically isolated wetlands and surface water systems: A review of select modeling methods. Environmental Modelling & Software, 53: 190-206.
|
|
|
| [22] |
Guo J, Li G P. 2007. Climate change in Zoige and its impact on wetland degradation. Plateau Meteorology, 26(2): 422-428. (in Chinese)
|
|
|
| [23] |
Gustafson E J. 1998. Quantifying landscape spatial pattern: what is the state of the art? Ecosystems, 1(2): 143-156.
doi: 10.1007/s100219900011
|
|
|
| [24] |
Haddad N M, Brudvig L A, Clobert J, et al. 2015. Habitat fragmentation and its lasting impact on Earth's ecosystems. Science Advances, 1(2): e1500052, doi: 10.1126/sciadv.1500052.
|
|
|
| [25] |
Hair J F, Hult G T M, Ringle C M, et al. 2021. Partial Least Squares Structural Equation Modeling (PLS-SEM) Using R:A Workbook. Cham: Springer International Publishing, 11.
|
|
|
| [26] |
Hou M J, Gao J L, Ge J, et al. 2020. Dynamic changes and driving factors of alpine marsh wetlands in the eastern Qinghai-Tibet Plateau. Acta Prataculturae Sinica, 29(1): 13-27. (in Chinese)
|
|
|
| [27] |
Hughes F M R, Stroh P A, Adams W M, et al. 2011. Monitoring and evaluating large-scale, 'open-ended' habitat creation projects: A journey rather than a destination. Journal for Nature Conservation, 19(4): 245-253.
doi: 10.1016/j.jnc.2011.02.003
|
|
|
| [28] |
Jia H W, Yan C Z, Xing X G. 2021. Evaluation of eco-environmental quality in Qaidam Basin based on the ecological index (MRSEI) and GEE. Remote Sensing, 13(22): 4543, doi: 10.3390/rs13224543.
|
|
|
| [29] |
Jiang W G, Lü J X, Wang C C, et al. 2017a. Marsh wetland degradation risk assessment and change analysis: A case study in the Zoige Plateau, China. Ecological Indicators, 82: 316-326.
doi: 10.1016/j.ecolind.2017.06.059
|
|
|
| [30] |
Jiang X M, Zheng P, Cao L, et al. 2021. Effects of long-term floodplain disconnection on multiple facets of lake fish biodiversity: Decline of alpha diversity leads to a regional differentiation through time. Science of the Total Environment, 786: 144177, doi: 10.1016/j.scitotenv.2020.144177.
|
|
|
| [31] |
Jiang Y, Xue L F, Yu H X, et al. 2017b. Analysis of river system changes during urbanization in the Nansi Lake Basin over the past 30 years. Journal of Lake Sciences, 29(1): 135-142. (in Chinese)
doi: 10.18307/2017.0115
|
|
|
| [32] |
Jiao W Z, Wang L X, Smith W K, et al. 2021. Observed increasing water constraint on vegetation growth over the last three decades. Nature Communications, 12(1): 3777, doi: 10.1038/s41467-021-24016-9.
|
|
|
| [33] |
Jin H N, Xu J, Peng Y, et al. 2023. Impacts of landscape patterns on plant species diversity at a global scale. Science of the Total Environment, 896: 165193, doi: 10.1016/j.scitotenv.2023.165193.
|
|
|
| [34] |
Jin X M, Liu J T, Wang S T, et al. 2016. Vegetation dynamics and their response to groundwater and climate variables in Qaidam Basin, China. International Journal of Remote Sensing, 37(3): 710-728.
doi: 10.1080/01431161.2015.1137648
|
|
|
| [35] |
Li H B, Wu J G. 2004. Use and misuse of landscape indices. Landscape Ecology, 19(4): 389-399.
doi: 10.1023/B:LAND.0000030441.15628.d6
|
|
|
| [36] |
Lian X, Piao S L, Chen A P, et al. 2021. Multifaceted characteristics of dryland aridity changes in a warming world. Nature Reviews Earth & Environment, 2(4): 232-250.
|
|
|
| [37] |
Liu W, Shi C X, Ma Y Y, et al. 2021. Land use and land cover change-induced changes of sediment connectivity and their effects on sediment yield in a catchment on the Loess Plateau in China. CATENA, 207: 105688, doi: 10.1016/j.catena.2021.105688.
|
|
|
| [38] |
Liu Y Y, Wang Q, Zhang Z Y, et al. 2019. Grassland dynamics in responses to climate variation and human activities in China from 2000 to 2013. Science of the Total Environment, 690(10): 27-39.
doi: 10.1016/j.scitotenv.2019.06.503
|
|
|
| [39] |
Ma K P. 1994. Measurement methods for biodiversity in biological communities I: Measurement of α diversity (Part 1). Biodiversity Science, 2(3): 162-168. (in Chinese)
doi: 10.17520/biods.1994027
|
|
|
| [40] |
Ma M J, Walck J, Ma Z, et al. 2018. Grazing disturbance increases transient but decreases persistent soil seed bank. Ecological Applications, 28(4): 1020-1031.
doi: 10.1002/eap.1706
pmid: 29710415
|
|
|
| [41] |
Neel M C, McGarigal K, Cushman S A. 2004. Behavior of class-level landscape metrics across gradients of class aggregation and area. Landscape Ecology, 19(4): 435-455.
doi: 10.1023/B:LAND.0000030521.19856.cb
|
|
|
| [42] |
Niu Z G, Jing Y H, Zhang D Q, et al. 2024. Response characteristics of wetland ecosystems on the Qinghai-Tibet Plateau under climate change: review and prospect. Climate Change Research, 20(5): 509-518. (in Chinese)
|
|
|
| [43] |
Peng S Z. 2019. 1 km monthly mean temperature dataset for China (1901-2024). [2025-11-03]. https://www.tpdc.ac.cn/zh-hans/data/71ab4677-b66c-4fd1-a004-b2a541c4d5bf.
|
|
|
| [44] |
Peng S Z. 2020. 1 km monthly precipitation dataset for China (1901-2024). [2025-11-03]. https://www.tpdc.ac.cn/zh-hans/data/faae7605-a0f2-4d18-b28f-5cee413766a2.
|
|
|
| [45] |
Peng S Z. 2022. 1 km monthly potential evapotranspiration dataset for China (1901-2024). [2025-11-03]. https://www.tpdc.ac.cn/en/data/8b11da09-1a40-4014-bd3d-2b86e6dccad4/.
|
|
|
| [46] |
Pickett S T A, Cadenasso M L. 1995. Landscape ecology: spatial heterogeneity in ecological systems. Science, 269(5222): 331-334.
doi: 10.1126/science.269.5222.331
pmid: 17841249
|
|
|
| [47] |
Pringle C. 2003. What is hydrologic connectivity and why is it ecologically important? Hydrological Processes, 17(13): 2685-2689.
doi: 10.1002/hyp.v17:13
|
|
|
| [48] |
Rita A, Bonanomi G, Allevato E, et al. 2021. Topography modulates near-ground microclimate in the Mediterranean Fagus sylvatica treeline. Scientific Reports, 11: 8122, doi: 10.1038/s41598-021-87661-6.
|
|
|
| [49] |
Stein A, Gerstner K, Kreft H. 2014. Environmental heterogeneity as a universal driver of species richness across taxa, biomes and spatial scales. Ecology Letters, 17(7): 771-890.
doi: 10.1111/ele.2014.17.issue-7
|
|
|
| [50] |
Steiner C F, Asgari M. 2022. Habitat isolation reduces intra- and interspecific biodiversity and stability. Royal Society Open Science, 9(2): 211309, doi: 10.1098/rsos.211309.
|
|
|
| [51] |
Tian P, Cao L D, Li J L, et al. 2019. Landscape grain effect in Yancheng coastal wetland and its response to landscape changes. International Journal of Environmental Research and Public Health, 16(12): 2225, doi: 10.3390/ijerph16122225.
|
|
|
| [52] |
Todd M J, Muneepeerakul R, Pumo D, et al. 2010. Hydrological drivers of wetland vegetation community distribution within Everglades National Park, Florida. Advances in Water Resources, 33(10): 1279-1289.
doi: 10.1016/j.advwatres.2010.04.003
|
|
|
| [53] |
Wang H, He K N, Hu X B, et al. 2012. Effects of different tree species configurations on understory vegetation species diversity in alpine regions. Research of Soil and Water Conservation, 19(3): 147-150. (in Chinese)
|
|
|
| [54] |
Wang Z Q, Zhang Y Z, Yang Y, et al. 2016. Quantitative assess the driving forces on the grassland degradation in the Qinghai-Tibet Plateau, in China. Ecological Informatics, 33: 32-44.
doi: 10.1016/j.ecoinf.2016.03.006
|
|
|
| [55] |
Wei L M, Zhao W Z, Wu C D, et al. 2024. Identification of dominant drivers of streamflow spatiotemporal variations in typical mountainous areas in the Hexi Corridor, China. Journal of Hydrology: Regional Studies, 56: 102024, doi: 10.1016/j.ejrh.2024.102024.
|
|
|
| [56] |
Wetzels M, Odekerken-Schröder G, van Oppen C. 2009. Using PLS path modeling for assessing hierarchical construct models: Guidelines and empirical illustration. MIS Quarterly, 33(1): 177-195.
doi: 10.2307/20650284
|
|
|
| [57] |
Wohl E. 2017. Connectivity in rivers. Progress in Physical Geography, 41(3): 345-362.
|
|
|
| [58] |
Xu Z Z. 2023. Spatiotemporal differentiation and simulation prediction of ecological vulnerability in the Qaidam Basin based on the SRP model. PhD Dissertation. Beijing: University of Chinese Academy of Sciences. (in Chinese)
|
|
|
| [59] |
Yan X Q, Jiao J Y, Tang B Z, et al. 2022. Assessing sediment connectivity and its spatial response on land use using two flow direction algorithms in the catchment on the Chinese Loess Plateau. Journal of Mountain Science, 19(4): 1119-1138.
doi: 10.1007/s11629-021-6936-7
|
|
|
| [60] |
Yang H Q, Li S X. 2010. Current status and dynamics of natural grassland resources in Haixi Prefecture, Qinghai Province. Pratacultural Science, 27(6): 153-157. (in Chinese)
|
|
|
| [61] |
Yang M, Gong J G, Zhao Y, et al. 2021. Landscape pattern evolution processes of wetlands and their driving factors in the Xiong'an New Area of China. International Journal of Environmental Research and Public Health, 18(9): 4403, doi: 10.3390/ijerph18094403.
|
|
|
| [62] |
Yuan Y N. 2019. Study on the impact of land use and vegetation changes on hydrological connectivity in the Xinshui River Basin. PhD Dissertation. Beijing: North China Electric Power University. (in Chinese)
|
|
|
| [63] |
Zeng B R, Li Y L, Tan Z Q. 2023. Assessment of river network structure and hydrological connectivity evolution in the Poyang Lake Basin over the past 30 years based on the connectivity index (IC). Journal of Lake Sciences, 35(5): 1796-1807. (in Chinese)
doi: 10.18307/2023.0542
|
|
|
| [64] |
Zhao C. 2016. Temporal and spatial evolution and risk assessment of desertification in Haixi Mongolian and Tibetan Autonomous Prefecture. MSc Thesis. Lanzhou: Lanzhou University. (in Chinese)
|
|
|
| [65] |
Zou H, Gao G Y, Fu B J. 2016. Research progress on the relationship between grassland ecosystems and soil moisture in arid and semi-arid regions. Acta Ecologica Sinica, 36(11): 3127-3136. (in Chinese)
|
|
|
|
Viewed |
|
|
|
Full text
|
|
|
|
|
Abstract
|
|
|
|
|
Cited |
|
|
|
|
| |
Shared |
|
|
|
|
| |
Discussed |
|
|
|
|