| Research article |
|


|
|
|
| Construction and optimization of ecological security pattern in the mainstream of the Tarim River Basin, China |
QIN Xiaolin1,2, LIU Wei1,3, LING Hongbo1,2,*( ), ZHANG Guangpeng1,2, GONG Yanming1,2, MENG Xiangdong1,4, SHAN Qianjuan1,2 ), ZHANG Guangpeng1,2, GONG Yanming1,2, MENG Xiangdong1,4, SHAN Qianjuan1,2 |
1State Key Laboratory of Ecological Safety and Sustainable Development in Arid Lands, Xinjiang Institute of Ecology and Geography, Chinese Academy of Sciences, Urumqi 830011, China
2University of Chinese Academy of Sciences, Beijing 100049, China
3College of Water Conservancy & Architectural Engineering, Shihezi University, Shihezi 832003, China
4College of Hydraulic and Civil Engineering, Xinjiang Agricultural University, Urumqi 830052, China |
|
|
|
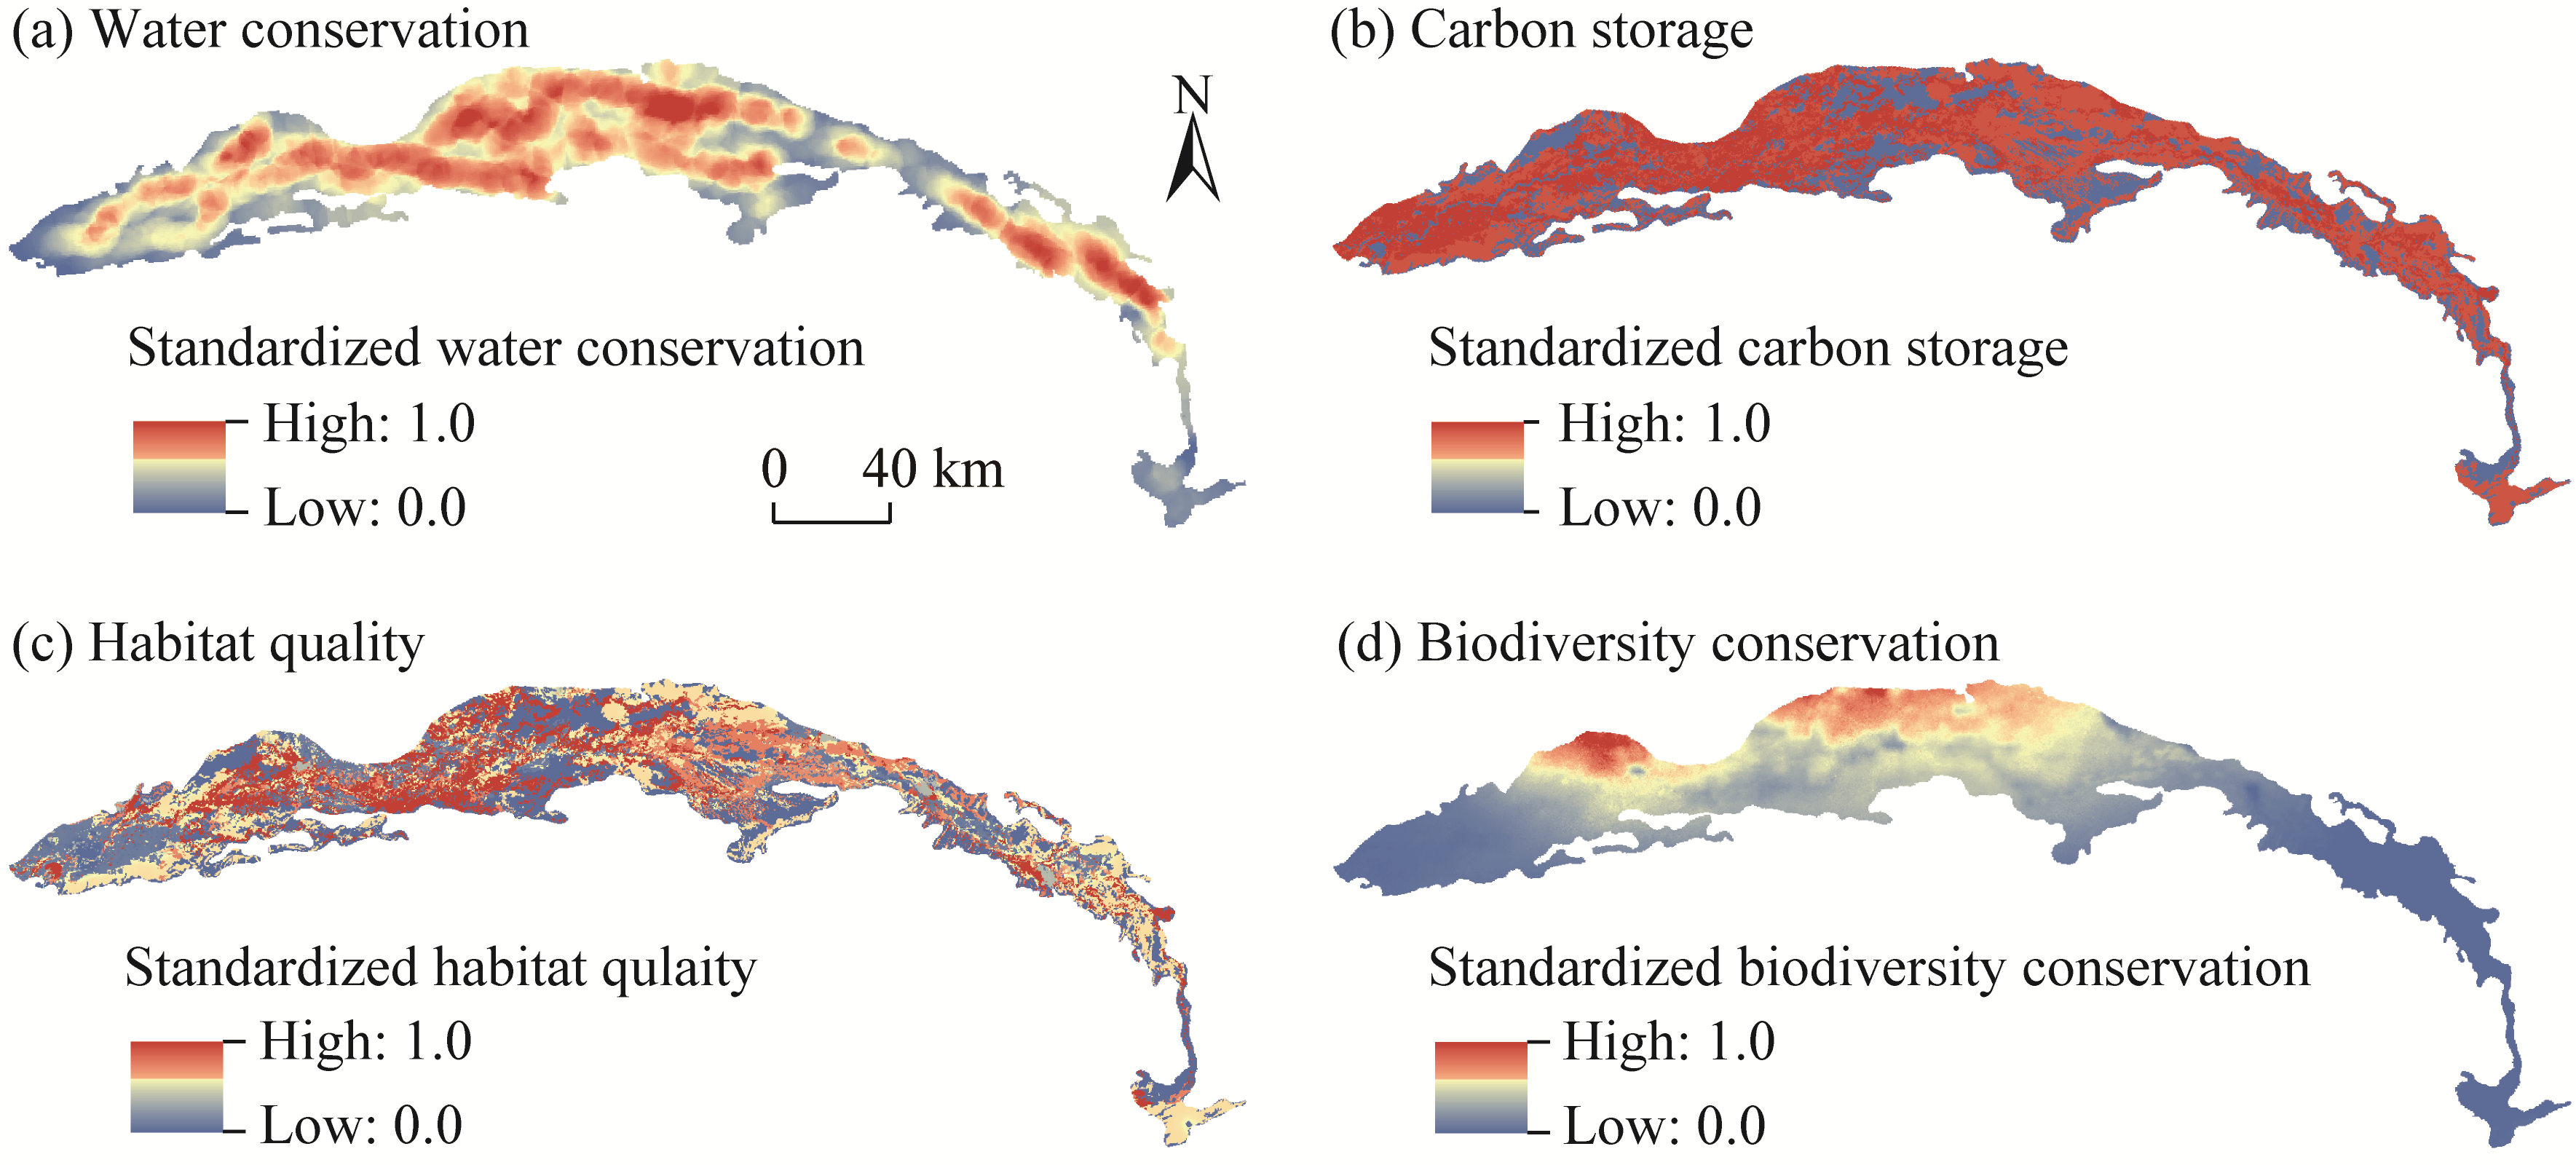
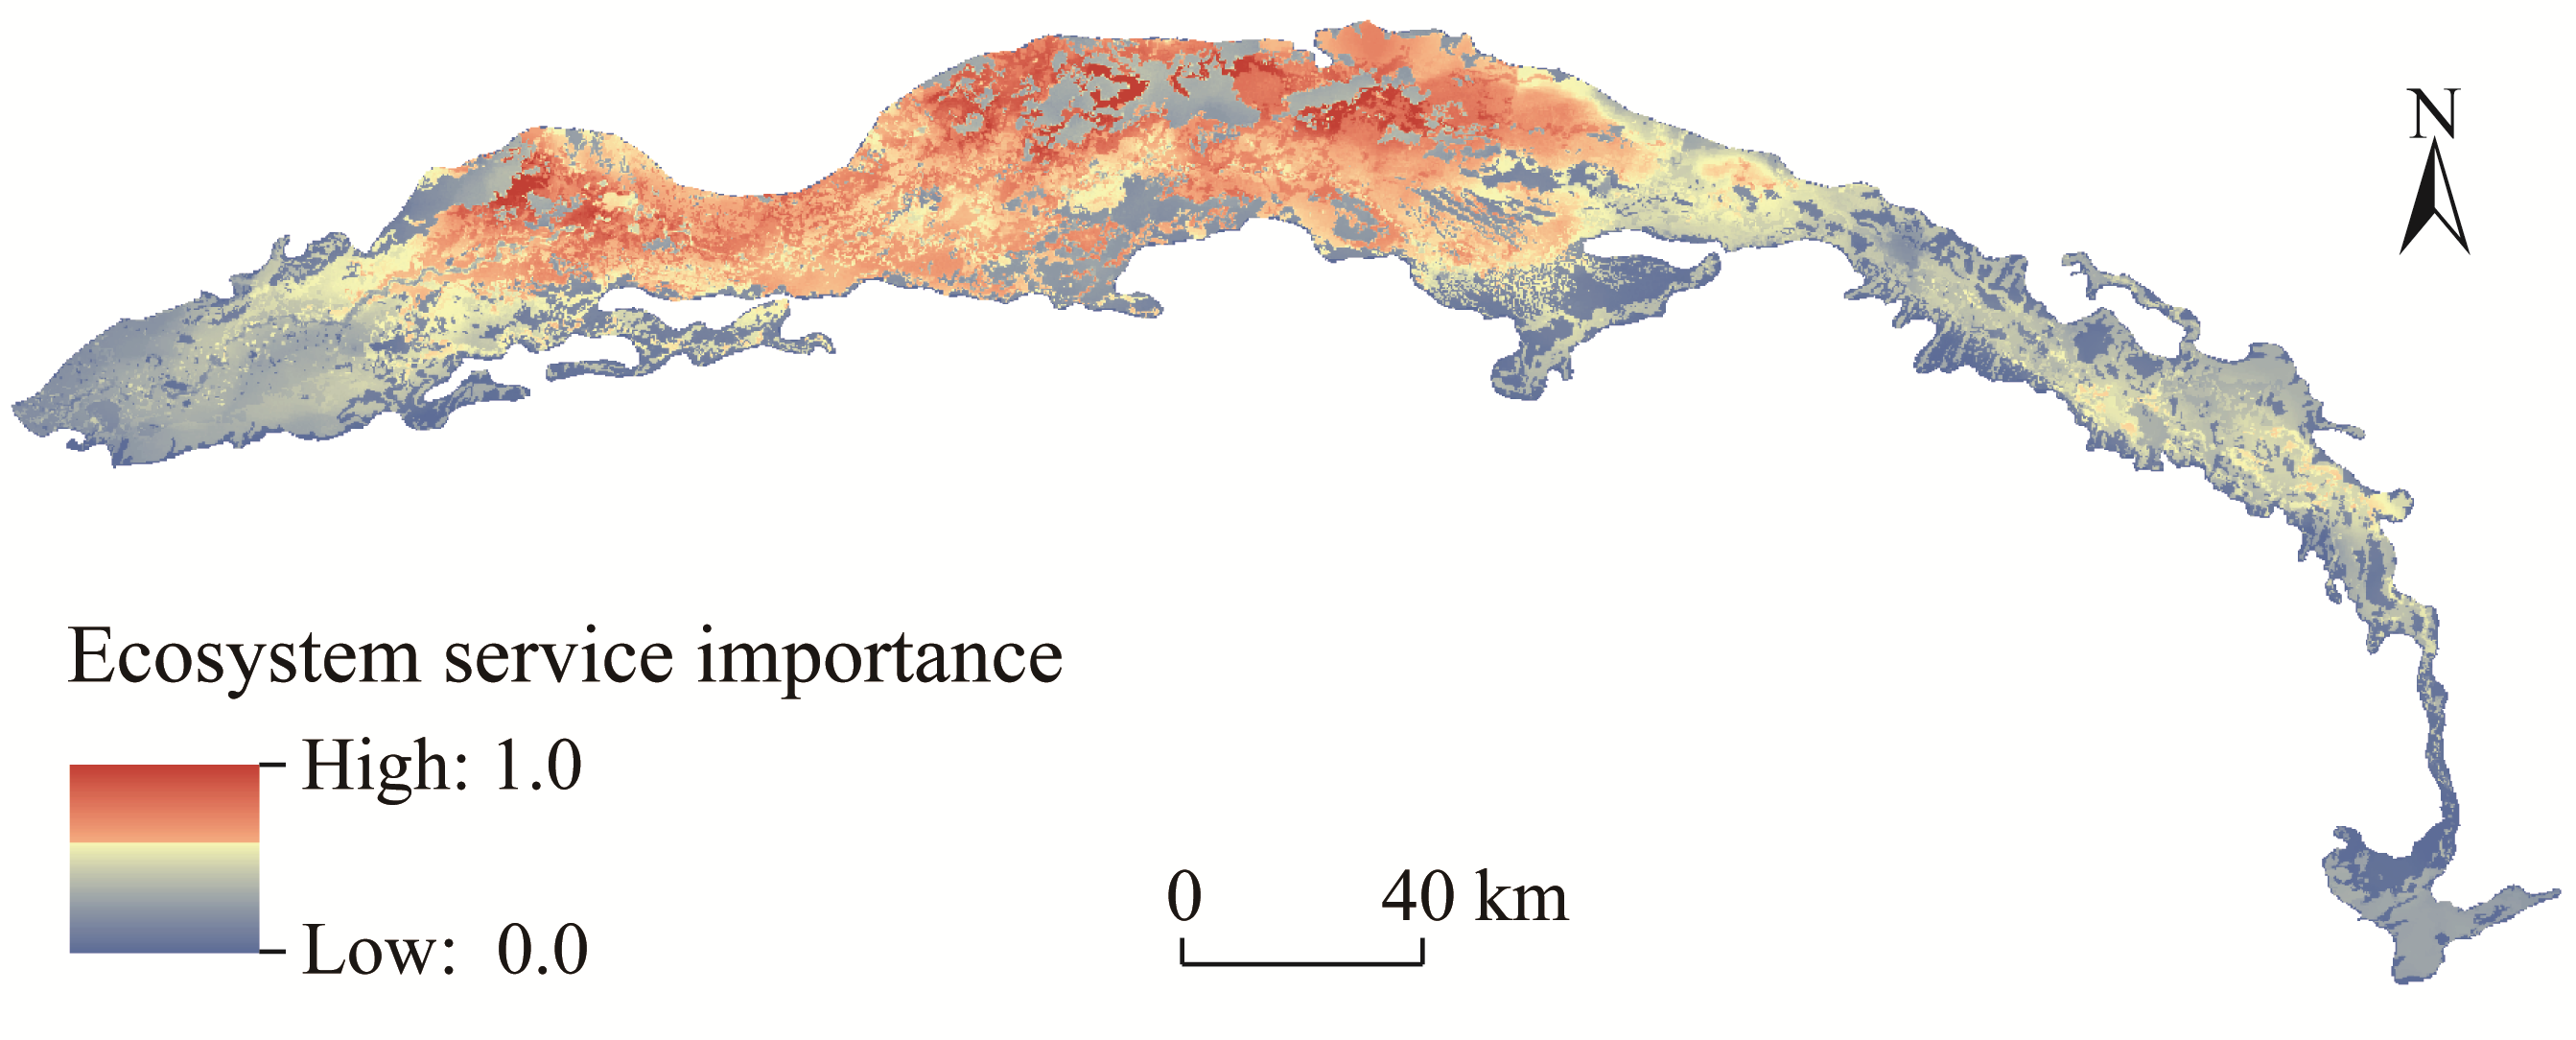
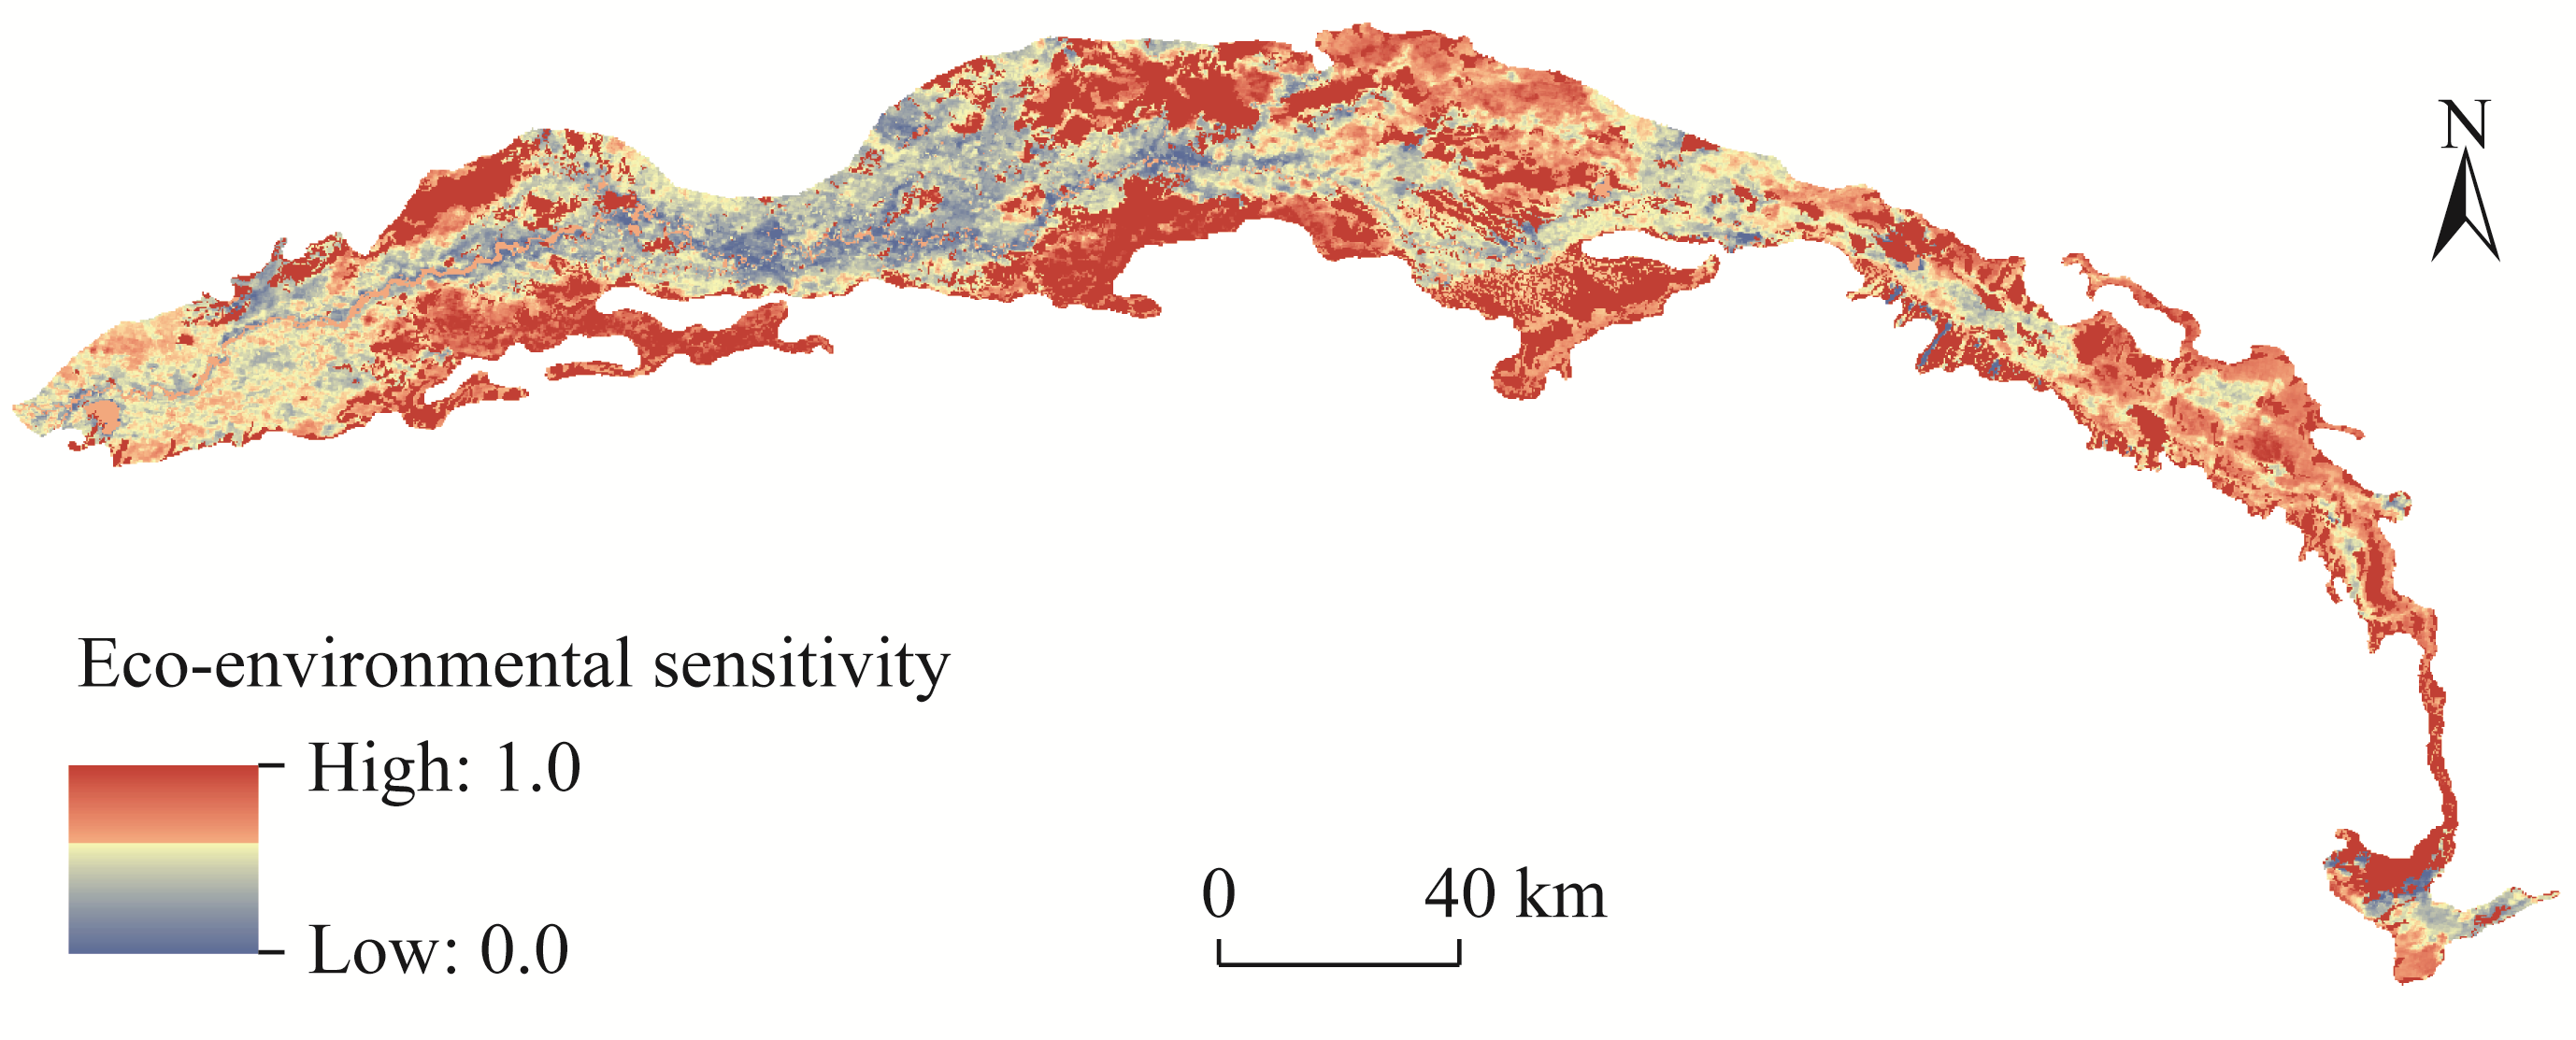
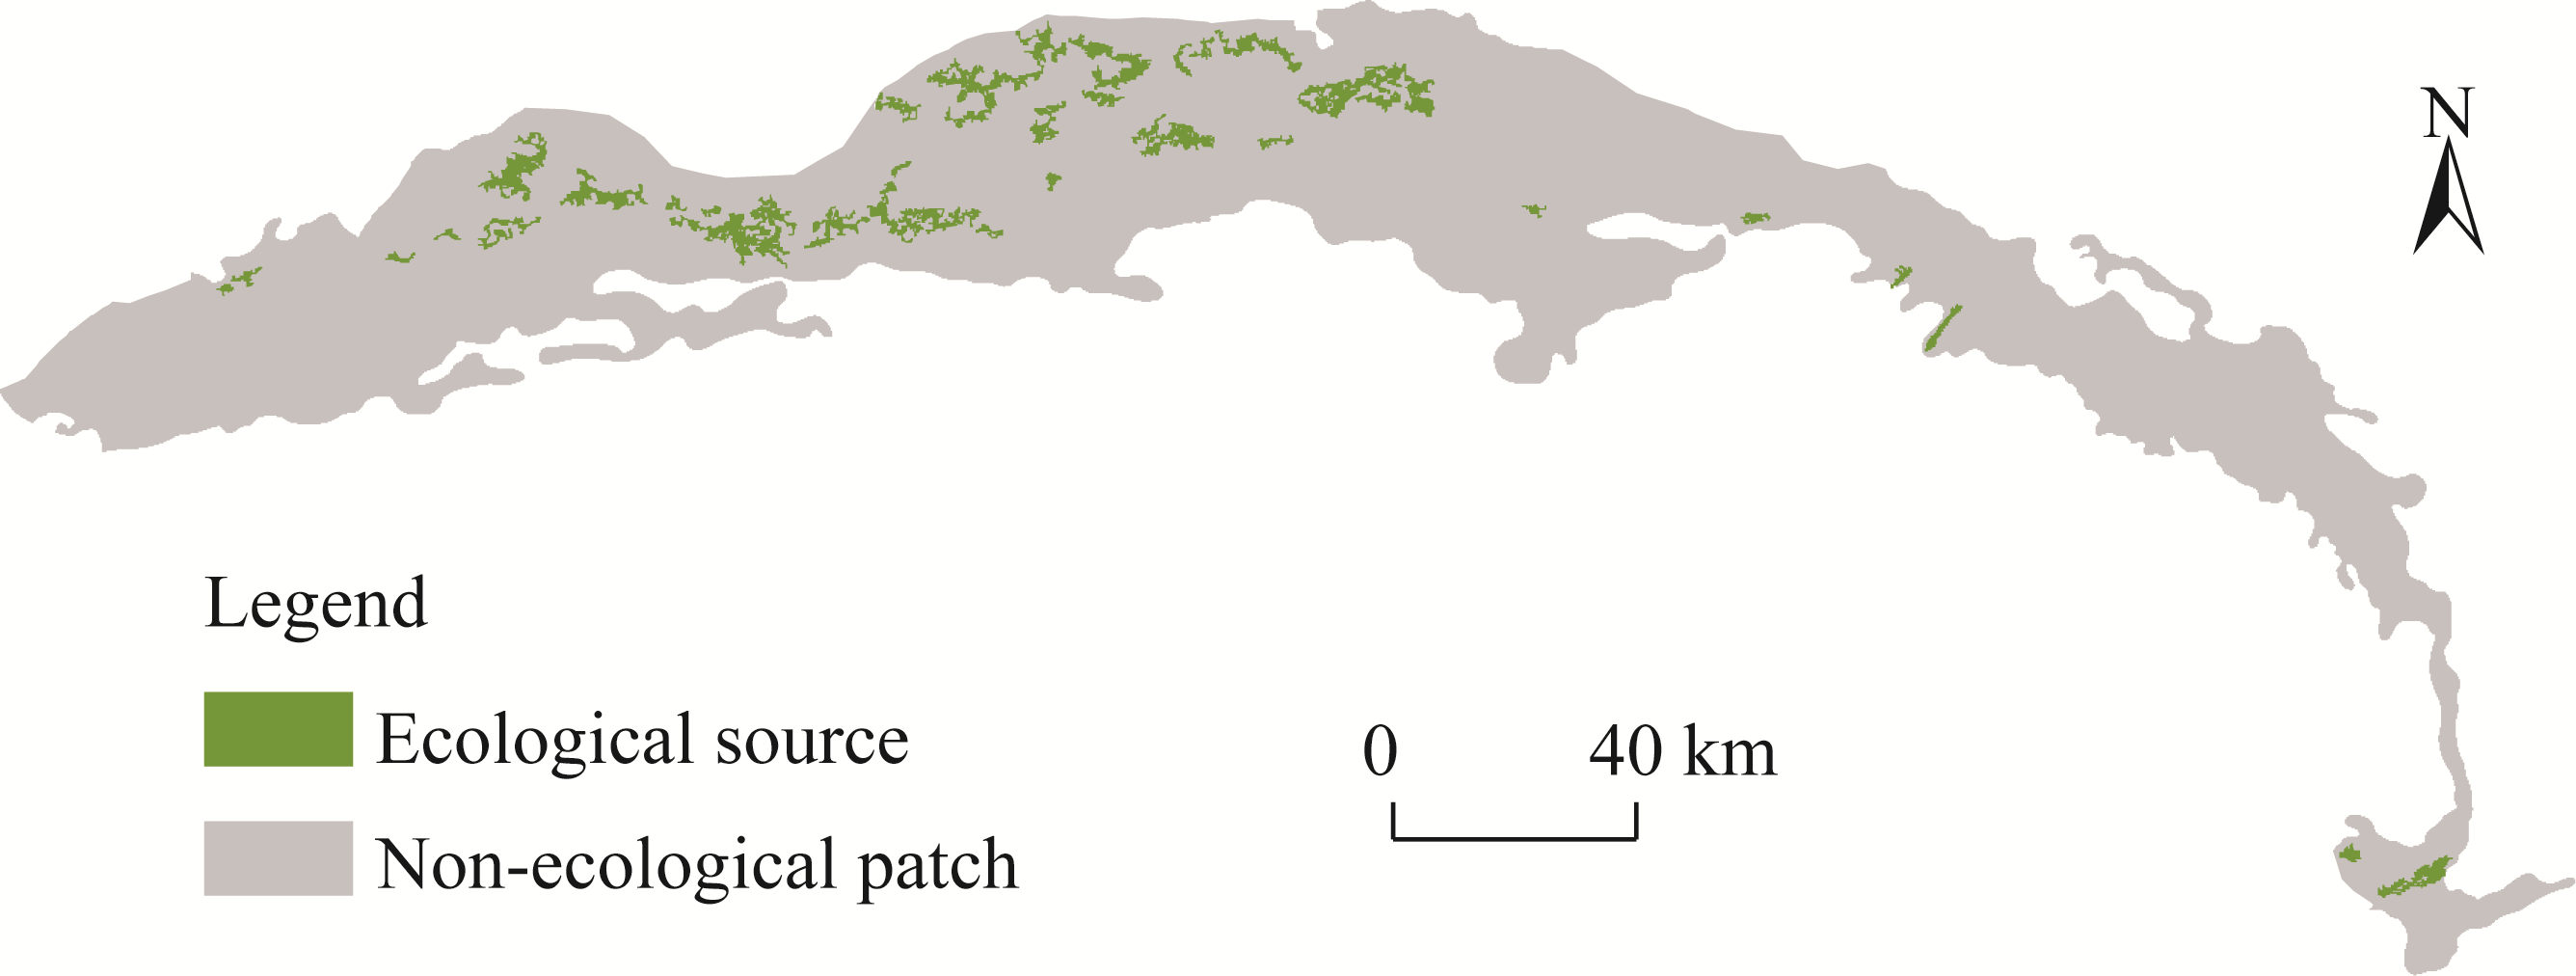
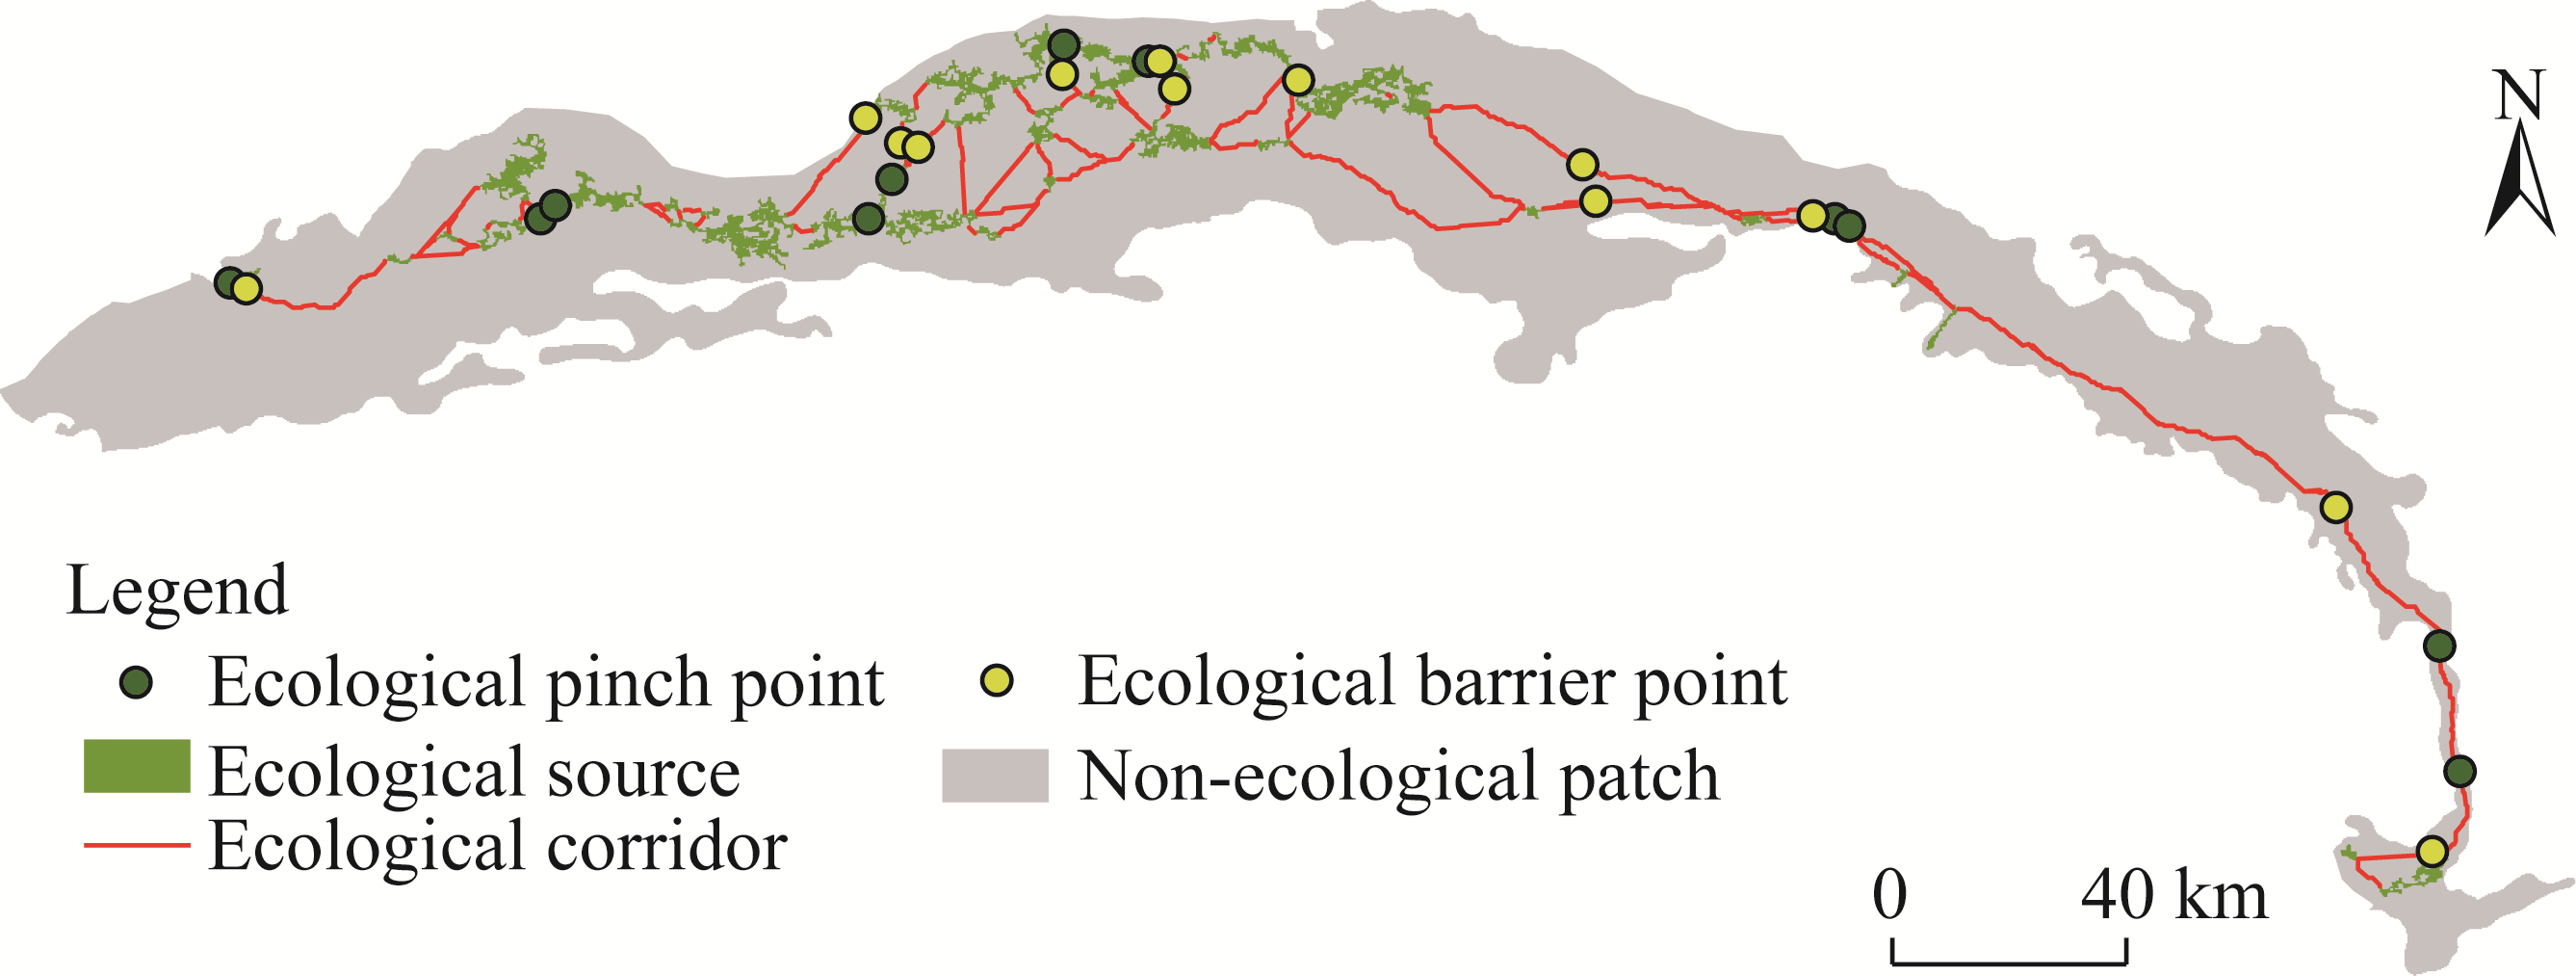
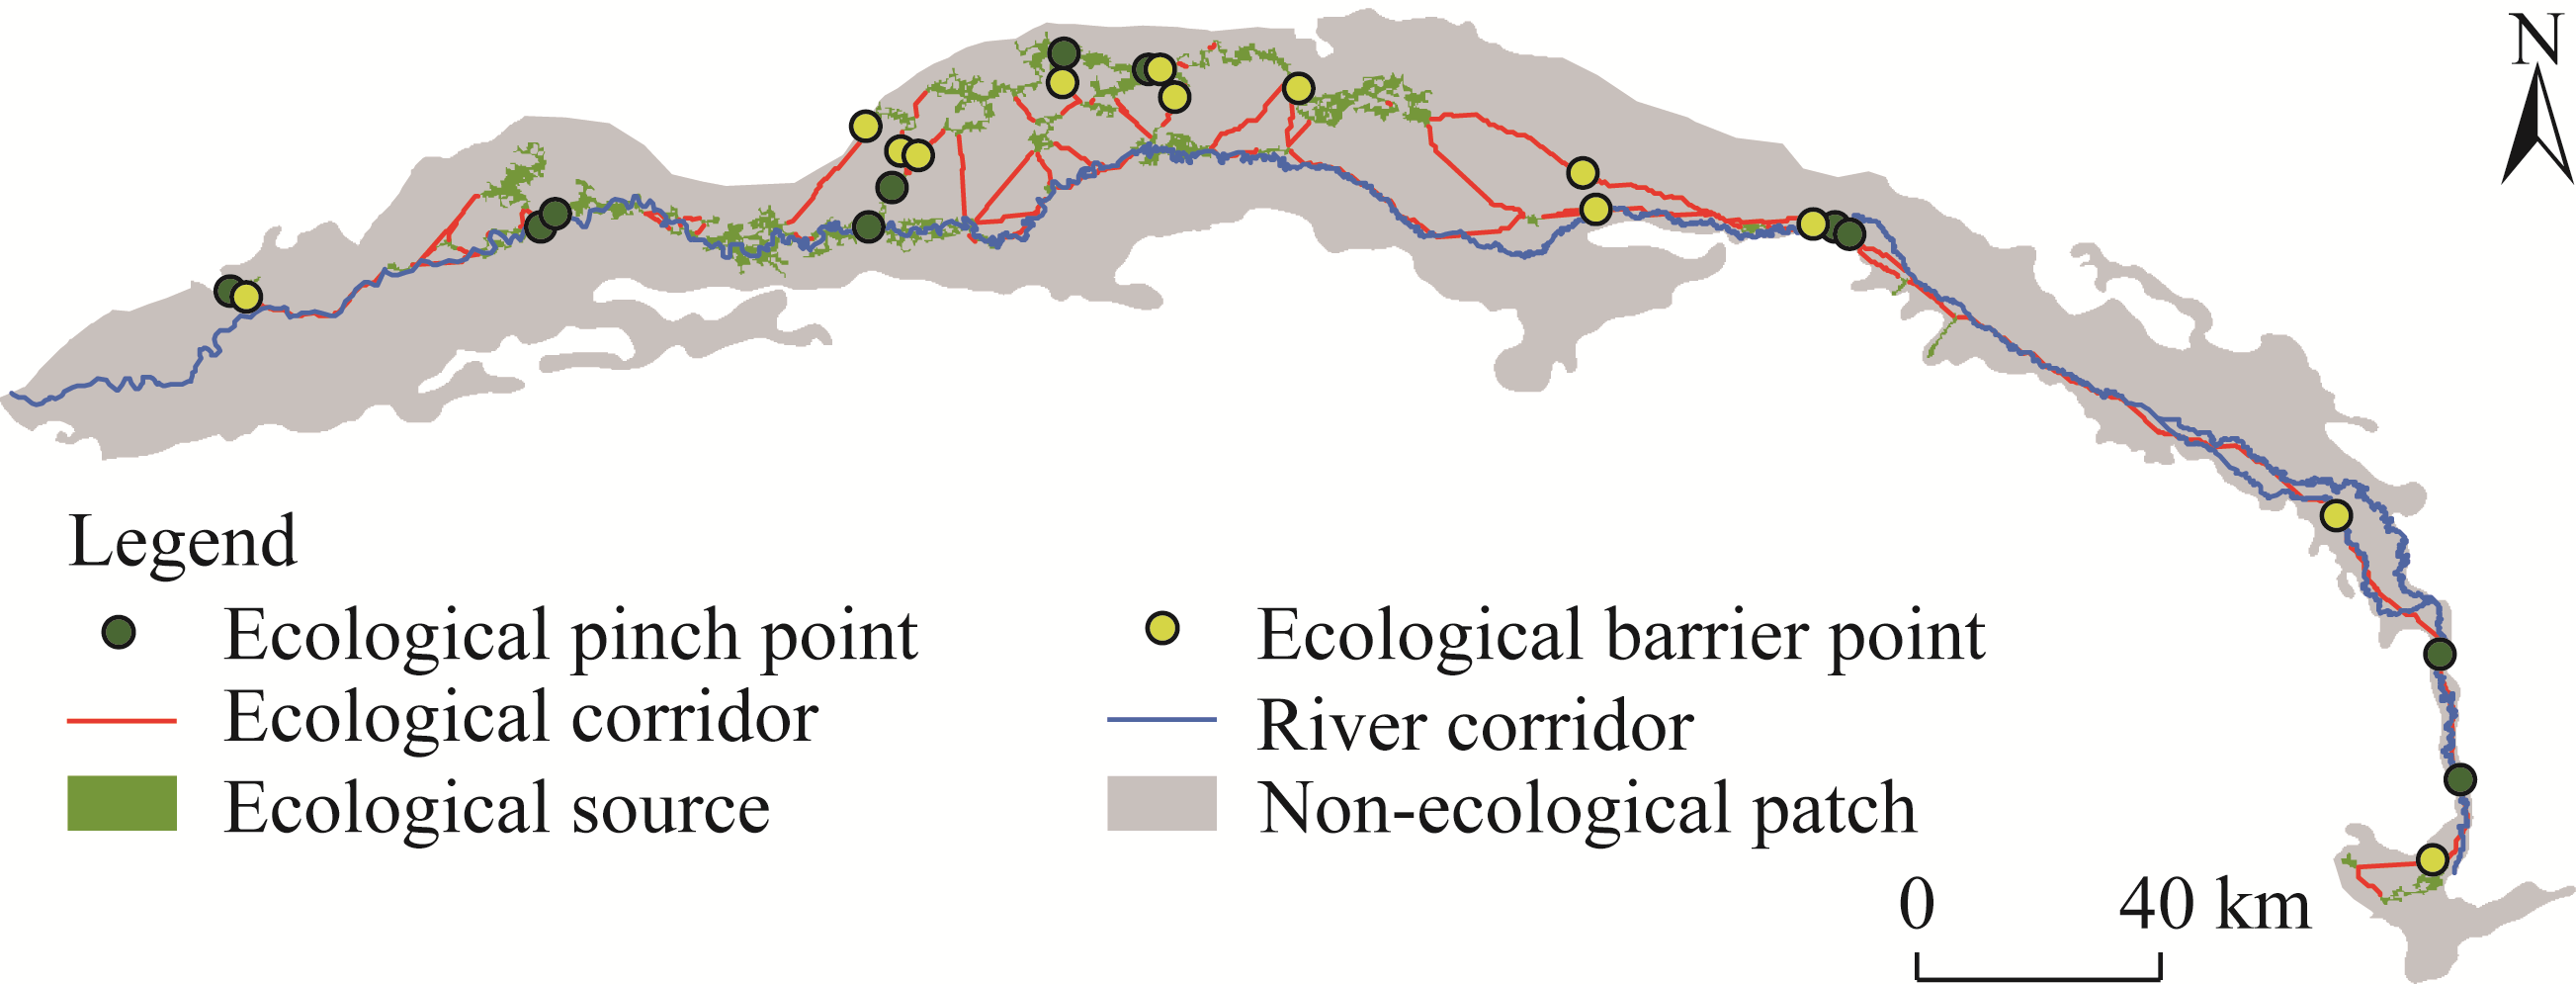
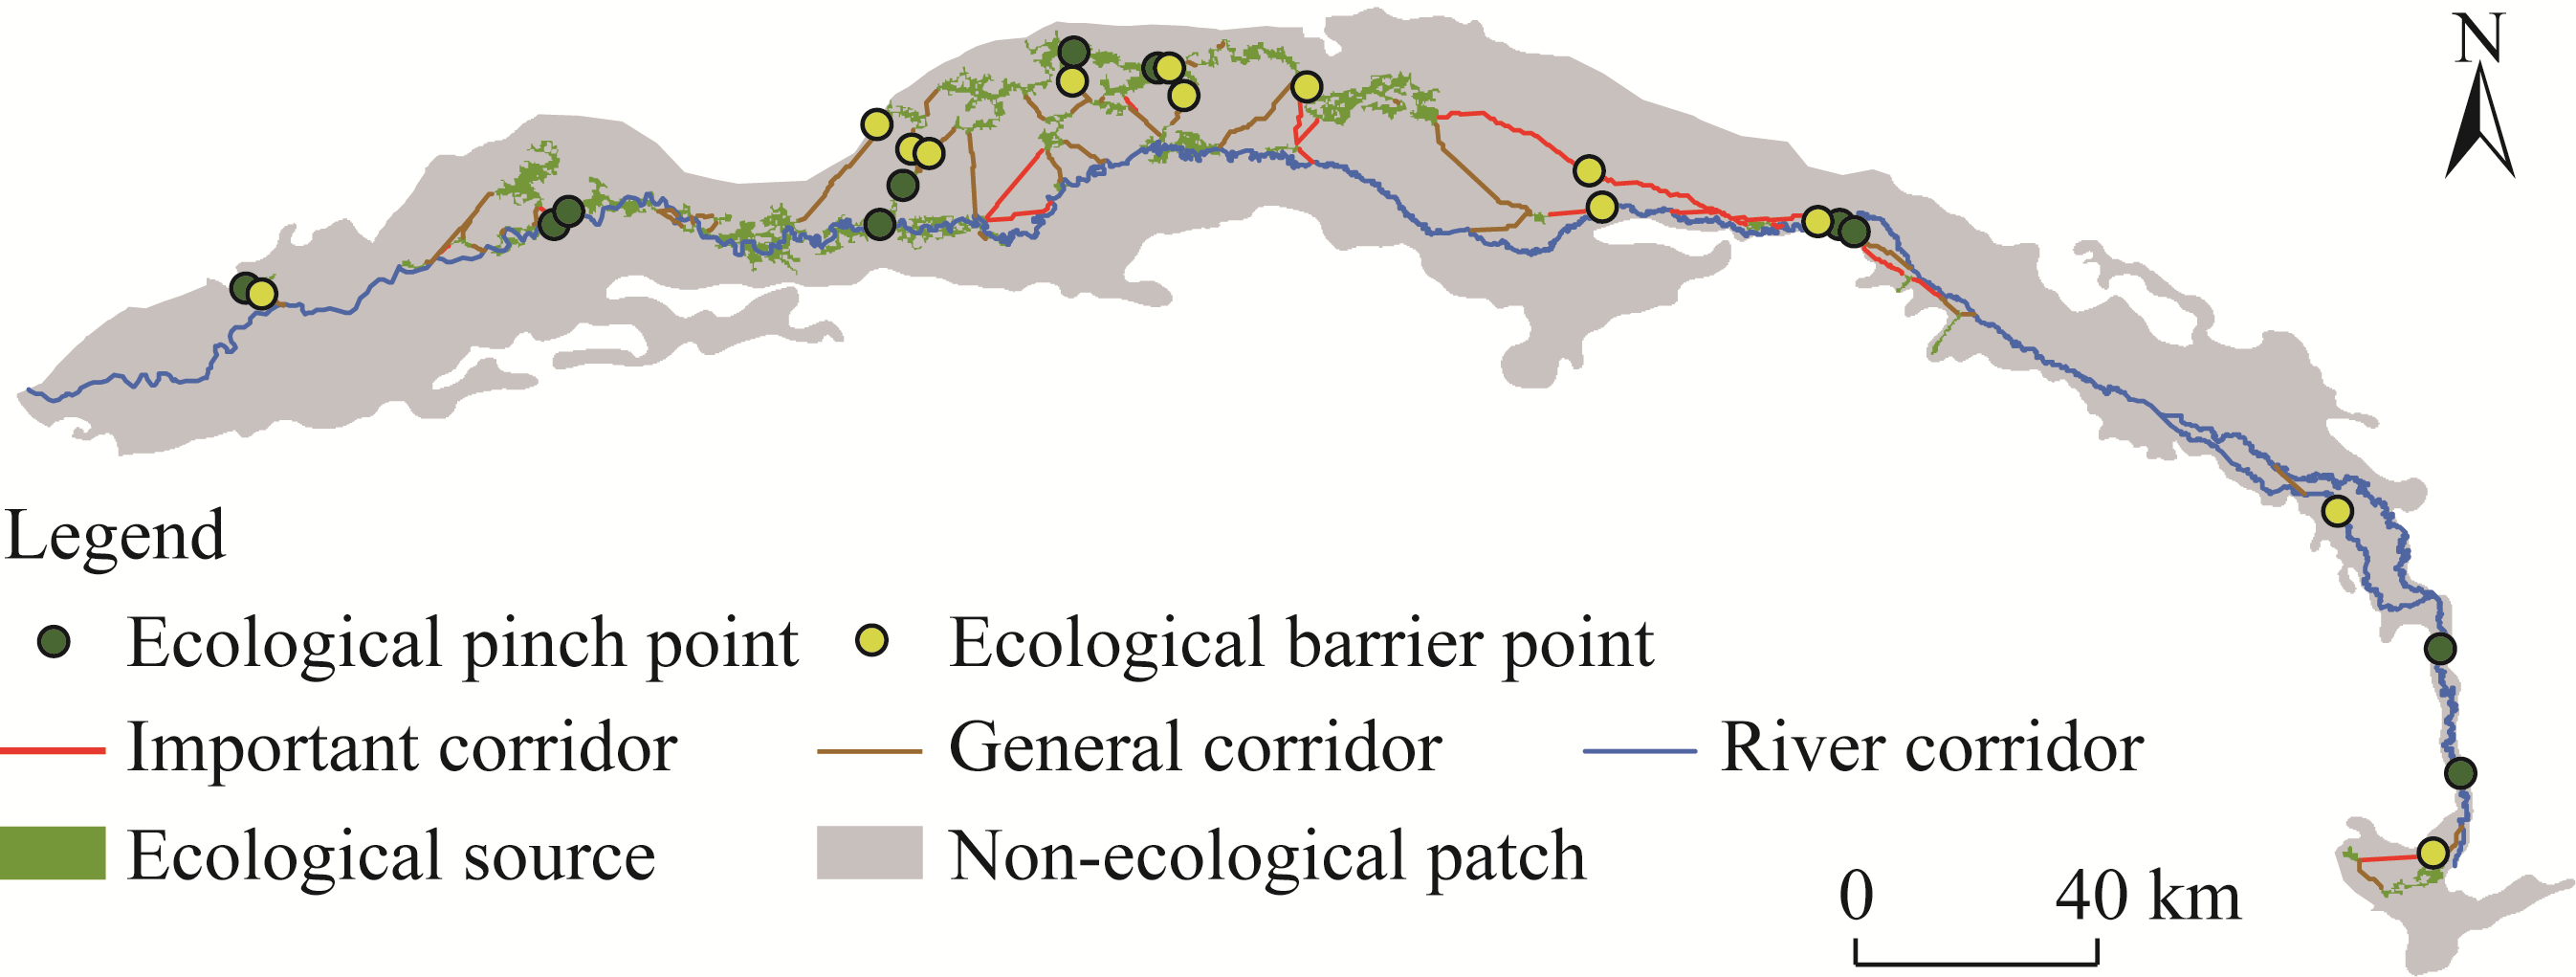
Abstract Scientifically constructing an ecological security pattern (ESP) is an important spatial analysis approach to improve ecological functions in arid areas and achieve sustainable development. However, previous research methods ignored the complex trade-offs between ecosystem services in the process of constructing ESP. Taking the mainstream of the Tarim River Basin (MTRB), China as the study area, this study set seven risk scenarios by applying Ordered Weighted Averaging (OWA) model to trade-off the importance of the four ecosystem services adopted by this study (water conservation, carbon storage, habitat quality, and biodiversity conservation), thereby identifying priority protection areas for ecosystem services. And then, this study identified ecological sources by integrating ecosystem service importance with eco-environmental sensitivity. Using circuit theory, the ecological corridors and nodes were extracted to construct the ESP. The results revealed significant spatial heterogeneity in the four ecosystem services across the study area, primarily driven by hydrological gradients and human activity intensity. The ESP of the MTRB included 34 ecological sources with a total area of 1471.38 km², 66 ecological corridors with a length of about 1597.45 km, 11 ecological pinch points, and 13 ecological barrier points distributed on the ecological corridors. The spatial differentiation of the ESP was obvious, with the upper and middle reaches of the MTRB having a large number of ecological sources and exhibiting higher clustering of ecological corridors compared with the lower reaches. The upper and middle reaches require ecological protection to sustain the existing ecosystem, while the lower reaches need to carry out ecological restoration measures including desertification control. Overall, this study makes up for the shortcomings of constructing ESP simply by spatial superposition of ecosystem service functions and can effectively improve the robustness and stability of ESP construction.
|
|
Received: 26 October 2024
Published: 30 June 2025
|
|
Corresponding Authors:
*LING Hongbo (E-mail: linghb@ms.xjb.ac.cn)
|
|
|
| [1] |
AbdelRahman M A E. 2023. An overview of land degradation, desertification and sustainable land management using GIS and remote sensing applications. Rendiconti Lincei. Scienze Fisiche e Naturali, 34: 767-808.
|
|
|
| [2] |
An Y, Liu S L, Sun Y X, et al. 2021. Construction and optimization of an ecological network based on morphological spatial pattern analysis and circuit theory. Landscape Ecology, 36: 2059-2076.
|
|
|
| [3] |
Bai H N, Weng L F. 2023. Ecological security pattern construction and zoning along the China-Laos Railway based on the potential-connectedness-resilience framework. Ecological Indicators, 146: 109773, doi: 10.1016/j.ecolind.2022.109773.
|
|
|
| [4] |
Bai Z F, Ling H, Xu H J, et al. 2022. Spatiotemporal evolution of desertification based on integrated remote sensing indices in Duolun County, Inner Mongolia. Ecological Informatics, 70: 101750, doi: 10.1016/j.ecoinf.2022.101750.
|
|
|
| [5] |
Cai Y, Liang J S, Zhang P Y, et al. 2021. Review on strategies of close-to-natural wetland restoration and a brief case plan for a typical wetland in northern China. Chemosphere, 285: 131534, doi: 10.1016/j.chemosphere.2021.131534.
|
|
|
| [6] |
Chen S J. 2019. Optimal allocation of water resources in the Tarim River mainstream based on "three red lines". MSc Thesis. Huangzhou: Huazhong University of Science and Technology. (in Chinese)
|
|
|
| [7] |
Chen X Q, Kang B Y, Li M Y, et al. 2023. Identification of priority areas for territorial ecological conservation and restoration based on ecological networks: A case study of Tianjin City, China. Ecological Indicators, 146: 109809, doi: 10.1016/j.ecolind.2022.109809.
|
|
|
| [8] |
Chester C C. 2015. Yellowstone to Yukon: Transborder conservation across a vast international landscape. Environmental Science & Policy, 49: 75-84.
|
|
|
| [9] |
Cui X F, Deng W, Yang J X, et al. 2022. Construction and optimization of ecological security patterns based on social equity perspective: A case study in Wuhan, China. Ecological Indicators, 136: 108714, doi: 10.1016/j.ecolind.2022.108714.
|
|
|
| [10] |
Ding M M, Liu W, Xiao L, et al. 2022. Construction and optimization strategy of ecological security pattern in a rapidly urbanizing region: A case study in central-south China. Ecological Indicators, 136: 108604, doi: 10.1016/j.ecolind.2022.108604.
|
|
|
| [11] |
Dong X, Wang F, Fu M C. 2024a. Research progress and prospects for constructing ecological security pattern based on ecological network. Ecological Indicators, 168: 112800, doi: 10.1016/j.ecolind.2024.112800.
|
|
|
| [12] |
Dong X D, Gong J R, Zhang W Y, et al. 2024b. Importance of including key biodiversity areas in China's conservation area-based network. Biological Conservation, 296: 110676, doi: 10.1016/j.biocon.2024.110676.
|
|
|
| [13] |
Feld C K, Sousa J P, Silva P M, et al. 2010. Indicators for biodiversity and ecosystem services: towards an improved framework for ecosystems assessment. Biodiversity and Conservation, 19: 2895-2919.
|
|
|
| [14] |
Fu Y J, Shi X Y, He J, et al. 2020. Identification and optimization strategy of county ecological security pattern: A case study in the Loess Plateau, China. Ecological Indicators, 112: 106030, doi: 10.1016/j.ecolind.2019.106030.
|
|
|
| [15] |
Gong D H, Huang M, Ge Y, et al. 2025. Revolutionizing ecological security pattern with multi-source data and deep learning: An adaptive generation approach. Ecological Indicators, 173: 113315, doi: 10.1016/j.ecolind.2025.113315.
|
|
|
| [16] |
Gong J, Xie Y C, Cao E J, et al. 2019. Integration of InVEST-habitat quality model with landscape pattern indexes to assess mountain plant biodiversity change: A case study of Bailongjiang Watershed in Gansu Province. Journal of Geographical Sciences, 29: 1193-1210.
doi: 10.1007/s11442-019-1653-7
|
|
|
| [17] |
Guo J, Wang G Y, Xu S W, et al. 2021. Dynamic assessment of Tarim River carbon storage under enhanced water resources management. Arid Zone Research, 38(3): 589-599. (in Chinese)
doi: 10.13866/j.azr.2021.03.01
|
|
|
| [18] |
Gou M M, Li L, Shuai O Y, et al. 2022. Integrating ecosystem service trade-offs and rocky desertification into ecological security pattern construction in the Daning River Basin of Southwest China. Ecological Indicators, 138: 108845, doi: 10.1016/j.ecolind.2022.108845.
|
|
|
| [19] |
Gou R, Su W C, Quan X Y, et al. 2024. Identification of ecological security pattern in FAST Quiet Zone based on ordered weighted averaging and circuit theory. Acta Ecologica Sinica, 44(21): 9636-9651. (in Chinese)
|
|
|
| [20] |
Habersack H, Hein T, Stanica A, et al. 2016. Challenges of river basin management: Current status of, and prospects for, the River Danube from a river engineering perspective. Science of the Total Environment, 543(1): 828-845.
|
|
|
| [21] |
Hao X M, Li W H. 2014. Impacts of ecological water conveyance on groundwater dynamics and vegetation recovery in the lower reaches of the Tarim River in Northwest China. Environmental Monitoring and Assessment, 186: 7605-7616.
doi: 10.1007/s10661-014-3952-x
pmid: 25074365
|
|
|
| [22] |
Huang X X, Wang H J, Shan L Y, et al. 2021. Constructing and optimizing urban ecological network in the context of rapid urbanization for improving landscape connectivity. Ecological Indicators, 132: 108319, doi: 10.1016/j.ecolind.2021.108319.
|
|
|
| [23] |
Jiang H, Eastman R. 2000. Application of fuzzy measures in multi-criteria evaluation in GIS. International Journal of Geographical Information Science, 14(2): 173-184.
|
|
|
| [24] |
Jiang Z M, Yan L, Hao W, et al. 2024. Unveiling the impacts of climate change and human activities on land-use evolution in ecologically fragile urbanizing areas: A case study of China's Central Plains urban agglomeration. Ecological Indicators, 169: 112936, doi: 10.1016/j.ecolind.2024.112936.
|
|
|
| [25] |
Jiao A Y, Wang Z K, Deng X Y, et al. 2022. Eco-hydrological response of water conveyance in the mainstream of the Tarim River, China. Water, 14(17): 2622, doi: 10.3390/w14172622.
|
|
|
| [26] |
Jie C, Jing C, Man Z T, et al. 2002. Soil degradation: a global problem endangering sustainable development. Journal of Geographical Sciences, 12: 243-252.
|
|
|
| [27] |
Kan N, Ali S, Tariq H, et al. 2020. Water conservation and plant survival strategies of rhizobacteria under drought stress. Agronomy, 10(11): 1683, doi: 10.3390/agronomy10111683.
|
|
|
| [28] |
Li H L, Li D H, Li T, et al. 2010. Application of least-cost path model to identify a giant panda dispersal corridor network after the Wenchuan earthquake—Case study of Wolong Nature Reserve in China. Ecological Modelling, 221(6): 944-952.
|
|
|
| [29] |
Li J, Li S, Zhang Y, et al. 2023. Spatio-temporal variation of biodiversity maintenance function and its driving factors in the Yellow River Basin from 2000 to 2020. China Environmental Science, 43(9): 4780-4790. (in Chinese)
|
|
|
| [30] |
Li J L, Xu J G, Chu J L. 2019. The construction of a regional ecological security pattern based on circuit theory. Sustainability, 11(22): 6343, doi: 10.3390/su11226343.
|
|
|
| [31] |
Li L J, Fu M C, Zhu Y X, et al. 2024a. The current situation and trend of land ecological security evaluation from the perspective of global change. Ecological Indicators, 167: 112608, doi: 10.1016/j.ecolind.2024.112608.
|
|
|
| [32] |
Li M Y, Deng M J, Ling H B, et al. 2024b. Development of a new rotational irrigation model in an arid basin based on ecological zoning and sluice regulation. Agricultural Water Management, 296: 108800, doi: 10.1016/j.agwat.2024.108800.
|
|
|
| [33] |
Li S C, Xiao W, Zhao Y L, et al. 2020. Incorporating ecological risk index in the multi-process MCRE model to optimize the ecological security pattern in a semi-arid area with intensive coal mining: A case study in northern China. Journal of Cleaner Production, 247: 119143, doi: 10.1016/j.jclepro.2019.119143.
|
|
|
| [34] |
Li W W, Huang F, Shi F Z, et al. 2021. Human and climatic drivers of land and water use from 1997 to 2019 in Tarim River Basin, China. International Soil and Water Conservation Research, 9(4): 532-543.
|
|
|
| [35] |
Li Y Y, Wei M, Zhou R, et al. 2025. Identifying priority restoration areas based on ecological security pattern: implications for ecological restoration planning. Ecological Indicators, 174: 113486, doi: 10.1016/j.ecolind.2025.113486.
|
|
|
| [36] |
Ling H B, Zhang P, Xu H L, et al. 2016. Determining the ecological water allocation in a hyper-arid catchment with increasing competition for water resources. Global and Planetary Change, 145: 143-152.
|
|
|
| [37] |
Ling H B, Zhang P, Xu H L, et al. 2017. Negative feedback adjustment challenges reconstruction study from tree rings: A study case of response of Populus Euphratica to river discontinuous flow and ecological water conveyance. Science of the Total Environment, 574: 109-119.
|
|
|
| [38] |
Lu J, Zhang X J, Ye P S, et al. 2020. Remote sensing monitoring of salinization in Hetao Irrigation District based on SI-MSAVI feature space. Remote Sensing for Natural Resources, 32(1): 169-175. (in Chinese)
|
|
|
| [39] |
Meersmans J, Arrouays D, Rompaey A J, et al. 2016. Future C loss in mid-latitude mineral soils: climate change exceeds land use mitigation potential in France. Scientific Reports, 6: 35798, doi: 10.1038/srep35798.
pmid: 27808169
|
|
|
| [40] |
Mittermeier R A, Turner W R, Larsen F W, et al. 2011. Global biodiversity conservation:the critical role of hotspots. Biodiversity Hotspots. Berlin and Heidelberg: Springer, 3-22.
|
|
|
| [41] |
Mix K, Groeger A, Lopes V. 2016. Impacts of dam construction on streamflows during drought periods in the Upper Colorado River Basin, Texas. Lakes & Reservoirs: Research and Management, 21(4): 329-337.
|
|
|
| [42] |
Mu Y R, Shen W. 2022. Mathematical problems in engineering landscape ecological security assessment and ecological pattern optimization of inland river basins in arid regions: a case study in Tarim River Basin. Mathematical Problems in Engineering, Special Issue: Artificial Intelligence Edge Computing for Innovative Applications: 9476860, doi: 10.1155/2022/9476860.
|
|
|
| [43] |
Myers N, Mittermeier R A, Mittermeier C G, et al. 2000. Biodiversity hotspots for conservation priorities. Nature, 403: 853-858.
|
|
|
| [44] |
Nguyen K A, Liou Y A. 2019. Mapping global eco-environment vulnerability due to human and nature disturbances. MethodsX, 6: 862-875.
|
|
|
| [45] |
Oguh C E, Obiwulu E, Jennifer U O, et al. 2021. Ecosystem and ecological services; need for biodiversity conservation-a critical review. Asian Journal of Biology, 11(4): 1-14.
|
|
|
| [46] |
Okur B, Örçen N. 2020. Chapter 12 - soil salinization and climate change. Climate Change and Soil Interactions. Amsterdam: Elsevier, 331-350.
|
|
|
| [47] |
Pan J H, Liang J, Zhao C C. 2023. Identification and optimization of ecological security pattern in arid inland basin based on ordered weighted average and ant colony algorithm: a case study of Shule River Basin, Northwest China. Ecological Indicators, 154: 110588, doi: 10.1016/j.ecolind.2023.110588.
|
|
|
| [48] |
Peng J, Li H L, Liu Y X, et al. 2018. Identification and optimization of ecological security pattern in Xiong'an New Area, Acta Geographica Sinica, 73(4): 701-710.
|
|
|
| [49] |
Pittock J. 2016. The Murray-Darling Basin:Climate change, infrastructure, and water. Increasing Resilience to Climate Variability and Change. Water Resources Development and Management. Singapore: Springer, 41-59.
|
|
|
| [50] |
Qian K X, Ma X F, Yan W, et al. 2024. Trade-offs and synergies among ecosystem services in inland river basins under the influence of ecological water transfer project: a case study on the Tarim River Basin. Science of the Total Environment, 908: 168248, doi: 10.1016/j.scitotenv.2023.168248.
|
|
|
| [51] |
Shu R, Ma G Q, Zou Y B, et al. 2024. Bibliometric analysis of ecological security pattern construction: Current status, evolution, and development trends. Ecological Indicators, 169: 112754, doi: 10.1016/j.ecolind.2024.112754.
|
|
|
| [52] |
Song Y D, Wang R H, Peng Y S. 2002. Water resources and ecological conditions in the Tarim Basin. Science in China Series D: Earth Sciences, 45: 11-17.
|
|
|
| [53] |
Terrado M, Sabater S, Kramer B C, et al. 2016. Model development for the assessment of terrestrial and aquatic habitat quality in conservation planning. Science of the Total Environment, 540(1): 63-70.
|
|
|
| [54] |
Wang S, Wu M Q, Hu M M, et al. 2021. Promoting landscape connectivity of highly urbanized area: An ecological network approach. Ecological Indicators, 125: 107487, doi: 10.1016/j.ecolind.2021.107487.
|
|
|
| [55] |
Wang S, Wu M Q, Hu M M, et al. 2022. Integrating ecosystem services and landscape connectivity into the optimization of ecological security pattern: a case study of the Pearl River Delta, China. Environmental Science and Pollution Research, 29: 76051-76065.
|
|
|
| [56] |
Winkler K, Fuchs R, Rounsevell M, et al. 2021. Global land use changes are four times greater than previously estimated. Nature Communications, 12: 2501, doi: 10.1038/s41467-021-22702-2.
pmid: 33976120
|
|
|
| [57] |
Xu H L, Zhou B, Song Y D. 2010. Impacts of climate change on headstream runoff in the Tarim River Basin. Hydrology Research, 42(1): 20-29.
|
|
|
| [58] |
Xu X L, Wang S Y, Rong W Z. 2023. Construction of ecological network in Suzhou based on the PLUS and MSPA models. Ecological Indicators, 154: 110740, doi: 10.1016/j.ecolind.2023.110740.
|
|
|
| [59] |
Xue L Q, Wang J, Zhang L C, et al. 2019. Spatiotemporal analysis of ecological vulnerability and management in the Tarim River Basin, China. Science of the Total Environment, 649: 876-888.
|
|
|
| [60] |
Yang L J, Wang J, Wei W, et al. 2020. Ecological security pattern construction and optimization in arid inland river basin: a case study of Shiyang River Basin. Acta Ecologica Sinica, 40(17): 5915-5927. (in Chinese)
|
|
|
| [61] |
Zhang H, Xue L Q, Wei G H, et al. 2020. Assessing vegetation dynamics and landscape ecological risk on the mainstream of Tarim River, China. Water, 12(8): 2156, doi: 10.3390/w12082156.
|
|
|
| [62] |
Zhang J J, Hao X M, Li X W, et al. 2024. Evaluation and regulation strategy for ecological security in the Tarim River Basin based on the ecological footprint. Journal of Cleaner Production, 435: 140488, doi: 10.1016/j.jclepro.2023.140488.
|
|
|
| [63] |
Zhang Y L, Zhao Z Y, Fu B J, et al. 2022. Identifying ecological security patterns based on the supply, demand and sensitivity of ecosystem service: A case study in the Yellow River Basin, China. Journal of Environmental Management, 315(1): 115158, doi: 10.1016/j.jenvman.2022.115158.
|
|
|
| [64] |
Zhao W Z, Han Z L, Yan X L, et al. 2020. Ecological security pattern construction based on multi-scenario trade-off of ecosystem services: A case study of Wafangdian, Dalian. Journal of Natural Resources, 35(3): 546-562. (in Chinese)
|
|
|
| [65] |
Zou J W, Li H, Ding C, et al. 2024. Mapping natural Populus Euphratica forests in the mainstream of the Tarim River using spaceborne imagery and Google Earth Engine. Remote Sensing, 16(18): 3429, doi: 10.3390/rs16183429.
|
|
|
| [66] |
Zou Y, Xu J Z, Zhang R L. 2020. Rethinking vulnerability and human behaviour in arid and semi-arid regions in northwestern China. Environmental Monitoring and Assessment, 192: 379, doi: 10.1007/s10661-020-08320-3.
pmid: 32424725
|
|
|
|
Viewed |
|
|
|
Full text
|
|
|
|
|
Abstract
|
|
|
|
|
Cited |
|
|
|
|
| |
Shared |
|
|
|
|
| |
Discussed |
|
|
|
|