| Research article |
|

|
|
|
| Mapping fruit orchard species for smallholders in drought-vulnerable agroforestry systems of China |
ZHANG Jingge1, HUANG Huaguo1,2, YUAN Xiaotian3, TAN Shen1,2,*( ) ) |
1 State Key Laboratory to Efficient Production of Forest Resources, College of Forestry, Beijing Forestry University, Beijing 100083, China
2 Engineering Research Center of Carbon Sequestration of Forest and Grassland, Ministry of Education, Beijing 100083, China
3 College of Urban and Environmental Science, Northwest University, Xi'an 710127, China |
|
|
|
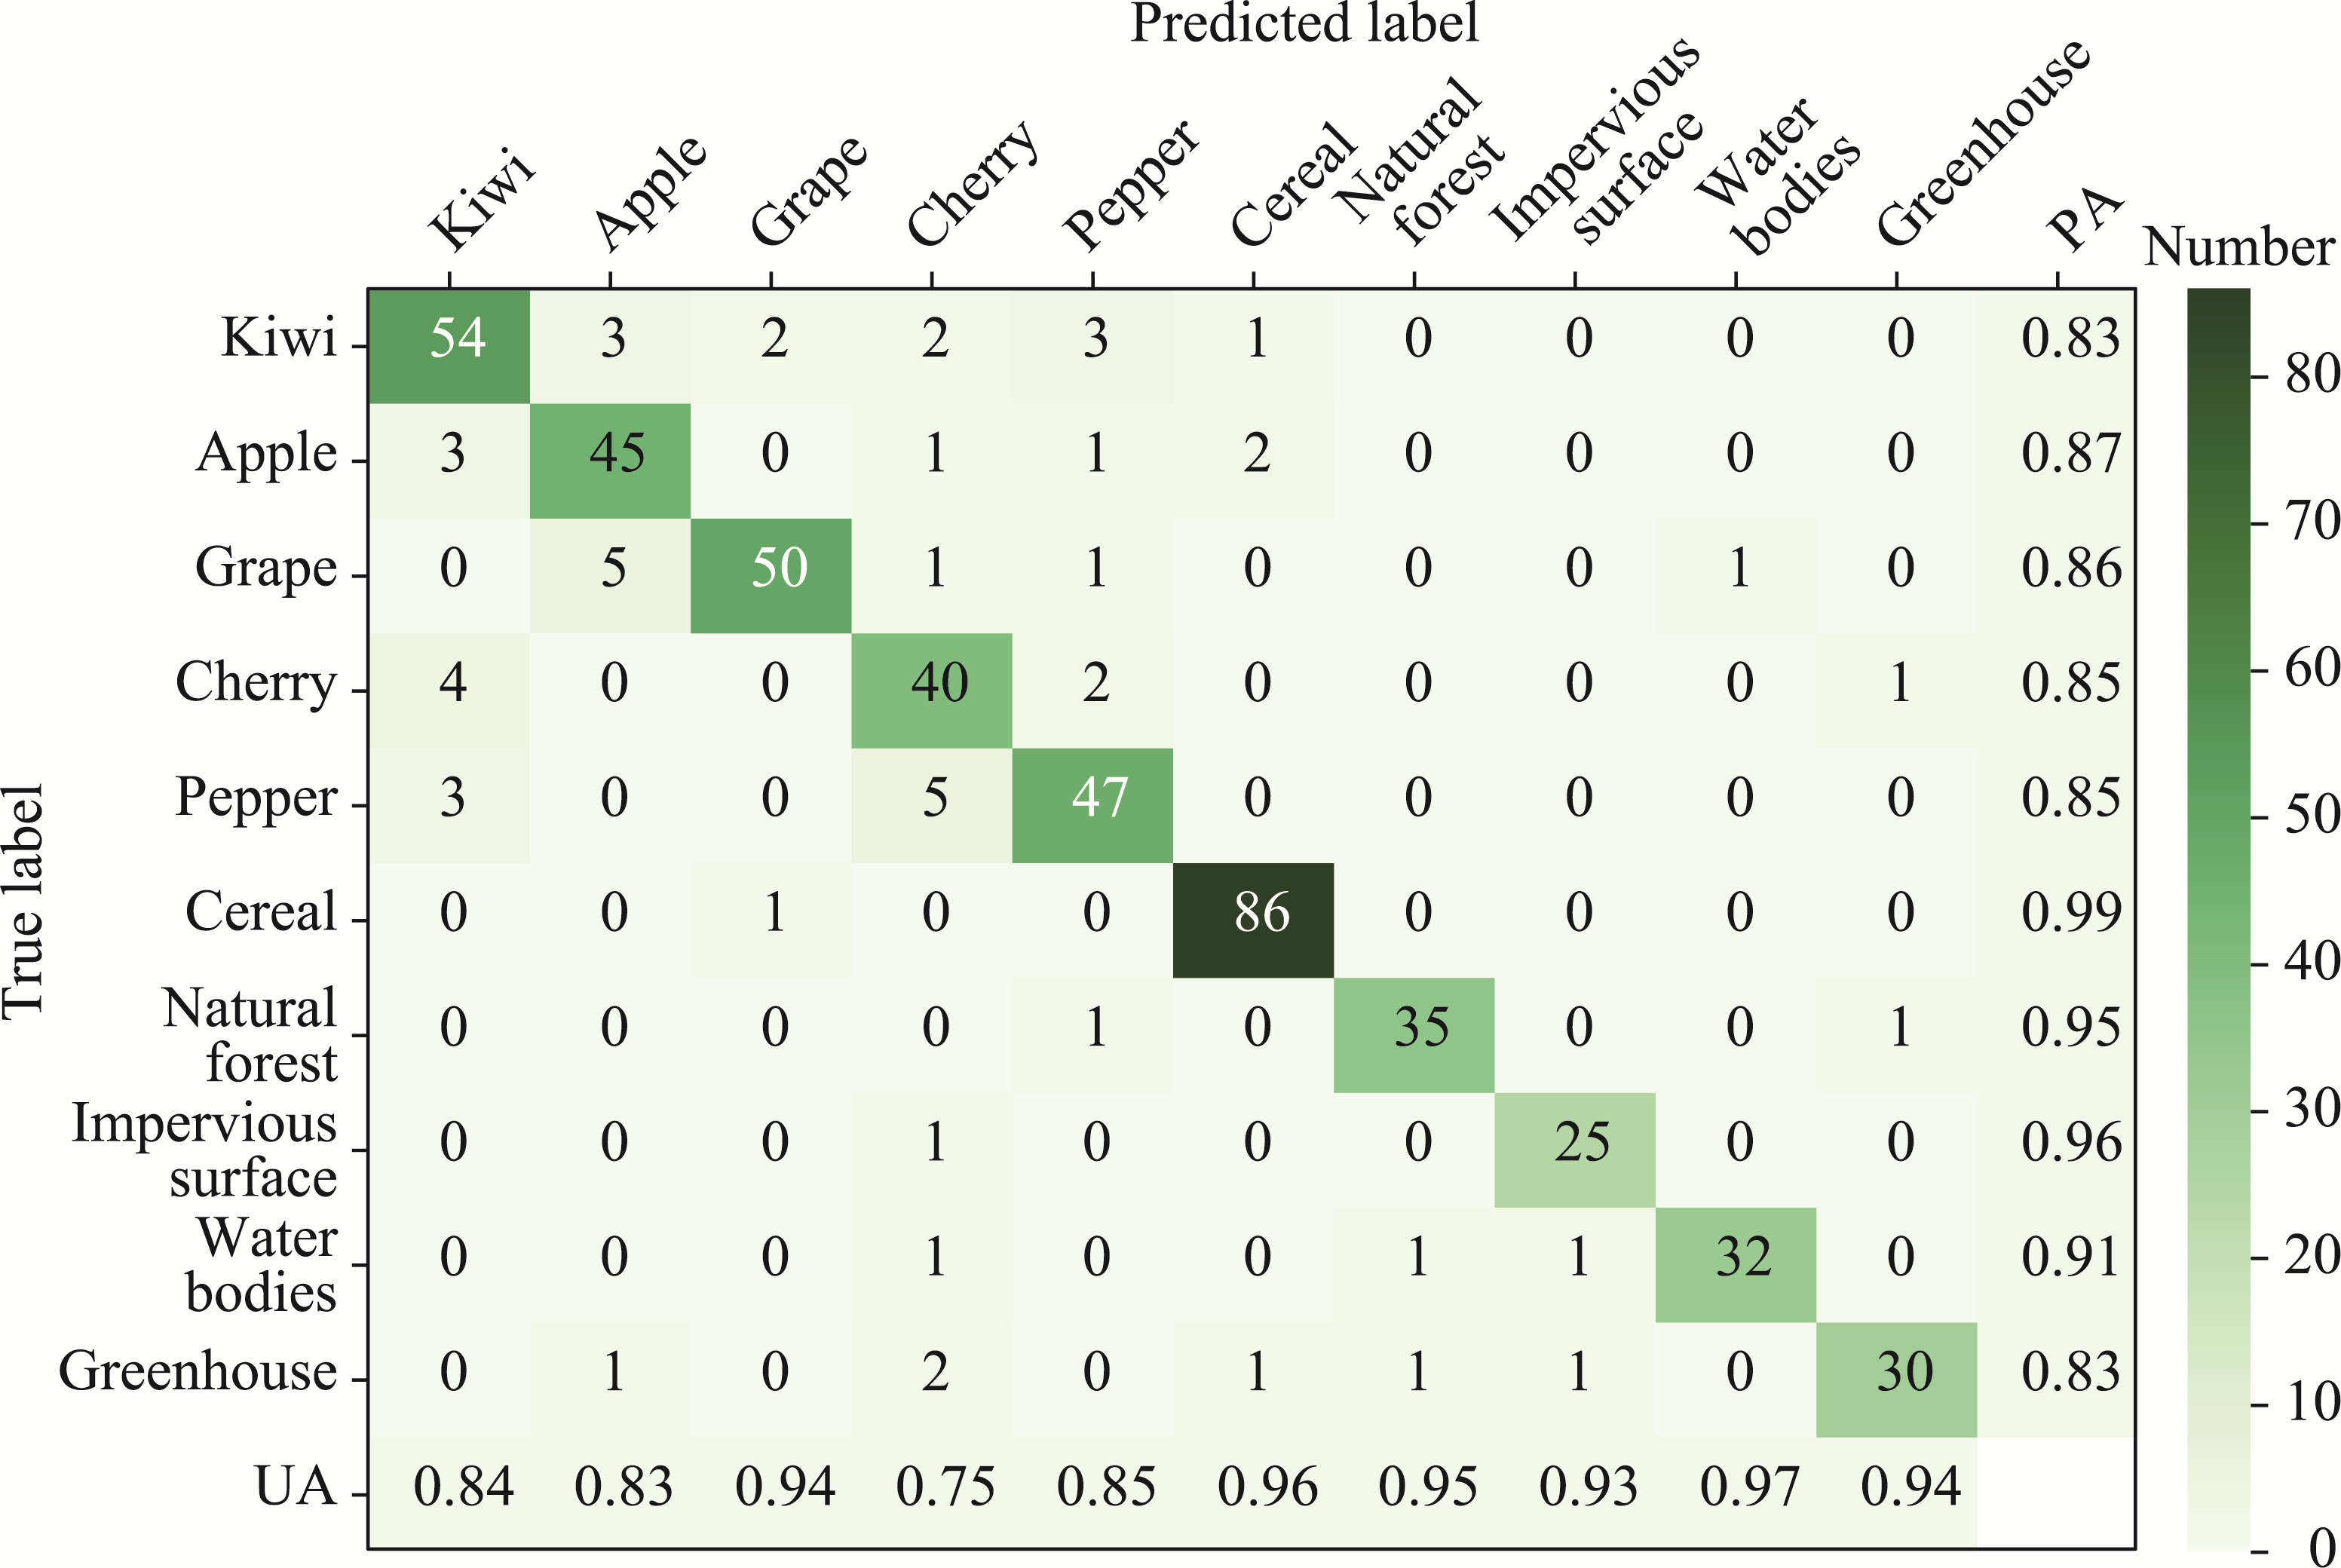
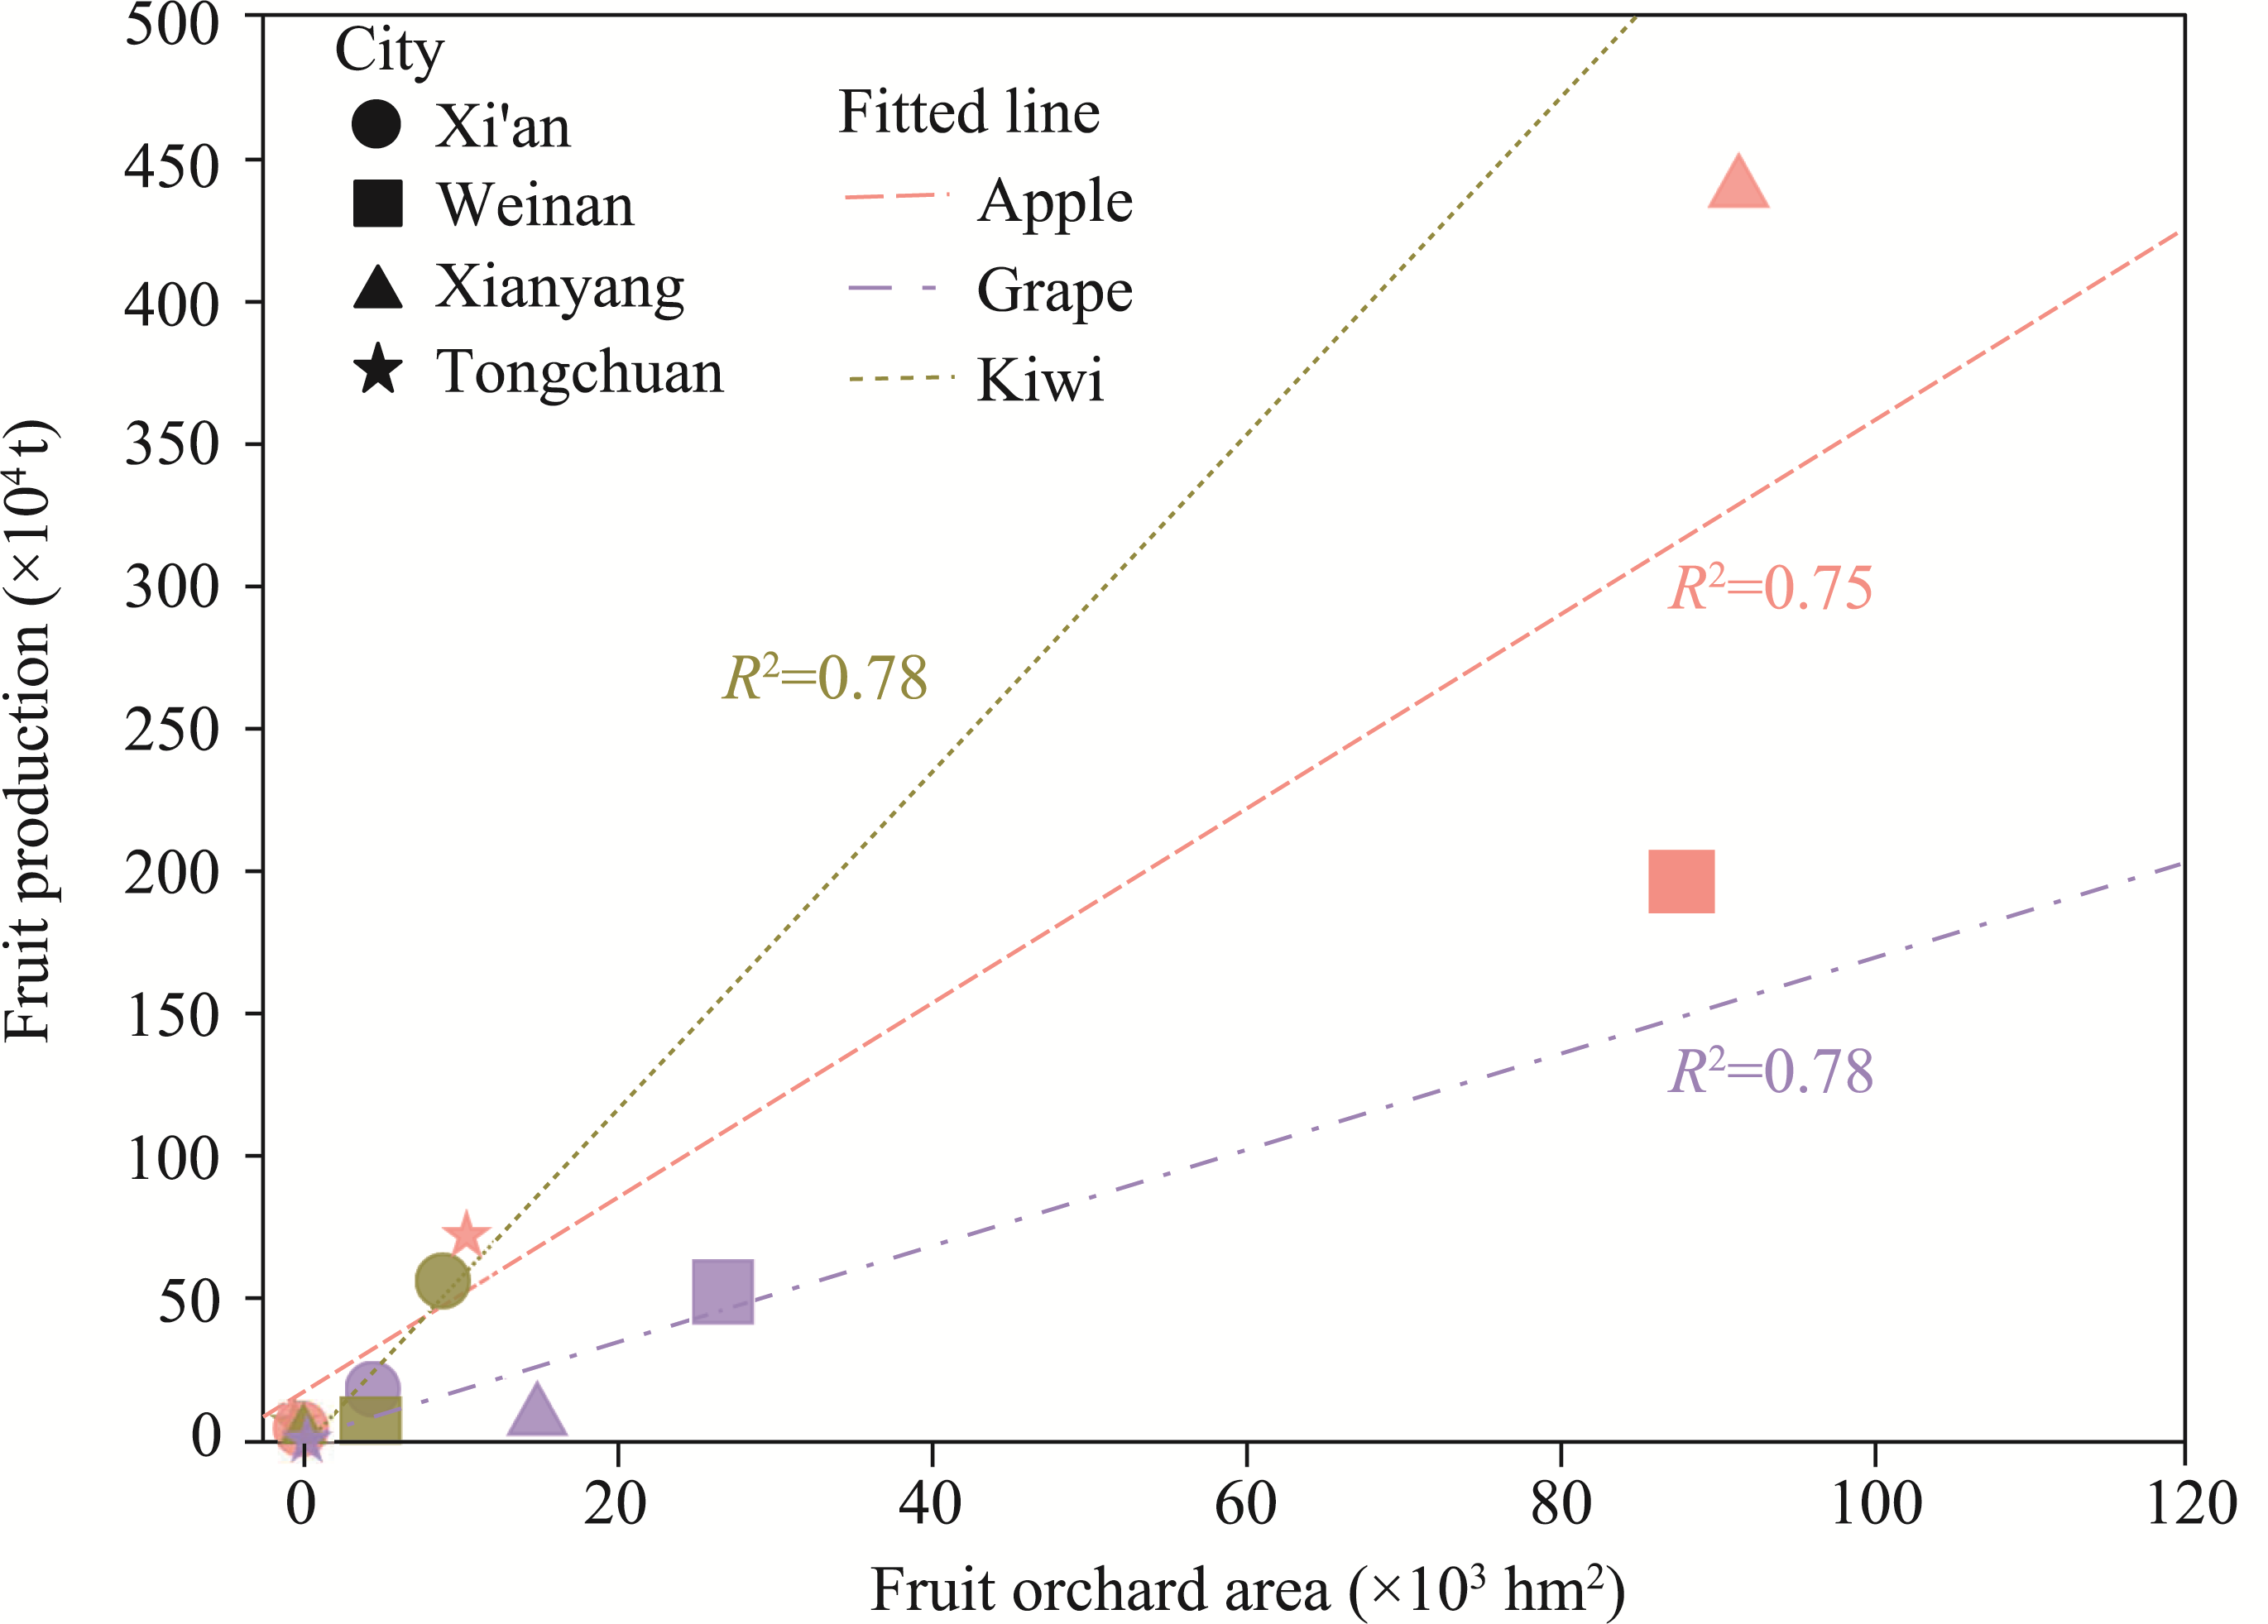
Abstract Fruit trees are typically organized at the orchard level, where the tree-based ecosystem is characterized by high homogeneity, leading to clustered distributions with distinct boundaries. While remote sensing-based classification techniques are well established, most studies have not treated fruit orchards as a distinct category. Whether remote sensing can effectively address orchard classification and distribution remains uncertain. This study focused on the Guanzhong Plain on the southern part of the Loess Plateau as a representative drought-vulnerable region in China, characterized by mixed orchard-cropland landscapes. Sentinel-2 imagery was used as the primary classification feature, supplemented by topographic characteristics. A Random Forest classifier was trained and validated using 1980 ground samples across major planting regions in May 2024. The final classification results were satisfactory, with an overall accuracy of 0.86. Meanwhile, a comparison against statistical data demonstrated the reasonableness of fruit orchard area: the correlation coefficients for three major fruit types (apple, grape, and kiwi) are greater than 0.75. Compared with existing land cover products, which often misclassify fruit trees as cropland or forestland, our results demonstrated that combining band reflectance time series, vegetation index time series, and topographic features can effectively differentiate fruit orchards from spectrally similar cropland and forestland. This study facilitates precise fruit orchard mapping, supporting targeted production management and ecological carbon sequestration estimation in similar regions with drought-vulnerable agroforestry systems.
|
|
Received: 06 June 2025
Published: 31 May 2026
|
|
Corresponding Authors:
*TAN Shen (E-mail: tanshen@bjfu.edu.cn)
|
| About author: Author contributions
Conceptualization: TAN Shen, YUAN Xiaotian; Methodology: ZHANG Jingge, TAN Shen; Formal analysis: ZHANG Jingge; Writing - original draft preparation: ZHANG Jingge, TAN Shen; Writing - review and editing: ZHANG Jingge, HUANG Huaguo, TAN Shen; Funding acquisition: HUANG Huaguo, YUAN Xiaotian; Resources: YUAN Xiaotian; Supervision: HUANG Huaguo, TAN Shen. All authors approved the manuscript.
|
|
|
| [1] |
Alimjan G, Sun T L, Liang Y, et al. 2018. A new technique for remote sensing image classification based on combinatorial algorithm of SVM and KNN. International Journal of Pattern Recognition and Artificial Intelligence, 32(7): 1859012, doi: 10.1142/S0218001418590127.
|
|
|
| [2] |
Argenti F, Lapini A, Bianchi T, et al. 2013. A tutorial on speckle reduction in synthetic aperture radar images. IEEE Geoscience and Remote Sensing Magazine, 1(3): 6-35.
|
|
|
| [3] |
Aworh O C. 2015. Promoting food security and enhancing Nigeria's small farmers' income through value-added processing of lesser-known and under-utilized indigenous fruits and vegetables. Food Research International, 76: 986-991.
doi: 10.1016/j.foodres.2015.06.003
|
|
|
| [4] |
Berhane T M, Lane C R, Wu Q, et al. 2018. Decision-tree, rule-based, and random forest classification of high-resolution multispectral imagery for wetland mapping and inventory. Remote Sensing, 10(4): 580, doi: 10.3390/rs10040580.
|
|
|
| [5] |
Bittencourt H R, Clarke R T. 2003. Use of classification and regression trees (CART) to classify remotely-sensed digital images. In: International Geoscience and Remote Sensing Symposium (IGARSS). Toulouse: IEEE, 3751-3753.
|
|
|
| [6] |
Brown C F, Brumby S P, Guzder-Williams B, et al. 2022. Dynamic World, Near real-time global 10 m land use land cover mapping. Scientific Data, 9(1): 251, doi: 10.1038/s41597-022-01307-4.
|
|
|
| [7] |
Bureau of Statistics of Shaanxi Province. 2024. Shaanxi Statistical Yearbook 2024. Beijing: China Statistics Press. (in Chinese)
|
|
|
| [8] |
Campos J C, Sillero N, Brito J C. 2012. Normalized difference water indexes have dissimilar performances in detecting seasonal and permanent water in the Sahara-Sahel transition zone. Journal of Hydrology, 464-465: 438-446.
doi: 10.1016/j.jhydrol.2012.07.042
|
|
|
| [9] |
Carranca C, Brunetto G, Tagliavini M. 2018. Nitrogen nutrition of fruit trees to reconcile productivity and environmental concerns. Plants, 7(1): 4, doi: 10.3390/plants7010004.
|
|
|
| [10] |
Conway G. 2014. On being a smallholder. In: Hazell P BR, RahmanA. New Directions for SmallholderAgriculture. Oxford: Oxford University Press, 15-35.
|
|
|
| [11] |
Dash J, Curran P J. 2004. The MERIS terrestrial chlorophyll index. International Journal of Remote Sensing, 25(23): 5403-5413.
doi: 10.1080/0143116042000274015
|
|
|
| [12] |
Demestihas C, Plénet D, Génard M, et al. 2017. Ecosystem services in orchards. A review. Agronomy for Sustainable Development, 37: 12, doi: 10.1007/s13593-017-0422-1.
|
|
|
| [13] |
Dong J W, Xiao X M, Kou W L, et al. 2015. Tracking the dynamics of paddy rice planting area in 1986-2010 through time series Landsat images and phenology-based algorithms. Remote Sensing of Environment, 160: 99-113.
doi: 10.1016/j.rse.2015.01.004
|
|
|
| [14] |
Eichholzer M, Lüthy J, Gutzwiller F, et al. 2001. The role of folate, antioxidant vitamins and other constituents in fruit and vegetables in the prevention of cardiovascular disease: the epidemiological evidence. International Journal for Vitamin and Nutrition Research, 71(1): 5-17.
pmid: 11276922
|
|
|
| [15] |
Farr T G, Rosen P A, Caro E, et al. 2007. The shuttle radar topography mission. Reviews of Geophysics, 45(2): RG2004, doi: 10.1029/2005RG000183.
|
|
|
| [16] |
Feng X L, Tan S, Dong Y, et al. 2023. Mapping large-scale bamboo forest based on phenology and morphology features. Remote Sensing, 15(2): 515, doi: 10.3390/rs15020515.
|
|
|
| [17] |
Flores-Anderson A I, Herndon K E, Thapa R B, et al. 2019. The SAR Handbook: Comprehensive Methodologies for Forest Monitoring and Biomass Estimation. [2025-03-30]. https://ntrs.nasa.gov/citations/20190002563.
|
|
|
| [18] |
Gelaye Y, Getahun S. 2024. A review of the carbon sequestration potential of fruit trees and their implications for climate change mitigation: The case of Ethiopia. Cogent Food & Agriculture, 10(1): 2294544, doi: 10.1080/23311932.2023.2294544.
|
|
|
| [19] |
Gitelson A A, Viña A, Arkebauer T J, et al. 2003. Remote estimation of leaf area index and green leaf biomass in maize canopies. Geophysical Research Letters, 30(5): 16450, doi: 10.1029/2002GL016450.
|
|
|
| [20] |
Gómez-Chova L, Tuia D, Moser G, et al. 2015. Multimodal classification of remote sensing images: A review and future directions. Proceedings of the IEEE, 103(9): 1560-1584.
doi: 10.1109/JPROC.2015.2449668
|
|
|
| [21] |
Gong P, Liu H, Zhang M, et al. 2019. Stable classification with limited sample: Transferring a 30-m resolution sample set collected in 2015 to mapping 10-m resolution global land cover in 2017. Science Bulletin, 64(6): 370-373.
doi: 10.1016/j.scib.2019.03.002
pmid: 36659725
|
|
|
| [22] |
Gorelick N, Hancher M, Dixon M, et al. 2017. Google Earth Engine: Planetary-scale geospatial analysis for everyone. Remote Sensing of Environment, 202: 18-27.
doi: 10.1016/j.rse.2017.06.031
|
|
|
| [23] |
Hameed K, Chai D, Rassau A. 2018. A comprehensive review of fruit and vegetable classification techniques. Image and Vision Computing, 80: 24-44.
doi: 10.1016/j.imavis.2018.09.016
|
|
|
| [24] |
Huang Z, Zhang X H, Wang H S, et al. 2024. Pear fruit detection model in natural environment based on lightweight transformer architecture. Agriculture, 15(1): 24, doi: 10.3390/agriculture15010024.
|
|
|
| [25] |
Huang Z H, Zhong L H, Zhao F, et al. 2023. A spectral-temporal constrained deep learning method for tree species mapping of plantation forests using time series Sentinel-2 imagery. ISPRS Journal of Photogrammetry and Remote Sensing, 204: 397-420.
doi: 10.1016/j.isprsjprs.2023.09.009
|
|
|
| [26] |
Huete A, Didan K, Miura T, et al. 2002. Overview of the radiometric and biophysical performance of the MODIS vegetation indices. Remote Sensing of Environment, 83(1-2): 195-213.
doi: 10.1016/S0034-4257(02)00096-2
|
|
|
| [27] |
Jiang R G, Xie J C, Zhao Y, et al. 2017. Spatiotemporal variability of extreme precipitation in Shaanxi Province under climate change. Theoretical and Applied Climatology, 130: 831-845.
doi: 10.1007/s00704-016-1910-y
|
|
|
| [28] |
Karydas C G, Gitas I Z. 2011. Development of an IKONOS image classification rule-set for multi-scale mapping of Mediterranean rural landscapes. International Journal of Remote Sensing, 32(24): 9261-9277.
doi: 10.1080/01431161.2010.551549
|
|
|
| [29] |
Li J B, Yang G J, Yang H, et al. 2023. Orchard classification based on super-pixels and deep learning with sparse optical images. Computers and Electronics in Agriculture, 215: 108379, doi: 10.1016/j.compag.2023.108379.
|
|
|
| [30] |
Lin C X, Zhou J X, Yin L K, et al. 2024. Sub-national scale mapping of individual olive trees integrating Earth observation and deep learning. ISPRS Journal of Photogrammetry and Remote Sensing, 217: 18-31.
doi: 10.1016/j.isprsjprs.2024.08.003
|
|
|
| [31] |
Liu C, Xiong T W, Gong P, et al. 2018. Improving large-scale moso bamboo mapping based on dense Landsat time series and auxiliary data: A case study in Fujian Province, China. Remote Sensing Letters, 9(1): 1-10.
|
|
|
| [32] |
Liu L Y, Zhang X, Gao Y, et al. 2021. Finer-resolution mapping of global land cover: Recent developments, consistency analysis, and prospects. Journal of Remote Sensing, 2021: 5289697, doi: 10.34133/2021/5289697.
|
|
|
| [33] |
Louis J, Debaecker V, Pflug B, et al. 2016. Sentinel-2 Sen2Cor: L2A processor for users. Proceedings of Living Planet Symposium 2016. Spacebooks Online, 1-8.
|
|
|
| [34] |
Ma Y, Guga S, Xu J, et al. 2021. Comprehensive risk assessment of high temperature disaster to kiwifruit in Shaanxi Province, China. International Journal of Environmental Research and Public Health, 18(19): 10437, doi: 10.3390/ijerph181910437.
|
|
|
| [35] |
Macarringue L S, Pereira P R M. 2022. Developments in land use and land cover classification techniques in remote sensing: A review. Journal of Geographic Information System, 14(1): 1-28.
doi: 10.4236/jgis.2022.141001
|
|
|
| [36] |
Melgani F, Bruzzone L. 2004. Classification of hyperspectral remote sensing images with support vector machines. IEEE Transactions on Geoscience and Remote Sensing, 42(8): 1778-1790.
doi: 10.1109/TGRS.2004.831865
|
|
|
| [37] |
National Bureau of Statistics.2024. China Statistical Yearbook. Beijing: China Statistics Press. (in Chinese)
|
|
|
| [38] |
Oquab M, Darcet T, Moutakanni T, et al. 2023. Dinov2: Learning robust visual features without supervision. [2025-03-30]. https://arxiv.org/pdf/2304.07193.
|
|
|
| [39] |
Ozdarici-Ok A, Ok A O. 2023. Using remote sensing to identify individual tree species in orchards: A review. Scientia Horticulturae, 321: 112333, doi: 10.1016/j.scienta.2023.112333.
|
|
|
| [40] |
Parajuli J, Chhetri N. 2021. Diagnosing multiple disturbances to irrigation systems in Nepal. In: UllahR, SharmaS, MakotoI, et al. Natural Resource Governance in Asia. Amsterdam: Elsevier, 199-217.
|
|
|
| [41] |
Peña M A, Liao R, Brenning A. 2017. Using spectrotemporal indices to improve the fruit-tree crop classification accuracy. ISPRS Journal of Photogrammetry and Remote Sensing, 128: 158-169.
doi: 10.1016/j.isprsjprs.2017.03.019
|
|
|
| [42] |
Peng Y F, Qiu B W, Tang Z H, et al. 2024. Where is tea grown in the world: A robust mapping framework for agroforestry crop with knowledge graph and sentinels images. Remote Sensing of Environment, 303: 114016, doi: 10.1016/j.rse.2024.114016.
|
|
|
| [43] |
Plieninger T. 2012. Monitoring directions and rates of change in trees outside forests through multitemporal analysis of map sequences. Applied Geography, 32(2): 566-576.
doi: 10.1016/j.apgeog.2011.06.015
|
|
|
| [44] |
Rouse J W, Haas R H, Schell J A, et al. 1974. Monitoring the vernal advancement and retrogradation (green wave effect) of natural vegetation (NASA Contractor Report). National Aeronautics and Space Administration/Goddard Space Flight Center (NASA/GSFC). [2025-03-05]. https://ntrs.nasa.gov/citations/19750020419.
|
|
|
| [45] |
Scarano P, Sciarrillo R, Tartaglia M, et al. 2022. Circular economy and secondary raw materials from fruits as sustainable source for recovery and reuse. A review. Trends in Food Science & Technology, 122: 157-170.
|
|
|
| [46] |
Sharma S, Rana V S, Prasad H, et al. 2021. Appraisal of carbon capture, storage, and utilization through fruit crops. Frontiers in Environmental Science, 9: 700768, doi: 10.3389/fenvs.2021.700768.
|
|
|
| [47] |
Tan S, Zhang X, Wang H, et al. 2021. A CNN-based self-supervised synthetic aperture radar image denoising approach. IEEE Transactions on Geoscience and Remote Sensing, 60: 1-15.
|
|
|
| [48] |
Tian F Y, Wu B F, Zeng H W, et al. 2019. Efficient identification of corn cultivation area with multitemporal synthetic aperture radar and optical images in the google earth engine cloud platform. Remote Sensing, 11(6): 629, doi: 10.3390/rs11060629.
|
|
|
| [49] |
Tolan J, Yang H I, Nosarzewski B, et al. 2024. Very high resolution canopy height maps from RGB imagery using self-supervised vision transformer and convolutional decoder trained on aerial lidar. Remote Sensing of Environment, 300: 113888, doi: 10.1016/j.rse.2023.113888.
|
|
|
| [50] |
Wang J, Xiao X M, Qin Y W, et al. 2017. Mapping the dynamics of eastern redcedar encroachment into grasslands during 1984-2010 through PALSAR and time series Landsat images. Remote Sensing of Environment, 190: 233-246.
doi: 10.1016/j.rse.2016.12.025
|
|
|
| [51] |
Warner T A, Steinmaus K. 2005. Spatial classification of orchards and vineyards with high spatial resolution panchromatic imagery. Photogrammetric Engineering & Remote Sensing, 71(2): 179-187.
|
|
|
| [52] |
Wu B F, Zhang M, Zeng H W, et al. 2023. Challenges and opportunities in remote sensing-based crop monitoring: A review. National Science Review, 10(4): nwac290, doi: 10.1093/nsr/nwac290.
|
|
|
| [53] |
Wu J J, Wang N, Shen H Z, et al. 2022. Spatial-temporal variation of climate and its impact on winter wheat production in Guanzhong Plain, China. Computers and Electronics in Agriculture, 195: 106820, doi: 10.1016/j.compag.2022.106820.
|
|
|
| [54] |
Wu T, Wang Y, Yu C J, et al. 2012. Carbon sequestration by fruit trees - Chinese apple orchards as an example. PLoS ONE, 7(6): e38883, doi: 10.1371/journal.pone.0038883.
|
|
|
| [55] |
Xie Y C, Sha Z Y, Yu M. 2008. Remote sensing imagery in vegetation mapping: a review. Journal of Plant Ecology, 1(1): 9-23.
doi: 10.1093/jpe/rtm005
|
|
|
| [56] |
Yang J, Huang X. 2021. The 30 m annual land cover dataset and its dynamics in China from 1990 to 2019. Earth System Science Data, 13(8): 3907-3925.
doi: 10.5194/essd-13-3907-2021
|
|
|
| [57] |
Yeom J, Jung J H, Chang A J, et al. 2019. Comparison of vegetation indices derived from UAV data for differentiation of tillage effects in agriculture. Remote Sensing, 11(13): 1548, doi: 10.3390/rs11131548.
|
|
|
| [58] |
Yin L K, Ghosh R, Lin C X, et al. 2023. Mapping smallholder cashew plantations to inform sustainable tree crop expansion in Benin. Remote Sensing of Environment, 295: 113695, doi: 10.1016/j.rse.2023.113695.
|
|
|
| [59] |
Yu L, Du Z R, Dong R M, et al. 2022. FROM-GLC Plus: Toward near real-time and multi-resolution land cover mapping. GIScience & Remote Sensing, 59(1): 1026-1047.
|
|
|
| [60] |
Zhang Q S, Chu Y Y, Xue Y F, et al. 2020. Outlook of China's agriculture transforming from smallholder operation to sustainable production. Global Food Security, 26: 100444, doi: 10.1016/j.gfs.2020.100444.
|
|
|
| [61] |
Zhang X, Wu B F, Ponce-Campos G E, et al. 2018. Mapping up-to-date paddy rice extent at 10 m resolution in china through the integration of optical and synthetic aperture radar images. Remote Sensing, 10(8): 1200, doi: 10.3390/rs10081200.
|
|
|
| [62] |
Zhao H, Wu B, Zhang M, et al. 2025. A large-scale VHR parcel dataset and a novel hierarchical semantic boundary-guided network for agricultural parcel delineation. ISPRS Journal of Photogrammetry and Remote Sensing, 221: 1-19.
doi: 10.1016/j.isprsjprs.2025.01.034
|
|
|
| [63] |
Zhou X X, Li Y Y, Luo Y K, et al. 2022. Research on remote sensing classification of fruit trees based on Sentinel-2 multi-temporal imageries. Scientific Reports, 12(1): 11549, doi: 10.1038/s41598-022-15414-0.
|
|
|
|
Viewed |
|
|
|
Full text
|
|
|
|
|
Abstract
|
|
|
|
|
Cited |
|
|
|
|
| |
Shared |
|
|
|
|
| |
Discussed |
|
|
|
|