| Research article |
|


|
|
|
| Impacts of extreme climate and vegetation phenology on net primary productivity across the Qinghai- Xizang Plateau, China from 1982 to 2020 |
SUN Huaizhang, ZHAO Xueqiang, CHEN Yangbo*( ), LIU Jun ), LIU Jun |
| School of Geography and Planning, Sun Yat-sen University, Guangzhou 510275, China |
|
|
|
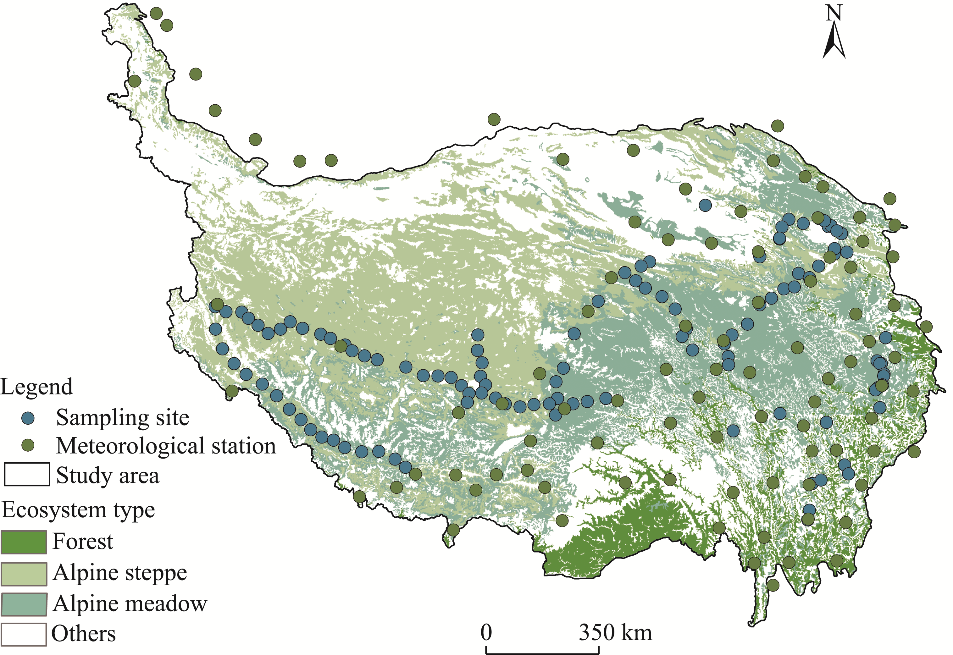
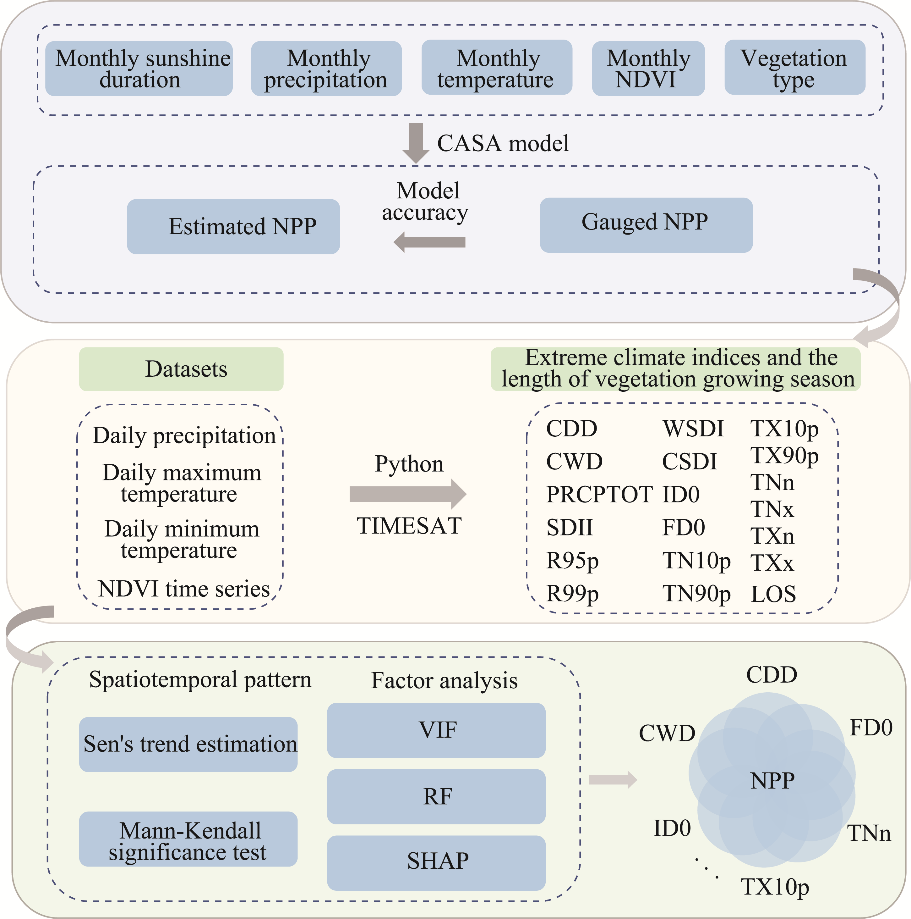
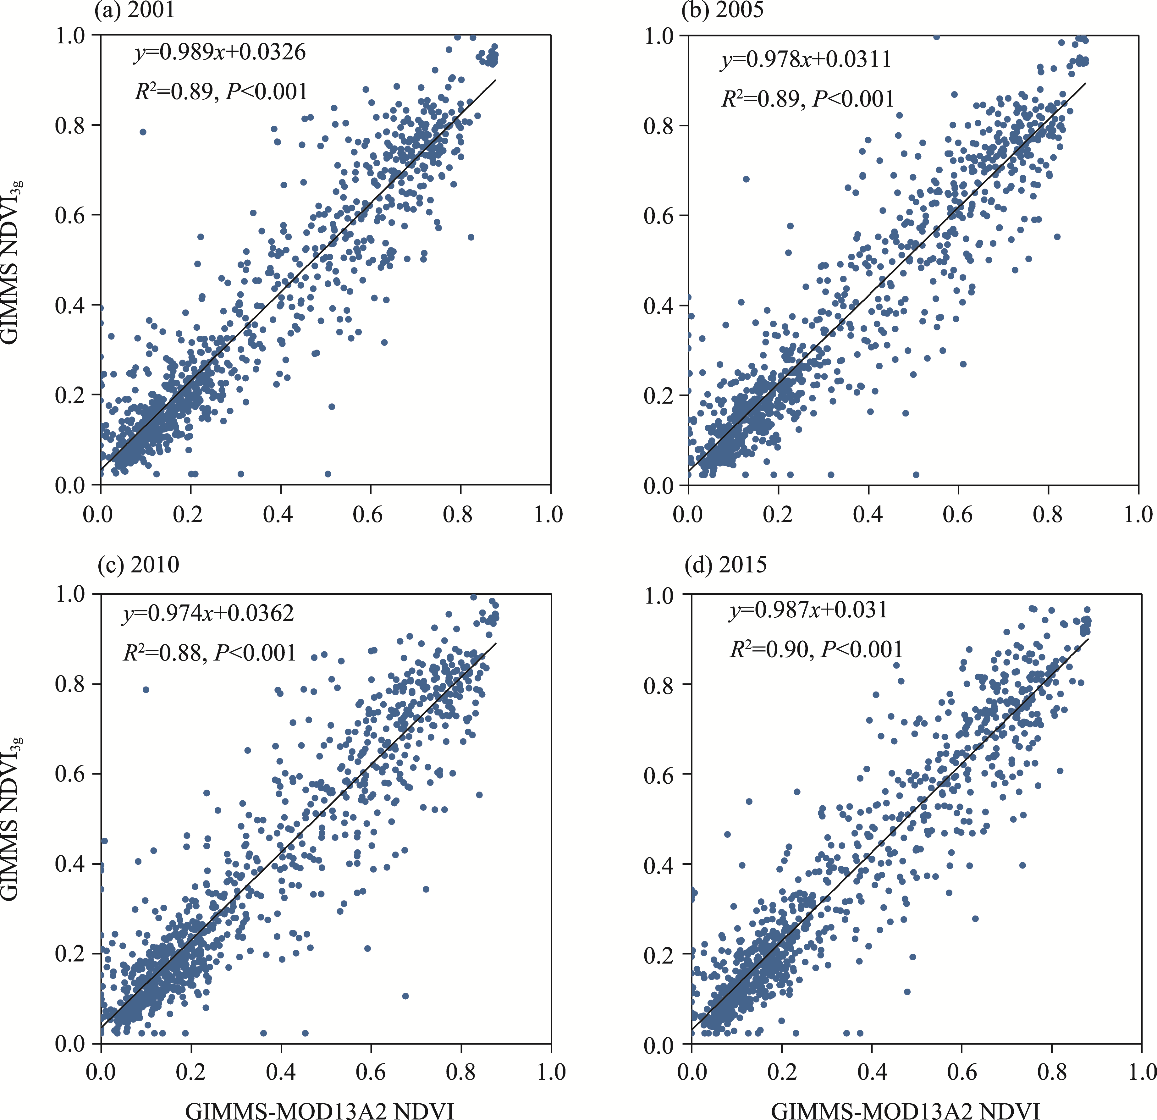
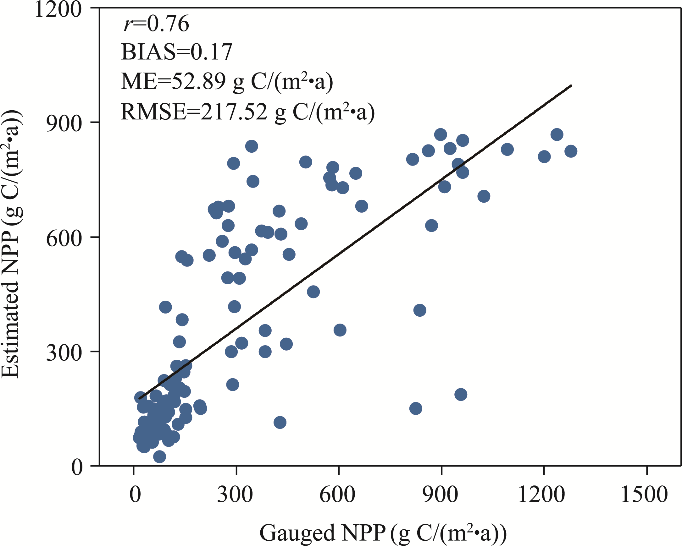
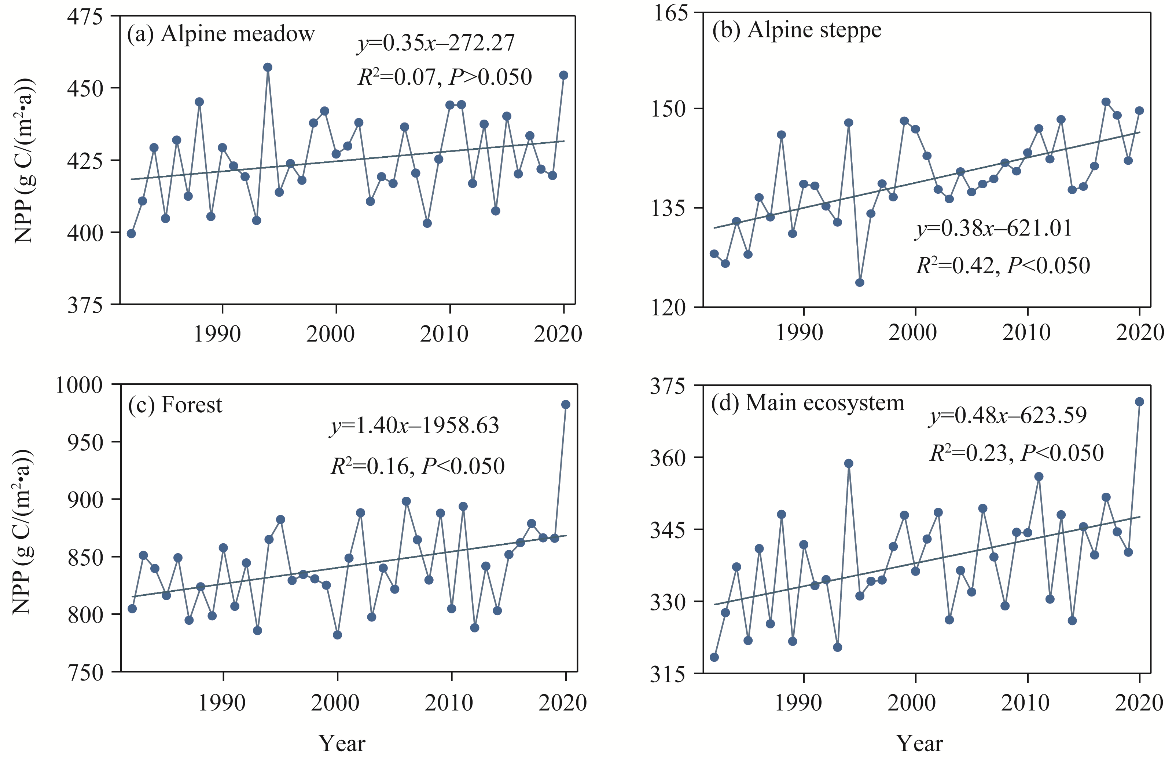
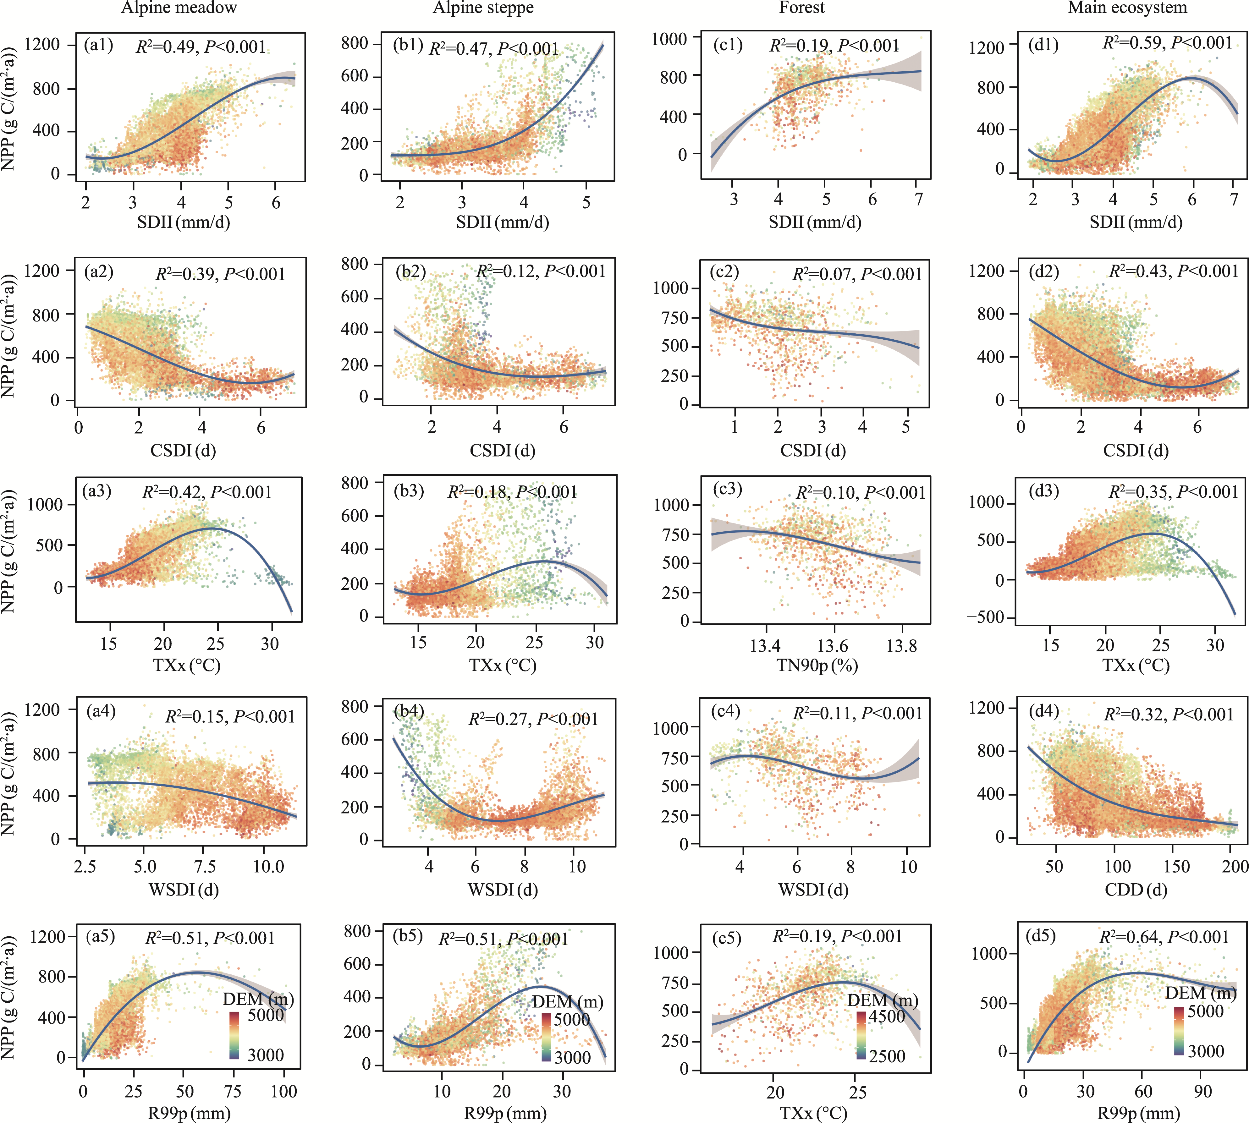
Abstract The net primary productivity (NPP) is an important indicator for assessing the carbon sequestration capacities of different ecosystems and plays a crucial role in the global biosphere carbon cycle. However, in the context of the increasing frequency, intensity, and duration of global extreme climate events, the impacts of extreme climate and vegetation phenology on NPP are still unclear, especially on the Qinghai-Xizang Plateau (QXP), China. In this study, we used a new data fusion method based on the MOD13A2 normalized difference vegetation index (NDVI) and the Global Inventory Modeling and Mapping Studies (GIMMS) NDVI3g datasets to obtain a NDVI dataset (1982-2020) on the QXP. Then, we developed a NPP dataset across the QXP using the Carnegie-Ames-Stanford Approach (CASA) model and validated its applicability based on gauged NPP data. Subsequently, we calculated 18 extreme climate indices based on the CN05.1 dataset, and extracted the length of vegetation growing season using the threshold method and double logistic model based on the annual NDVI time series. Finally, we explored the spatiotemporal patterns of NPP on the QXP and the impact mechanisms of extreme climate and the length of vegetation growing season on NPP. The results indicated that the estimated NPP exhibited good applicability. Specifically, the correlation coefficient, relative bias, mean error, and root mean square error between the estimated NPP and gauged NPP were 0.76, 0.17, 52.89 g C/(m2•a), and 217.52 g C/(m2•a), respectively. The NPP of alpine meadow, alpine steppe, forest, and main ecosystem on the QXP mainly exhibited an increasing trend during 1982-2020, with rates of 0.35, 0.38, 1.40, and 0.48 g C/(m2•a), respectively. Spatially, the NPP gradually decreased from southeast to northwest across the QXP. Extreme climate had greater impact on NPP than the length of vegetation growing season on the QXP. Specifically, the increase in extremely-wet-day precipitation (R99p), simple daily intensity index (SDII), and hottest day (TXx) increased the NPP in different ecosystems across the QXP, while the increases in the cold spell duration index (CSDI) and warm spell duration index (WSDI) decreased the NPP in these ecosystems. The results of this study provide a scientific basis for relevant departments to formulate future policies addressing the impact of extreme climate on vegetation in different ecosystems on the QXP.
|
|
Received: 15 July 2024
Published: 31 March 2025
|
|
Corresponding Authors:
*CHEN Yangbo (E-mail: eescyb@mail.sysu.edu.cn)
|
|
|
| [1] |
Allen C D, Breshears D D, McDowell N G. 2015. On underestimation of global vulnerability to tree mortality and forest die-off from hotter drought in the Anthropocene. Ecosphere, 6(8): 129, doi: 10.1890/ES15-00203.1.
|
|
|
| [2] |
Breiman L. 2001. Random forests. Machine Learning, 45: 5-32.
|
|
|
| [3] |
Chen B X, Zhang X Z, Tao J, et al. 2014. The impact of climate change and anthropogenic activities on alpine grassland over the Qinghai-Tibet Plateau. Agricultural and Forest Meteorology, 189-190: 11-18.
|
|
|
| [4] |
Chen T, Xu Z W, Tang G P, et al. 2021. Spatiotemporal monitoring of soil CO2 efflux in a subtropical forest during the dry season based on field observations and remote sensing imagery. Remote Sensing, 13(17): 3481, doi: 10.3390/rs13173481.
|
|
|
| [5] |
Chen X Q, An S, Inouye D W, et al. 2015. Temperature and snowfall trigger alpine vegetation green-up on the world's roof. Global Change Biology, 21(10): 3635-3646.
doi: 10.1111/gcb.12954
pmid: 25906987
|
|
|
| [6] |
Ciais P, Reichstein M, Viovy N, et al. 2005. Europe-wide reduction in primary productivity caused by the heat and drought in 2003. Nature, 437(7058): 529-533.
|
|
|
| [7] |
Clark D A, Brown S, Kicklighter D W, et al. 2001. Measuring net primary production in forests: Concepts and field methods. Ecological Applications, 11(2): 356-370.
|
|
|
| [8] |
Cui S, Jia Z Y, Guo L, et al. 2024. Impacts of extreme climate events at different altitudinal gradients on vegetation NPP in Songhua River Basin. Environmental Sciences, 45(1): 275-286. (in Chinese)
|
|
|
| [9] |
Cuo L, Zhang Y X, Xu R, et al. 2021. Decadal change and inter-annual variability of net primary productivity on the Tibetan Plateau. Climate Dynamics, 56(5-6): 1837-1857.
|
|
|
| [10] |
Dragoni D, Schmid H P, Wayson C A, et al. 2011. Evidence of increased net ecosystem productivity associated with a longer vegetated season in a deciduous forest in south-central Indiana, USA. Global Change Biology, 17(2): 886-897.
|
|
|
| [11] |
Frank D, Reichstein M, Bahn M, et al. 2015. Effects of climate extremes on the terrestrial carbon cycle: Concepts, processes and potential future impacts. Global Change Biology, 21(8): 2861-2880.
doi: 10.1111/gcb.12916
pmid: 25752680
|
|
|
| [12] |
Gang C C, Zhou W, Chen Y Z, et al. 2014. Quantitative assessment of the contributions of climate change and human activities on global grassland degradation. Environmental Earth Sciences, 72(11): 4273-4282.
|
|
|
| [13] |
Gao Q Z, Wan Y F, Li Y, et al. 2012. Effects of topography and human activity on the net primary productivity (NPP) of alpine grassland in northern Tibet from 1981 to 2004. International Journal of Remote Sensing, 34(6): 2057-2069.
|
|
|
| [14] |
Ge W Y, Deng L Q, Wang F, et al. 2021. Quantifying the contributions of human activities and climate change to vegetation net primary productivity dynamics in China from 2001 to 2016. Science of the Total Environment, 773: 145648, doi: 10.1016/j.scitotenv.2021.145648.
|
|
|
| [15] |
He Y L, Yan W B, Cai Y, et al. 2022. How does the net primary productivity respond to the extreme climate under elevation constraints in mountainous areas of Yunnan, China? Ecological Indicators, 138: 108817, doi: 10.1016/j.ecolind.2022.108817.
|
|
|
| [16] |
Hou G Y, Wu S X, Long W Y, et al. 2023. Quantitative analysis of the impact of climate change and oasification on changes in net primary productivity variation in mid-Tianshan Mountains from 2001 to 2020. Ecological Indicators, 154: 110820, doi: 10.1016/j.ecolind.2023.110820.
|
|
|
| [17] |
Ji Z M, Kang S C, Cong Z Y, et al. 2015. Simulation of carbonaceous aerosols over the Third Pole and adjacent regions: distribution, transportation, deposition, and climatic effects. Climate Dynamics, 45(9-10): 2831-2846.
|
|
|
| [18] |
Jönsson P, Eklundh L. 2002. Seasonality extraction by function fitting to time-series of satellite sensor data. IEEE Transactions on Geoscience and Remote Sensing, 40(8): 1824-1832.
|
|
|
| [19] |
Jönsson P, Eklundh L. 2004. TIMESAT—a program for analyzing time-series of satellite sensor data. Computers & Geosciences, 30(8): 833-845.
|
|
|
| [20] |
Li C H, Sun H, Liu L H, et al. 2022. The importance of permafrost in the steady and fast increase in net primary production of the grassland on the Qinghai-Tibet Plateau. CATENA, 211(1): 105964, doi: 10.1016/j.catena.2021.105964.
|
|
|
| [21] |
Li C H, Liu Y F, Zhu T B, et al. 2023. Considering time-lag effects can improve the accuracy of NPP simulation using a light use efficiency model. Journal of Geographical Sciences, 33(5): 961-979.
doi: 10.1007/s11442-023-2115-9
|
|
|
| [22] |
Li H Y, Vulova S, Rocha A D, et al. 2024. Spatio-temporal feature attribution of European summer wildfires with Explainable Artificial Intelligence (XAI). Science of the Total Environment, 916: 170330, doi: 10.1016/j.scitotenv.2024.170330.
|
|
|
| [23] |
Li P, Liu Z L, Zhou X L, et al. 2021a. Combined control of multiple extreme climate stressors on autumn vegetation phenology on the Tibetan Plateau under past and future climate change. Agricultural and Forest Meteorology, 308-309: 108571, doi: 10.1016/j.agrformet.2021.108571.
|
|
|
| [24] |
Li X, Wu C F, Meadows M E, et al. 2021b. Factors underlying spatiotemporal variations in atmospheric PM2.5 concentrations in Zhejiang Province, China. Remote Sensing, 13(15): 3011, doi: 10.3390/rs13153011.
|
|
|
| [25] |
Li X Y, Li Y, Chen A P, et al. 2019. The impact of the 2009/2010 drought on vegetation growth and terrestrial carbon balance in Southwest China. Agricultural and Forest Meteorology, 269-270: 239-248.
|
|
|
| [26] |
Liu B, Guo H X, Li J L, et al. 2024. Application and interpretability of ensemble learning for landslide susceptibility mapping along the Three Gorges Reservoir area, China. Natural Hazards, 120(5): 4601-4632.
|
|
|
| [27] |
Liu D, Wang T, Yang T, et al. 2019a. Deciphering impacts of climate extremes on Tibetan grasslands in the last fifteen years. Science Bulletin, 64(7): 446-454.
|
|
|
| [28] |
Liu Y Y, Yang Y, Wang Q, et al. 2019b. Evaluating the responses of net primary productivity and carbon use efficiency of global grassland to climate variability along an aridity gradient. Science of the Total Environment, 652: 671-682.
|
|
|
| [29] |
Lundberg S M, Lee S I. 2017. A unified approach to interpreting model predictions. In:Proceedings of the 31st International Conference on Neural Information Processing Systems (NIPS'17). Curran Associates Inc., Red Hook, NY, USA, 4768-4777.
|
|
|
| [30] |
Mäkiranta P, Laiho R, Mehtätalo L, et al. 2017. Responses of phenology and biomass production of boreal fens to climate warming under different water-table level regimes. Global Change Biology, 24(3): 944-956.
|
|
|
| [31] |
Melillo J M, Steudler P A, Aber J D, et al. 2002. Soil warming and carbon-cycle feedbacks to the climate system. Science, 298(5601): 2173-2176.
pmid: 12481133
|
|
|
| [32] |
Michaletz S T, Cheng D L, Kerkhoff A J, et al. 2014. Convergence of terrestrial plant production across global climate gradients. Nature, 512(7512): 39-43.
|
|
|
| [33] |
Niu S L, Wu M Y, Han Y, et al. 2008. Water-mediated responses of ecosystem carbon fluxes to climatic change in a temperate steppe. New Phytologist, 177(1): 209-219.
doi: 10.1111/j.1469-8137.2007.02237.x
pmid: 17944829
|
|
|
| [34] |
Piao S L, Friedlingstein P, Ciais P, et al. 2007. Growing season extension and its impact on terrestrial carbon cycle in the Northern Hemisphere over the past 2 decades. Global Biogeochemical Cycles, 21(3): GB3018, doi: 10.1029/2006GB002888.
|
|
|
| [35] |
Piao Z G, Li X Y, Xu H, et al. 2024. Threshold of climate extremes that impact vegetation productivity over the Tibetan Plateau. Science China Earth Sciences, 67: 1967-1977.
|
|
|
| [36] |
Prăvălie R, Niculiță M, Roșca B, et al. 2023. Machine learning-based prediction and assessment of recent dynamics of forest net primary productivity in Romania. Journal of Environmental Management, 334: 117513, doi: 10.1016/j.jenvman.2023.117513.
|
|
|
| [37] |
Sen P K. 1968. Estimates of the regression coefficient based on Kendall's Tau. Journal of the American Statistical Association, 63(324): 1379-1389.
|
|
|
| [38] |
Shen M G, Wang S P, Jiang N, et al. 2022a. Plant phenology changes and drivers on the Qinghai-Tibetan Plateau. Nature Reviews Earth & Environment, 3(10): 633-651.
|
|
|
| [39] |
Shen X J, Liu Y W, Zhang J Q, et al. 2022b. Asymmetric impacts of diurnal warming on vegetation carbon sequestration of marshes in the Qinghai Tibet Plateau. Global Biogeochemical Cycles, 36(7): e2022GB007396, doi: 10.1029/2022GB007396.
|
|
|
| [40] |
Sun J, Zhou T C, Liu M, et al. 2019. Water and heat availability are drivers of the aboveground plant carbon accumulation rate in alpine grasslands on the Tibetan Plateau. Global Ecology and Biogeography, 29(1): 50-64.
|
|
|
| [41] |
Sun J, Ye C C, Liu M, et al. 2022. Response of net reduction rate in vegetation carbon uptake to climate change across a unique gradient zone on the Tibetan Plateau. Environmental Research, 203: 111894, doi: 10.1016/j.envres.2021.111894.
|
|
|
| [42] |
Wan S Q, Hui D F, Wallace L, et al. 2005. Direct and indirect effects of experimental warming on ecosystem carbon processes in a tallgrass prairie. Global Biogeochemical Cycles, 19(2): GB2014, doi: 10.1029/2004GB002315.
|
|
|
| [43] |
Wang F E, Wang Y X, Zhang K, et al. 2021. Spatial heterogeneity modeling of water quality based on random forest regression and model interpretation. Environmental Research, 202: 111660, doi: 10.1016/j.envres.2021.111660.
|
|
|
| [44] |
Wang H, Yan S J, Ciais P, et al. 2022. Exploring complex water stress-gross primary production relationships: Impact of climatic drivers, main effects, and interactive effects. Global Change Biology, 28(13): 4110-4123.
|
|
|
| [45] |
Wang M M, Wang S Q, Wang J B, et al. 2018. Detection of positive gross primary production extremes in terrestrial ecosystems of China during 1982-2015 and analysis of climate contribution. Journal of Geophysical Research: Biogeosciences, 123(9): 2807-2823.
|
|
|
| [46] |
Wang Y E, Rao L Y. 2023. Impact of climatic factors and human activities on the net primary productivity of the vegetation in the Pisha sandstone area. Arid Zone Research, 40(12): 1982-1995. (in Chinese)
doi: 10.13866/j.azr.2023.12.11
|
|
|
| [47] |
Wei X D, Yang J, Luo P P, et al. 2022. Assessment of the variation and influencing factors of vegetation NPP and carbon sink capacity under different natural conditions. Ecological Indicators, 138: 108834, doi: 10.1016/j.ecolind.2022.108834.
|
|
|
| [48] |
Winkler D E, Chapin K J, Kueppers L M. 2016. Soil moisture mediates alpine life form and community productivity responses to warming. Ecology, 97(6): 1553-1563.
doi: 10.1890/15-1197.1
pmid: 27859221
|
|
|
| [49] |
Xia B, Ma P Y, Xu C, et al. 2023. Spatiotemporal variation of NPP and its response to extreme climate indices in Yellow River Basin in recent 20 years. Research of Soil and Water Conservation, 30(2): 256-266. (in Chinese)
|
|
|
| [50] |
Xu B N, Li J J, Pei X J, et al. 2023. Decoupling the response of vegetation dynamics to asymmetric warming over the Qinghai-Tibet plateau from 2001 to 2020. Journal of Environmental Management, 347: 119131, doi: 10.1016/j.jenvman.2023.119131.
|
|
|
| [51] |
Xu Y Q, Xiao F J, Yu L. 2020. Review of spatio-temporal distribution of net primary productity in forest ecosystem and its responses to climate change in China. Acta Ecologica Sinica, 40(14): 4710-4723. (in Chinese)
|
|
|
| [52] |
Xue Y Y, Bai X Y, Zhao C W, et al. 2023. Spring photosynthetic phenology of Chinese vegetation in response to climate change and its impact on net primary productivity. Agricultural and Forest Meteorology, 342: 109734, doi: 10.1016/j.agrformet.2023.109734.
|
|
|
| [53] |
Yan Y C, Liu X P, Ou J P, et al. 2018. Assimilating multi-source remotely sensed data into a light use efficiency model for net primary productivity estimation. International Journal of Applied Earth Observation and Geoinformation, 72: 11-25.
|
|
|
| [54] |
Yang H F, Zhong X N, Deng S Q, et al. 2021. Assessment of the impact of LUCC on NPP and its influencing factors in the Yangtze River basin, China. CATENA, 206: 105542, doi: 10.1016/j.catena.2021.105542.
|
|
|
| [55] |
Ye C C, Sun J, Liu M, et al. 2020. Concurrent and lagged effects of extreme drought induce net reduction in vegetation carbon uptake on Tibetan Plateau. Remote Sensing, 12(15): 2347, doi: 10.3390/rs12152347.
|
|
|
| [56] |
Yin H, Sun Y, Donat M G. 2019. Changes in temperature extremes on the Tibetan Plateau and their attribution. Environmental Research Letters, 14(12): 124015, doi: 10.1088/1748-9326/ab503c.
|
|
|
| [57] |
Yin S Y, Du H Q, Mao F J, et al. 2024. Spatiotemporal patterns of net primary productivity of subtropical forests in China and its response to drought. Science of the Total Environment, 913: 169439, doi: 10.1016/j.scitotenv.2023.169439.
|
|
|
| [58] |
Yong Z Y, Xiong J N, Wang Z G, et al. 2021. Relationship of extreme precipitation, surface air temperature, and dew point temperature across the Tibetan Plateau. Climatic Change, 165(1-2): 41, doi: 10.1007/s10584-021-03076-2.
|
|
|
| [59] |
Zhang G L, Xu X L, Zhou C P, et al. 2011a. Responses of grassland vegetation to climatic variations on different temporal scales in Hulun Buir Grassland in the past 30 years. Journal of Geographical Sciences, 21(4): 634-650.
|
|
|
| [60] |
Zhang X B, Alexander L, Hegerl C C, et al. 2011b. Indices for monitoring changes in extremes based on daily temperature and precipitation data. Wiley Interdisciplinary Reviews: Climate Change, 2(6): 851-870.
|
|
|
| [61] |
Zhang Y L, Qi W, Zhou C P, et al. 2014. Spatial and temporal variability in the net primary production of alpine grassland on the Tibetan Plateau since 1982. Journal of Geographical Sciences, 24(2): 269-287.
doi: 10.1007/s11442-014-1087-1
|
|
|
| [62] |
Zhou W, Wang T, Xiao J Y, et al. 2024. Grassland productivity increase was dominated by climate in Qinghai-Tibet Plateau from 1982 to 2020. Journal of Cleaner Production, 434(3): 140144, doi: 10.1016/j.jclepro.2023.140144.
|
|
|
| [63] |
Zhu Y H, Luo P P, Zhang S, et al. 2020. Spatiotemporal analysis of hydrological variations and their impacts on vegetation in semiarid areas from multiple satellite data. Remote Sensing, 12(24): 4177, doi: 10.3390/rs12244177.
|
|
|
|
Viewed |
|
|
|
Full text
|
|
|
|
|
Abstract
|
|
|
|
|
Cited |
|
|
|
|
| |
Shared |
|
|
|
|
| |
Discussed |
|
|
|
|