Spatial distribution of benthic macroinvertebrate community in a sediment-laden river: Influence of anthropogenic activities and land use changes
XU Dingxue1,2, LIU Zi1, ZOU Yangquan1, TIAN Yulu1,3,*()
1Xi'an Key Laboratory of Environmental Simulation and Ecological Health in the Yellow River Basin, College of Urban and Environmental Sciences, Northwest University, Xi'an 710127, China 2Faculty of Geographical Science, Beijing Normal University, Beijing 100875, China 3Shaanxi Provincial Key Laboratory of Earth Surface System and Environmental Carrying Capacity, College of Urban and Environmental Sciences, Northwest University, Xi'an 710127, China
River ecosystems experience biodiversity loss due to intensifying anthropogenic disturbance and land use change. Although macroinvertebrate community plays a critical role in sustaining biogeochemical cycling and river ecosystem stability, the extent to which anthropogenic activities and land use changes affect macroinvertebrate biodiversity and sediment ecological health remains insufficiently resolved. This study investigated the effects of anthropogenic activities and land use changes on macroinvertebrate community diversity in the Beiluo River Basin, China. An entropy-based framework was developed to evaluate sediment ecological health. A total of 31 phyla were identified, with Annelida (1.26%-71.95%) and Arthropoda (8.25%-24.17%) as the dominant groups. The entropy values indicated that macroinvertebrate community diversity across the 18 sampling sites was the highest in the middle reaches. Mineral extraction and excessive fertilizer application in the upper and middle reaches were notably associated with sediment degradation. The expansion of riparian cropland and industrial pollution reduced benthic macroinvertebrate abundance, whereas a higher proportion of riparian water bodies buffered pollutant inputs and provided habitat refuges, thereby supporting higher macroinvertebrate abundance. In addition, hydraulic engineering and wetland conservation measures increased the diversity of Mollusca and Rotifera, reflecting positive ecological responses to policy-driven restoration. Overall, the entropy-based sediment ecological quality index (SEQI) integrating sediment chemistry with deoxyribonucleic acid (DNA) metabarcoding diversity indicated that the sediment eco-quality in the Beiluo River Basin was primarily constrained by riparian land use and catchment-scale anthropogenic pressure. Partial Least Squares-Path Modeling (PLS-PM) explained 69.30% of the variance in SEQI (goodness of fit (GOF)=0.519) and revealed that land use exerted a stronger effect on SEQI than socioeconomic factors. These findings highlight the need to curb the expansion of riparian cropland and built-up land, reduce pollutant discharges, sustain the protection of water bodies and wetlands including continued water, conservation investment, and improve wastewater treatment to protect sediment quality and benthic biodiversity. Collectively, these results provide an important basis for assessing river ecological health and informing sustainable regional socioeconomic development.
XU Dingxue, LIU Zi, ZOU Yangquan, TIAN Yulu. Spatial distribution of benthic macroinvertebrate community in a sediment-laden river: Influence of anthropogenic activities and land use changes. Journal of Arid Land, 2026, 18(7): 1232-1257.
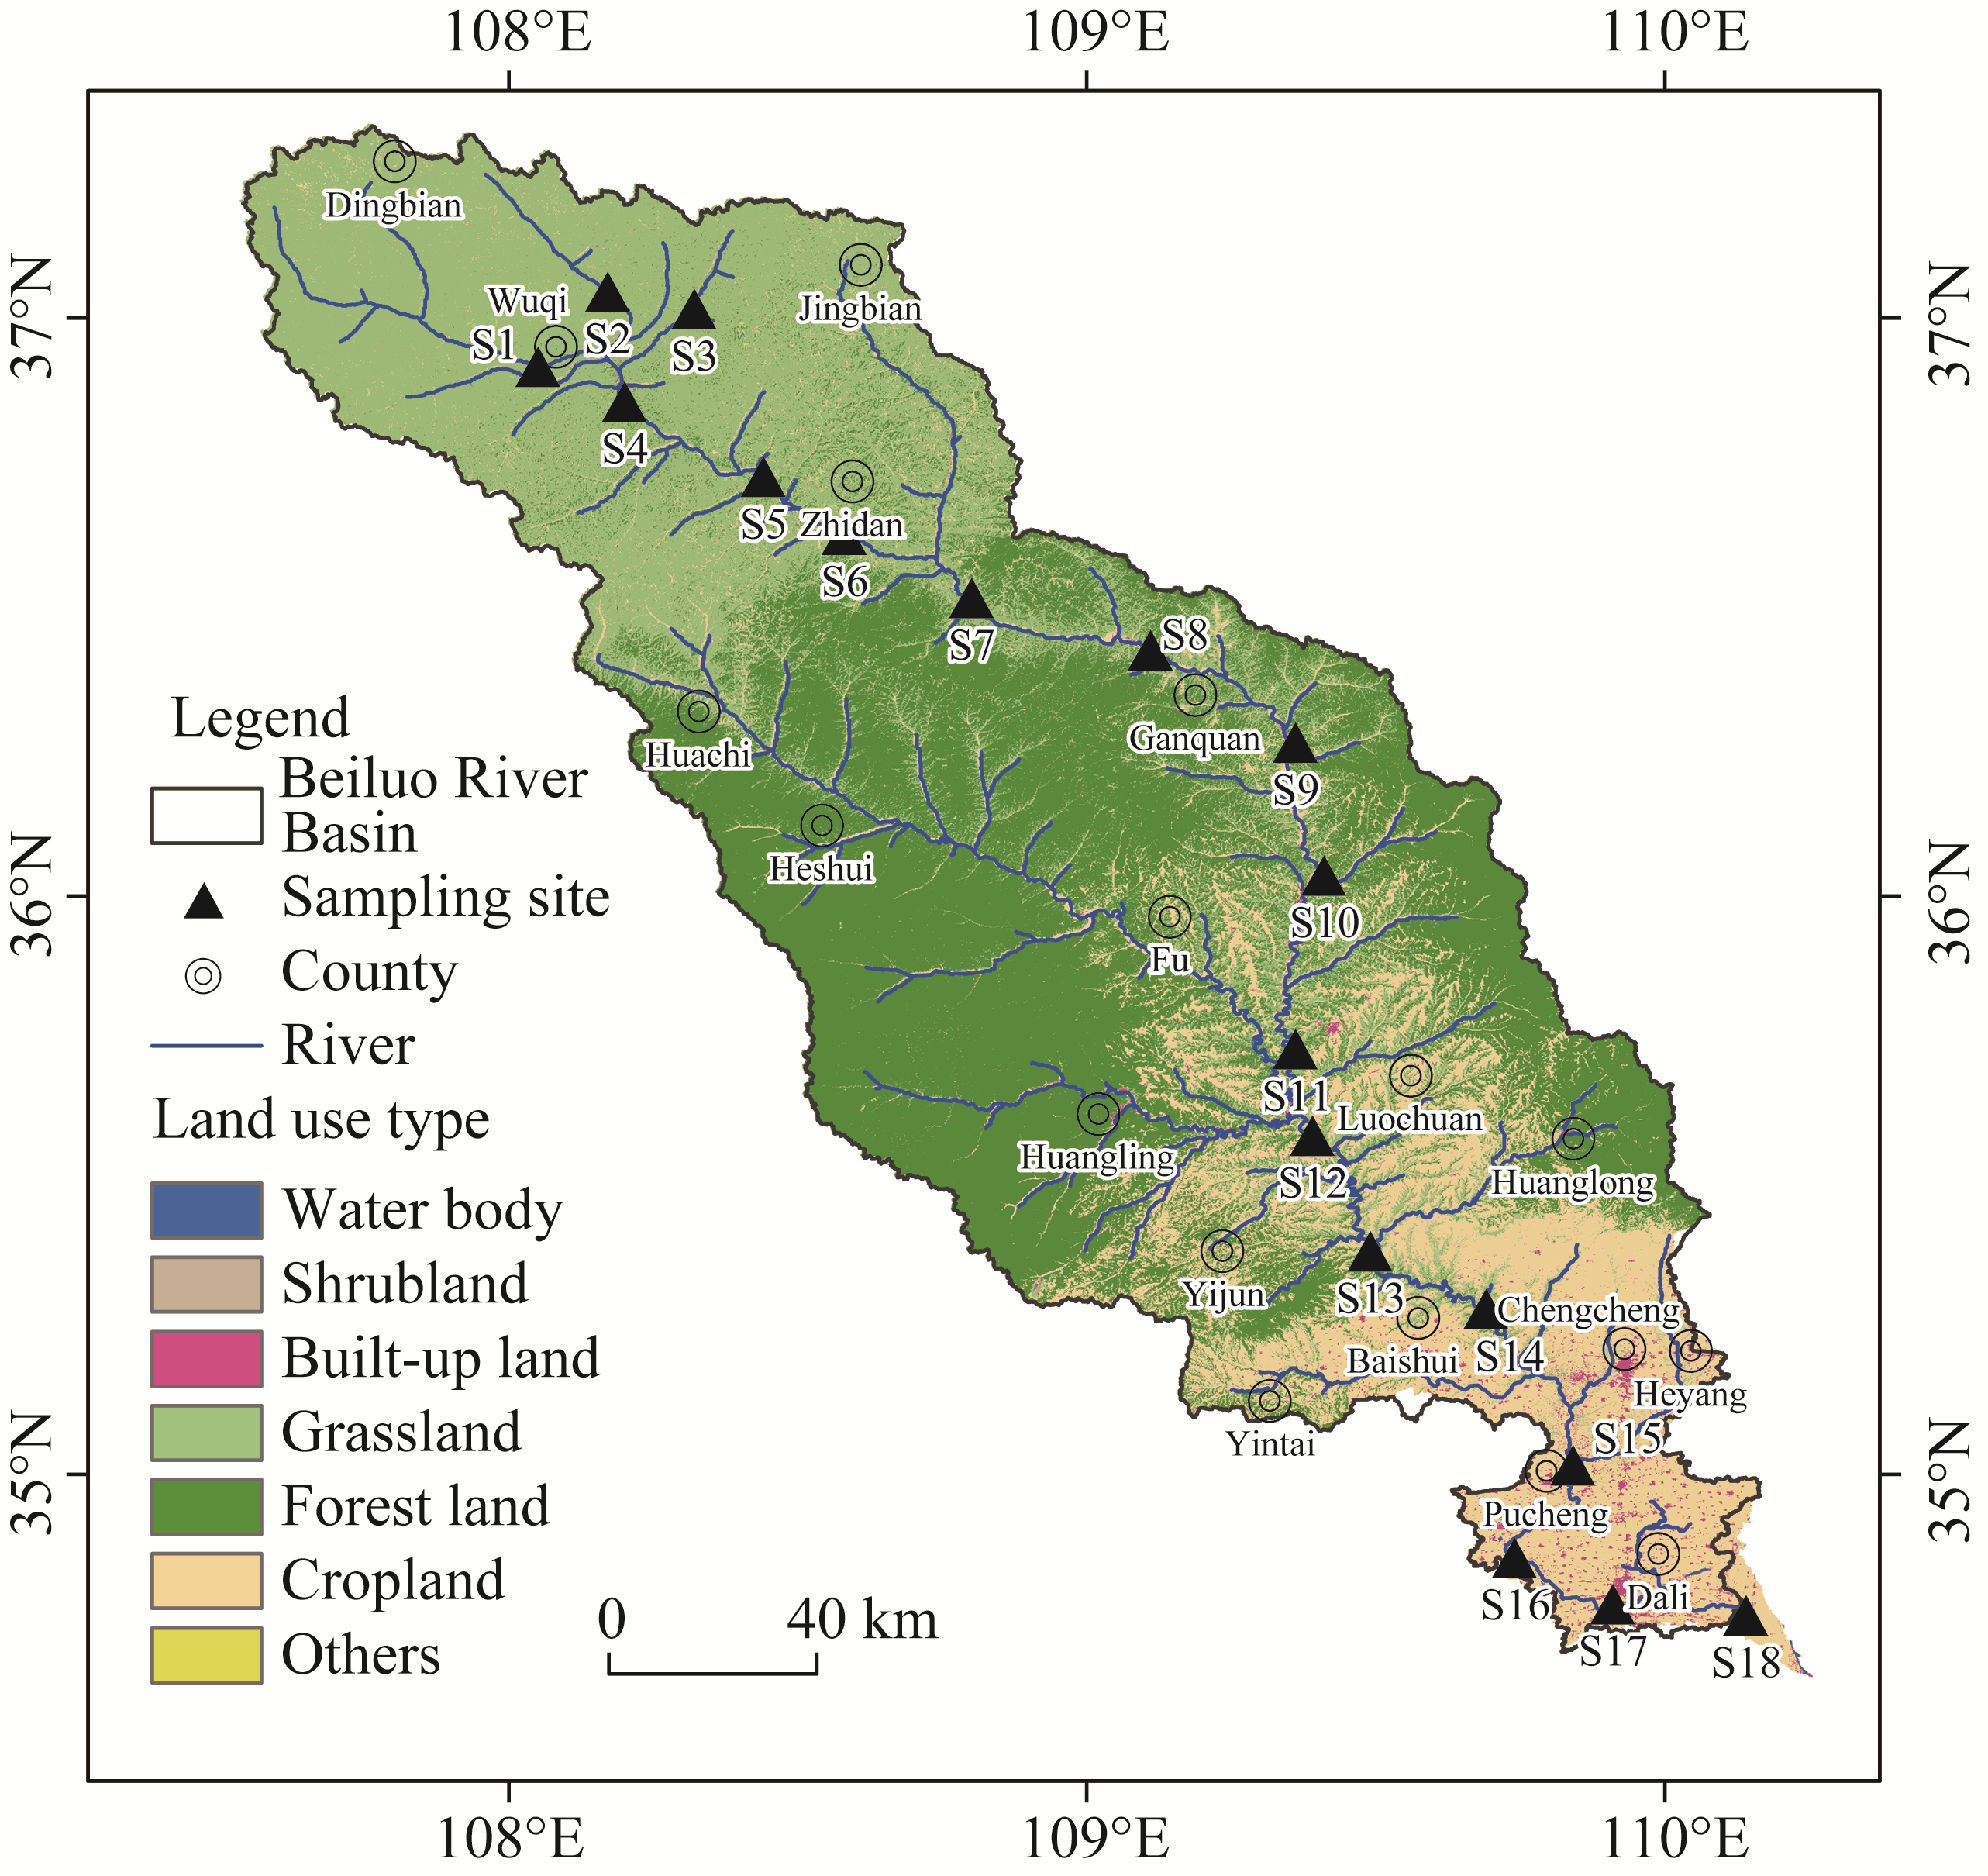
Fig. 1Land use types and sampling sites in the Beiluo River Basin
Sampling site
PCGDP (CNY)
PD (people/km2)
UR (%)
NOR
POF (t/km2)
TFU (t/km2)
TPU (t/km2)
WCI (CNY)
WTR (%)
DWCPC (L)
RSAPC (m2)
DGTR
S1
126,212
47.718
54.45
7
6.355
89.042
0.0643
202,829
93.91
102.038
1.266
0.999
S2
126,212
47.718
54.45
7
12.326
172.71
0.1248
202,829
93.91
102.038
1.265
0.999
S3
165,528
38.243
64.50
5
5.133
23.766
0.0699
103,522
97.50
74.470
1.270
0.997
S4
138,229
44.348
36.73
24
5.793
70.374
0.0627
612,702
95.00
111.568
1.431
0.999
S5
137,916
44.117
38.14
51
5.960
72.283
0.0647
1,310,761
94.81
112.786
1.256
0.998
S6
137,272
44.268
37.44
97
5.936
73.088
0.0640
2,518,000
94.71
113.871
1.250
0.998
S7
137,092
44.953
38.58
203
5.858
72.585
0.0627
5,113,635
94.74
111.790
1.247
0.997
S8
136,867
44.559
38.11
399
5.949
73.428
0.0638
10,224,151
94.72
112.809
1.261
0.997
S9
136,843
44.574
38.02
795
5.924
73.141
0.0636
20,362,945
94.73
112.736
1.243
0.998
S10
136,701
44.559
38.04
1592
5.921
73.116
0.0636
40,771,214
94.72
112.753
1.266
0.997
S11
136,753
44.597
38.06
3186
5.916
73.054
0.0635
81,520,281
94.72
112.690
1.256
0.997
S12
136,723
44.586
38.08
6378
5.897
72.812
0.0633
163,178,904
94.72
112.644
1.272
0.997
S13
136,766
44.595
38.07
12,751
5.903
72.884
0.0634
326,240,935
94.72
112.661
1.270
0.997
S14
136,726
44.605
38.07
25,524
5.903
72.894
0.0634
652,487,436
94.72
112.649
1.259
0.997
S15
136,697
44.614
38.07
51,054
5.901
72.869
0.0634
1,305,002,377
94.72
112.644
1.240
0.997
S16
136,685
44.618
38.07
102,117
5.902
72.880
0.0634
2,610,026,297
94.72
112.652
1.240
0.997
S17
136,691
44.616
38.07
204,202
5.903
72.885
0.0634
5,219,974,589
94.72
112.652
1.232
0.997
S18
136,693
44.616
38.07
408,413
5.902
72.882
0.0634
10,439,928,866
94.72
112.652
1.243
0.997
Table 1 Main socioeconomic factors at sampling sites of the Beiluo River Basin
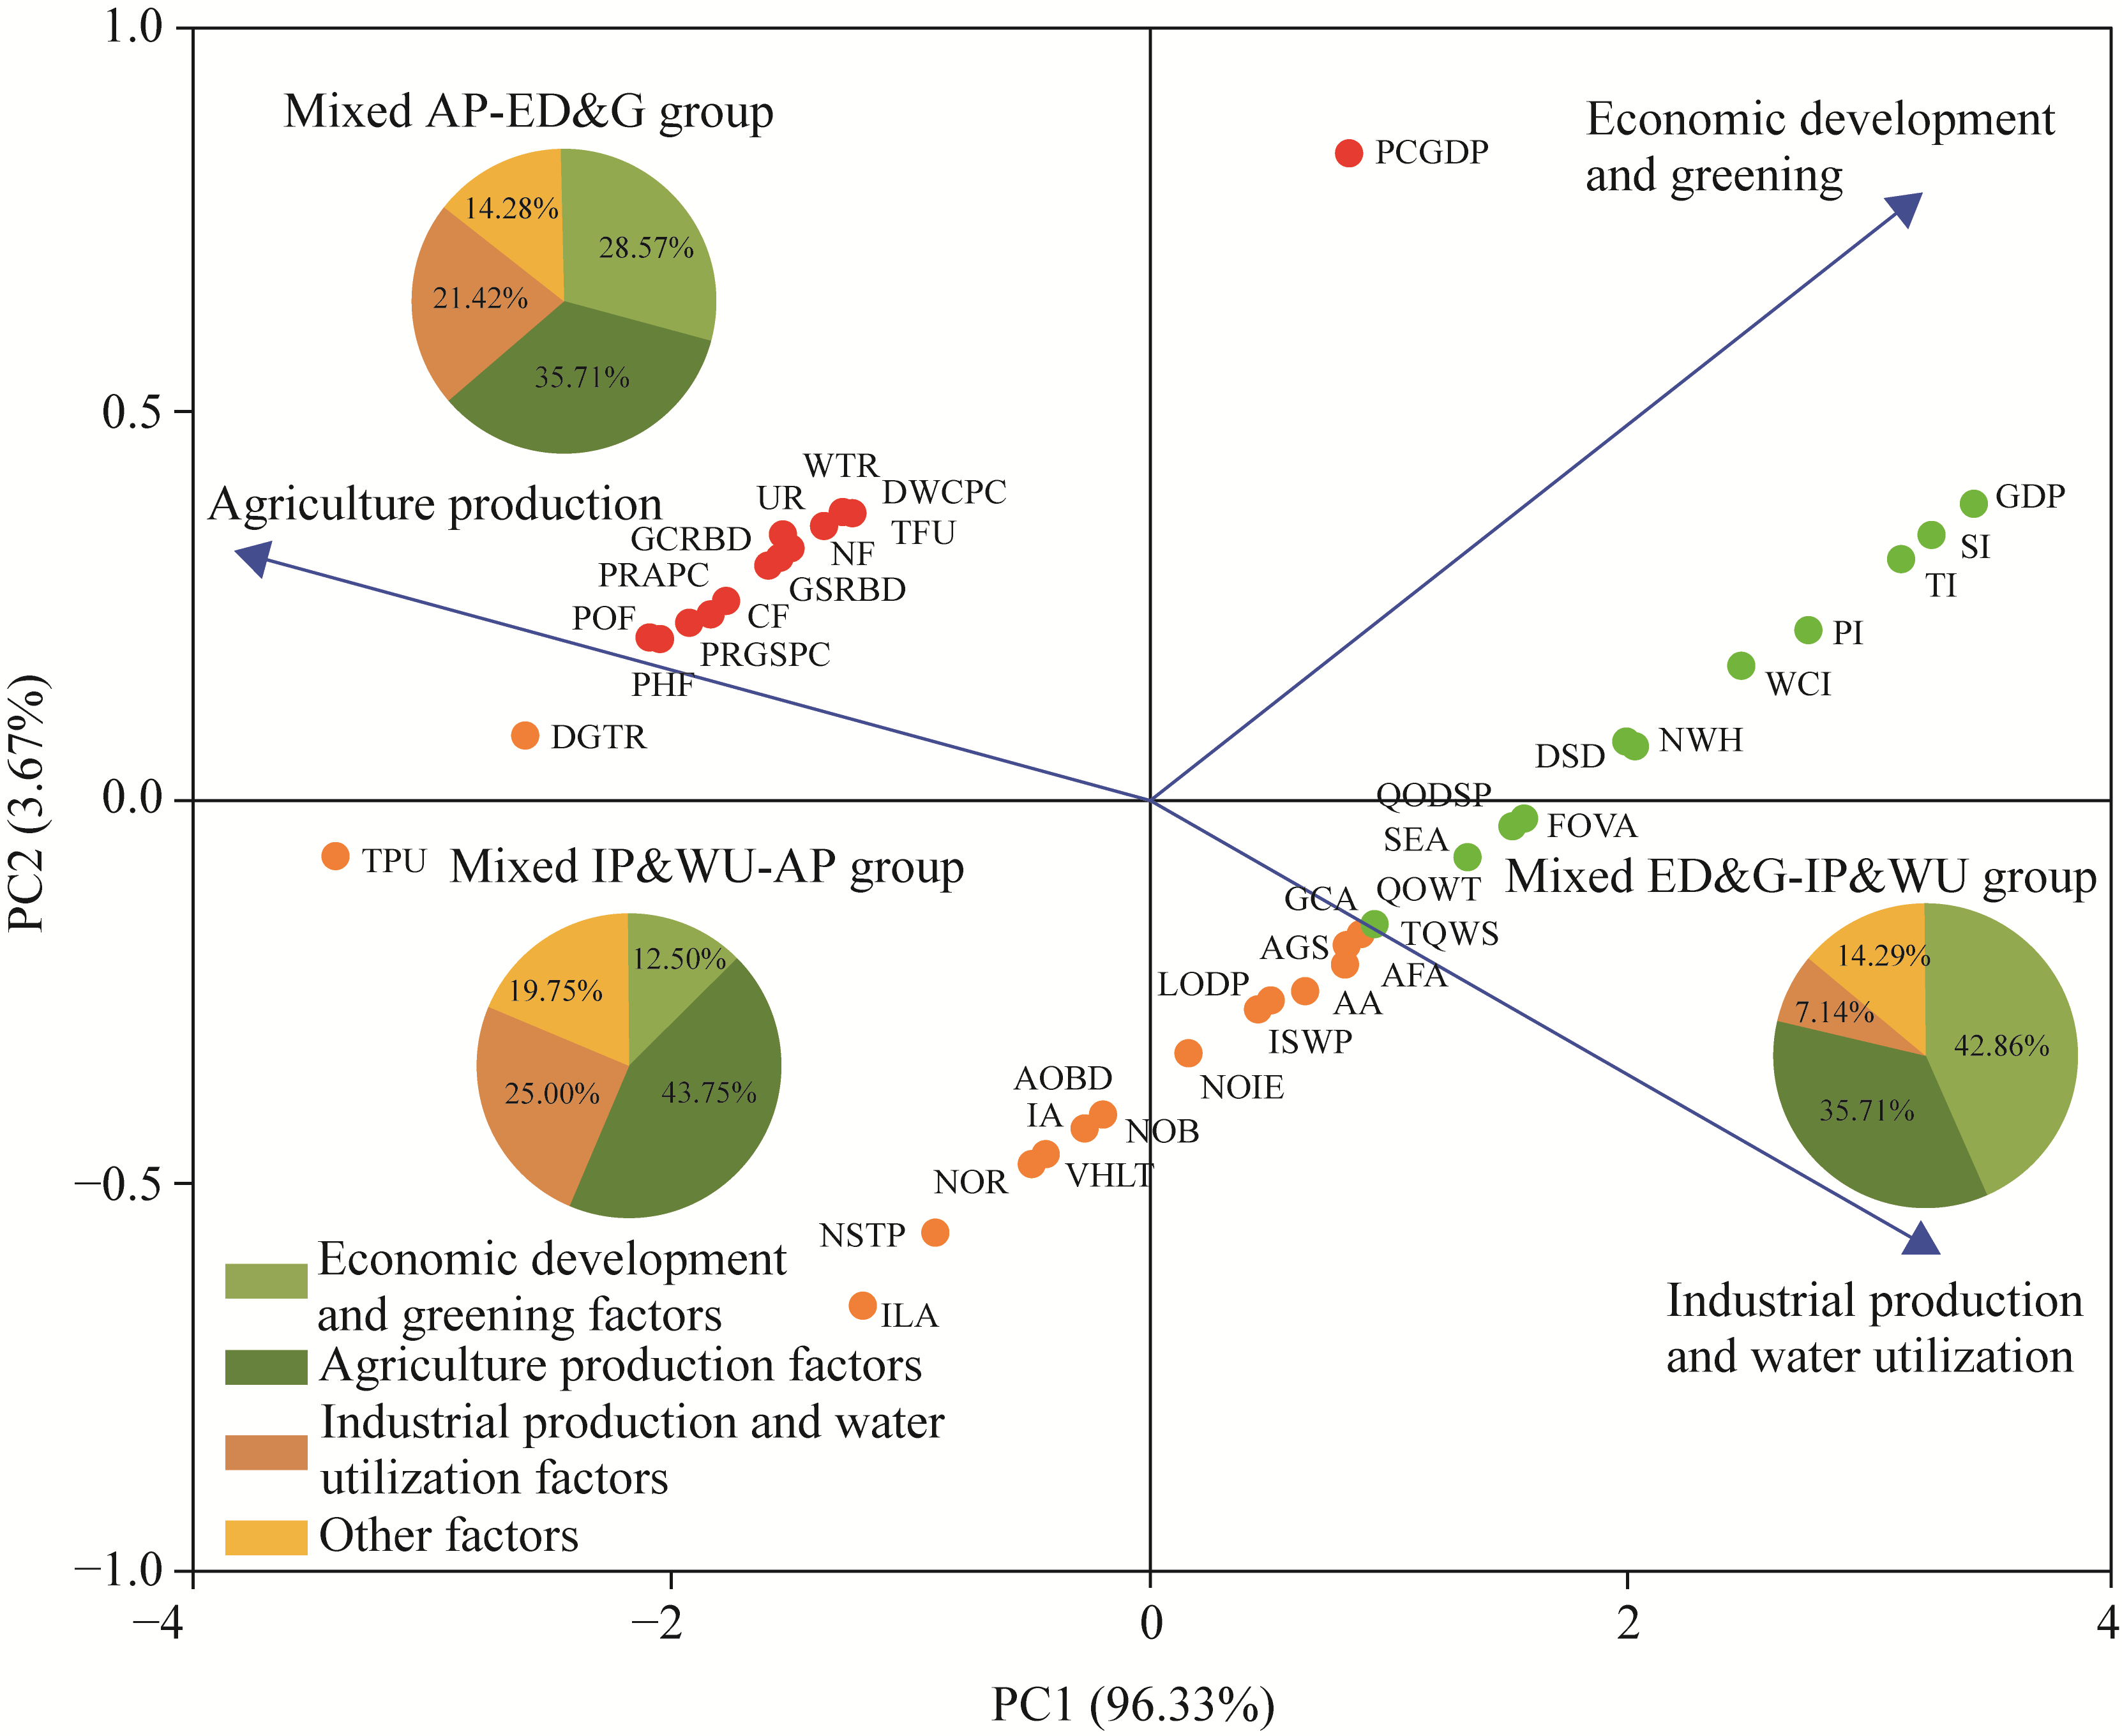
Fig. 2Principal component analysis (PCA) of group clustering for socioeconomic factors at each sampling site along the Beiluo River Basin. PC, principal component; Mixed AP-ED&G group, mixed agriculture production-economic development and greening group; Mixed IP&WU-AP group, mixed industrial production and water utilization-agriculture production group; Mixed ED&G-IP&WU group, mixed economic development and greening-industrial production and water utilization group; NF, nitrogen fertilizers; GSRBD, green space rate of built district; GCRBD, green coverage rate of built district; CF, compound fertilizers; PRGSPC, public recreational green space per capita; PHF, phosphate fertilizer; GCA, green coverage area; AFA, area of facility agriculture; AA, aquaculture area; AGS, area of green space; LODP, length of drainage pipelines; ISWP, industrial solid waste production; NOIE, number of industrial enterprises; AOBD, area of built district; NOB, number of bridges; IA, irrigated area; VHLT, volume of harmless treated; NSTP, number of sewage treatment plant; ILA, industrial land area; TQWS, total quantity of water supply; QOWT, quantity of wastewater treated; SEA, soil erosion area; QODSP, quantity of dry sludge produced; FOVA, forestry output value added; DSD, domestic sewage discharge; NWH, number of water households; PI, primary industry; TI, tertiary industry; SI, secondary industry; GDP, gross domestic product. The abbreviations are the same in the following figures.
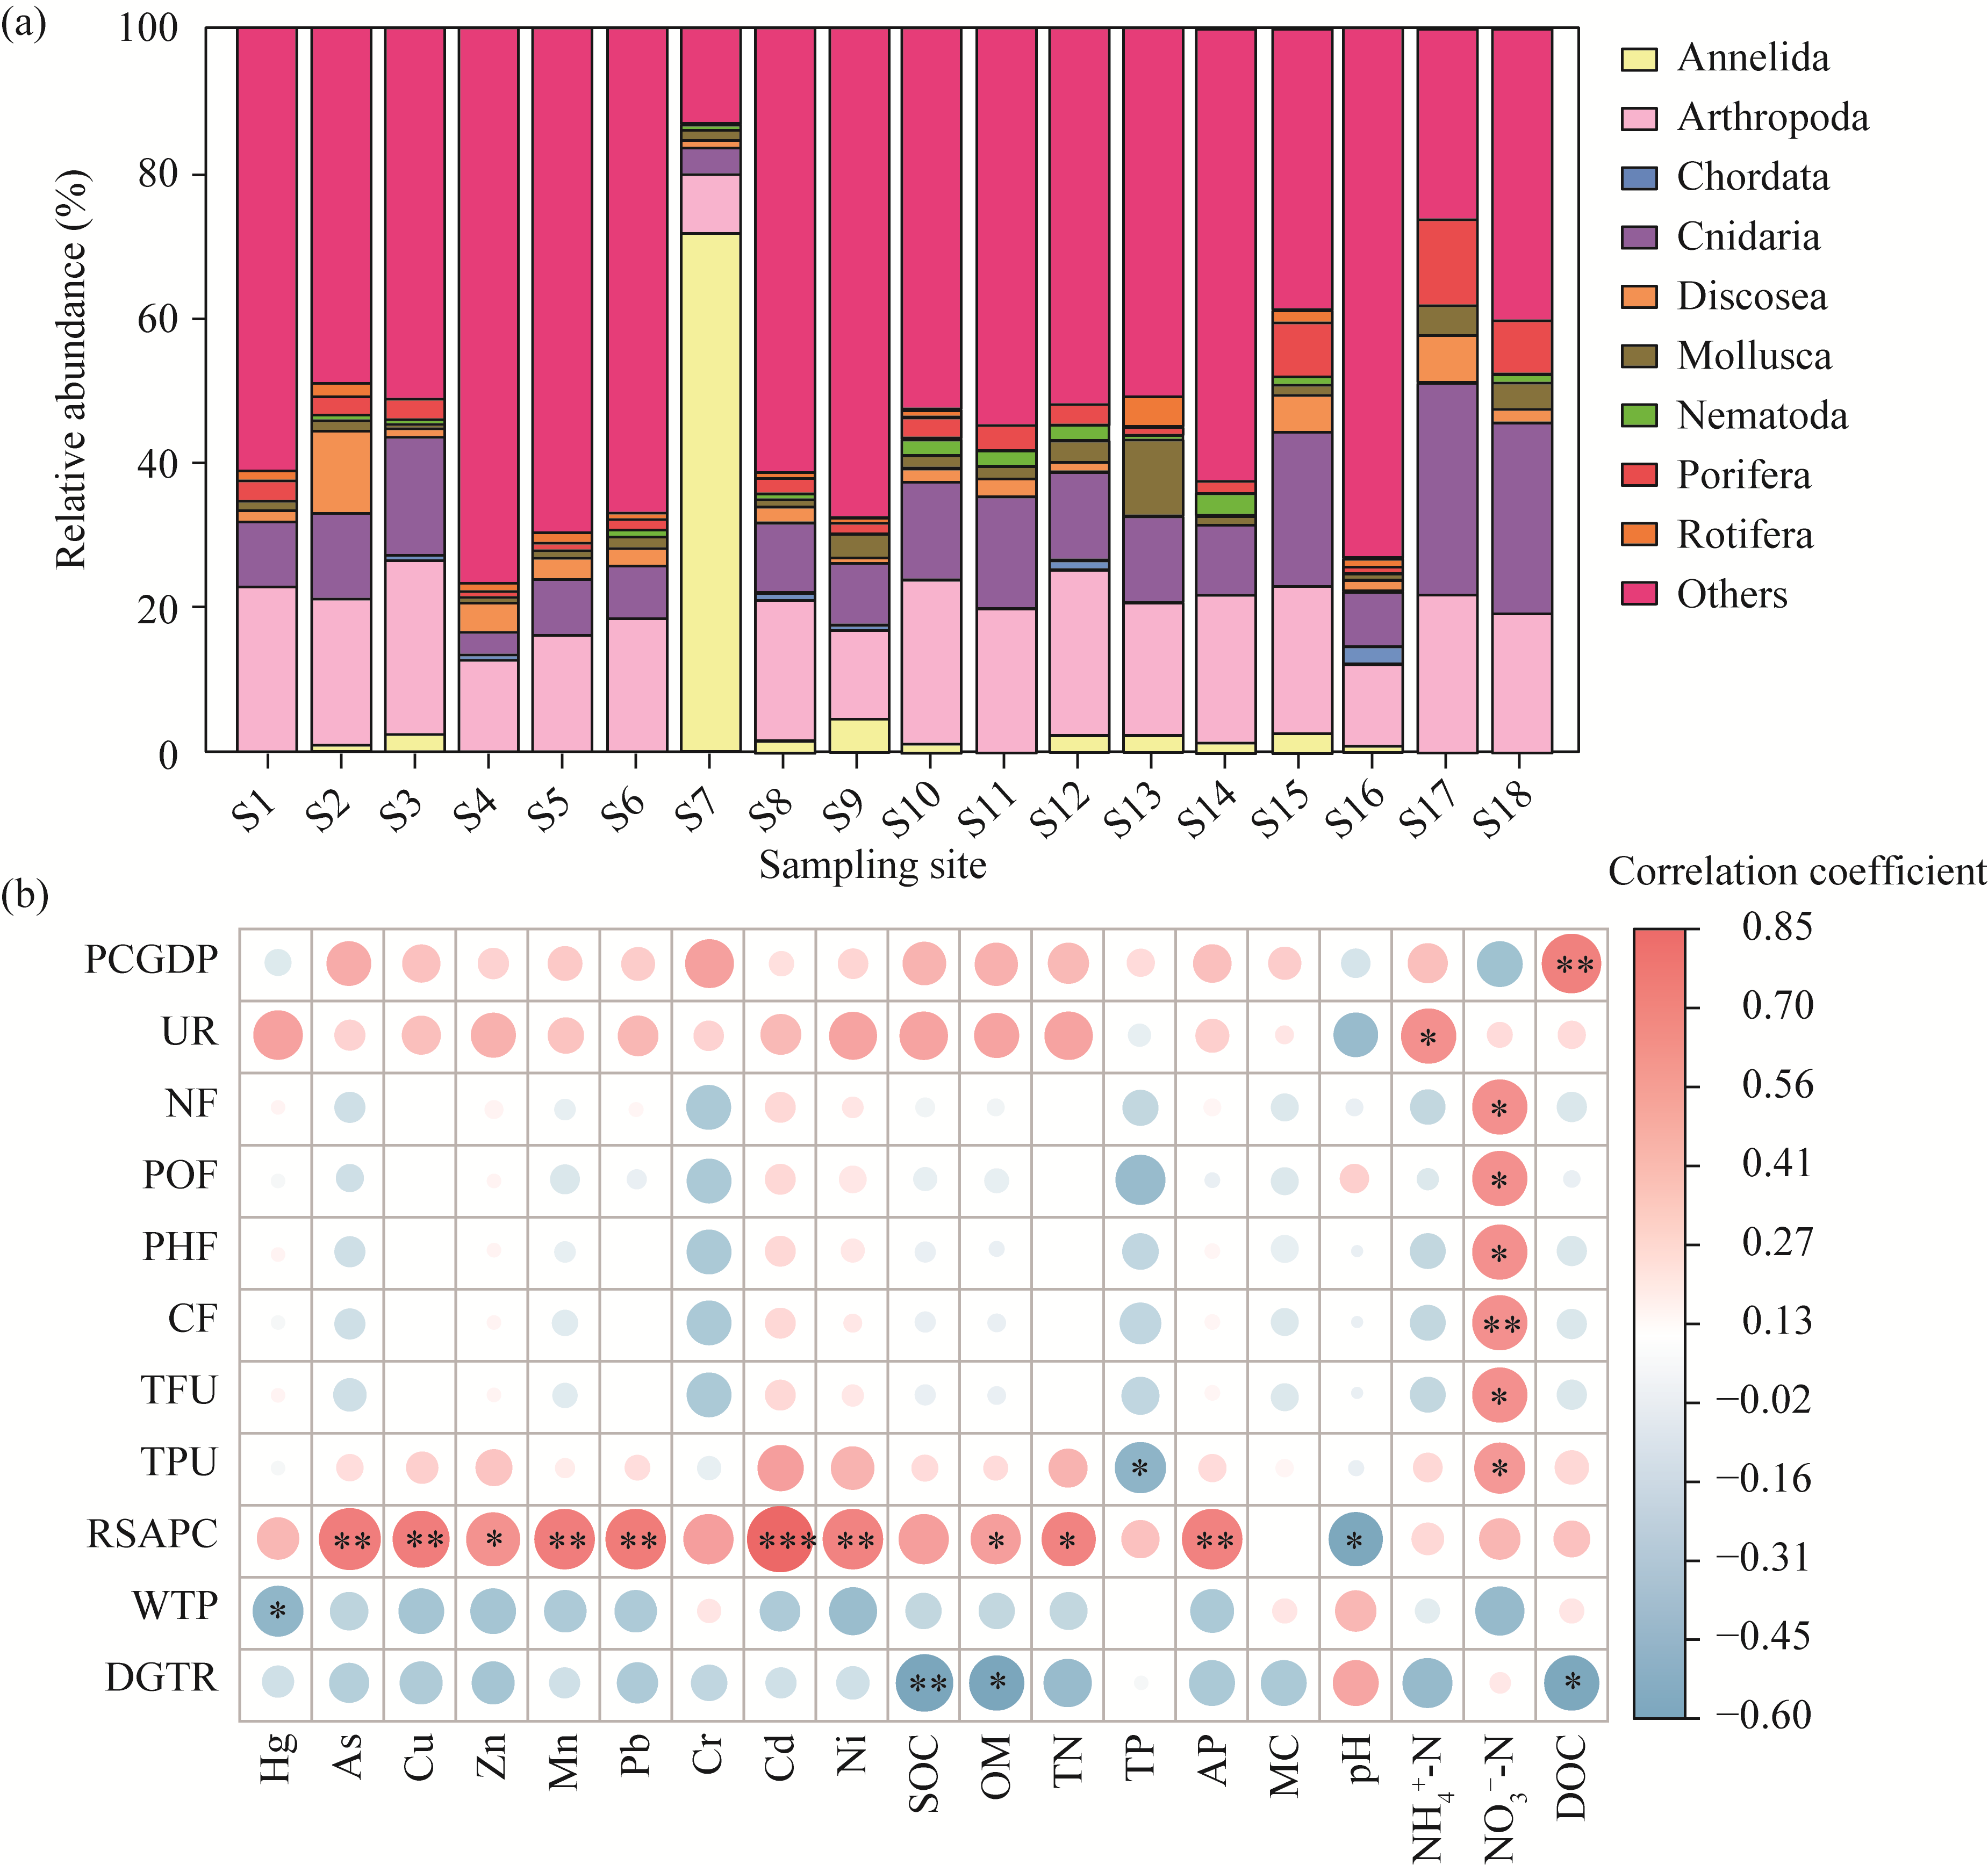
Fig. 3Relative abundance of macroinvertebrate community in the sediment of the Beiluo River Basin (a) and correlation of socioeconomic variables with sediment quality and heavy metals (b). Hg, mercury; As, arsenic; Cu, copper; Zn, zinc; Mn, manganese; Pb, lead; Cr, chromium; Cd, cadmium; Ni, nickel; SOC, sediment organic carbon; OM, organic matter; TN, total nitrogen; TP, total phosphorus; AP, available phosphorus; MC, moisture content; NH4+-N, ammonia nitrogen; NO3−-N, nitrate nitrogen, DOC, dissolved organic carbon. *, P<0.050 level; **, P<0.010 level; ***, P<0.001 level.
Sampling site
Cropland (%)
Forest land (%)
Grassland (%)
Shrubland (%)
Water body (%)
Bulit-up land (%)
Other lands (%)
S1
43.34
0.33
55.59
0.31
0.00
0.40
0.05
S2
44.84
0.39
53.32
0.34
0.01
1.06
0.04
S3
47.13
0.94
50.23
0.32
0.01
1.33
0.04
S4
43.66
3.25
46.72
0.34
0.02
5.99
0.03
S5
47.38
3.99
42.48
0.32
0.67
5.14
0.02
S6
47.42
5.32
41.48
0.28
0.60
4.87
0.02
S7
45.89
5.36
41.84
0.24
0.63
6.02
0.01
S8
46.86
5.62
40.34
0.22
1.40
5.54
0.01
S9
45.17
6.26
40.32
0.21
1.96
6.08
0.01
S10
47.28
6.67
37.61
0.19
2.31
5.92
0.01
S11
48.06
8.05
34.33
0.16
2.78
6.60
0.01
S12
50.98
16.18
23.40
0.09
2.80
6.55
0.01
S13
50.12
16.17
24.57
0.08
2.94
6.12
0.00
S14
48.92
17.13
24.48
0.07
3.19
6.04
0.15
S15
50.01
16.70
23.90
0.07
3.27
5.73
0.32
S16
51.44
16.08
22.96
0.06
3.45
5.70
0.31
S17
52.03
15.84
22.61
0.06
3.54
5.62
0.31
S18
53.34
15.29
21.83
0.06
3.57
5.62
0.30
Table 2 Composition of various land uses on riparian zone of the Beiluo River Basin
Sampling site
SOC (g/kg)
OM (g/kg)
TN (g/kg)
TP (g/kg)
AP (mg/kg)
EC (μS/cm)
MC (%)
pH
NH4+-N (mg/kg)
NO3--N (mg/kg)
DOC (mg/kg)
S1
1.880
3.240
0.220
0.720
3.370
302.000
23.890
8.870
3.540
2.450
38.250
S2
1.880
3.240
0.190
0.520
4.770
215.000
26.690
8.860
1.220
2.830
26.160
S3
2.760
4.760
0.320
0.550
4.830
193.600
30.040
8.830
14.850
1.720
55.720
S4
1.280
2.210
0.130
0.760
2.630
215.000
23.800
8.960
0.760
1.140
36.060
S5
1.640
2.830
0.160
0.480
2.600
175.400
26.250
9.080
2.230
1.880
43.720
S6
1.930
3.320
0.220
0.680
3.900
156.000
27.150
8.940
2.230
1.440
41.930
S7
3.050
5.270
0.300
0.730
4.070
163.100
32.890
8.590
10.790
0.720
46.760
S8
2.080
3.590
0.210
0.550
3.630
156.200
23.760
8.900
4.950
1.780
52.100
S9
1.300
2.230
0.140
0.520
2.130
138.900
24.550
9.000
0.350
1.520
38.780
S10
1.440
2.470
0.150
0.530
2.930
150.300
25.350
9.030
0.810
3.130
33.680
S11
2.010
3.460
0.200
0.450
5.200
132.500
30.470
8.900
1.250
2.880
51.160
S12
2.690
4.640
0.280
0.570
6.270
162.500
24.190
8.700
2.100
1.890
37.700
S13
4.770
8.220
0.490
0.870
14.870
229.000
43.270
8.530
35.060
1.990
78.230
S14
2.050
3.530
0.190
0.620
5.470
125.400
32.630
8.940
1.310
2.190
39.700
S15
1.260
2.170
0.100
0.560
1.470
159.900
16.210
9.190
1.580
1.260
34.760
S16
1.770
3.050
0.150
0.670
3.270
150.500
26.770
9.000
1.500
1.320
35.680
S17
1.150
1.990
0.110
0.540
2.070
109.600
24.220
9.050
1.570
1.980
37.690
S18
1.890
1.260
0.140
0.620
3.200
103.900
27.140
8.990
1.000
2.520
41.580
Sampling site
Hg (mg/kg)
As (mg/kg)
Cu (mg/kg)
Zn (mg/kg)
Mn (g/kg)
Pb (mg/kg)
Cr (mg/kg)
Cd (mg/kg)
Ni (mg/kg)
S1
0.037
10.113
12.370
43.807
0.4276
14.193
37.315
0.086
23.717
S2
0.013
11.124
12.527
46.102
0.4241
13.458
38.948
0.082
23.464
S3
0.013
12.788
14.191
48.569
0.4538
14.983
43.220
0.107
24.181
S4
0.010
10.962
10.674
37.806
0.4209
11.530
42.472
0.066
19.123
S5
0.010
10.857
11.223
41.237
0.3858
10.921
37.090
0.073
22.455
S6
0.014
10.890
12.637
47.143
0.4397
13.653
42.480
0.072
23.257
S7
0.016
9.940
12.346
45.480
0.4096
13.684
44.391
0.063
21.558
S8
0.011
10.723
11.265
41.273
0.3888
11.866
36.804
0.081
23.208
S9
0.010
8.792
10.146
38.526
0.3625
10.697
33.496
0.064
19.611
S10
0.009
8.560
10.406
39.136
0.3607
11.305
34.354
0.094
19.041
S11
0.010
12.275
13.523
46.023
0.3932
12.024
39.374
0.073
22.097
S12
0.019
14.586
16.158
53.767
0.5002
17.473
39.061
0.110
27.112
S13
0.038
13.954
15.784
53.215
0.4985
18.967
43.074
0.106
25.043
S14
0.021
12.463
14.397
51.651
0.4560
16.162
37.120
0.080
24.620
S15
0.010
8.979
8.025
31.331
0.3544
8.960
32.830
0.052
15.129
S16
0.014
8.326
10.487
39.258
0.3931
11.215
40.741
0.060
19.769
S17
0.007
8.700
8.916
35.107
0.3490
9.402
32.078
0.053
18.247
S18
0.011
9.788
9.888
38.598
0.3680
10.166
36.224
0.066
18.683
Table S1 Sediment quality indicators of each sampling site in the Beiluo River Basin
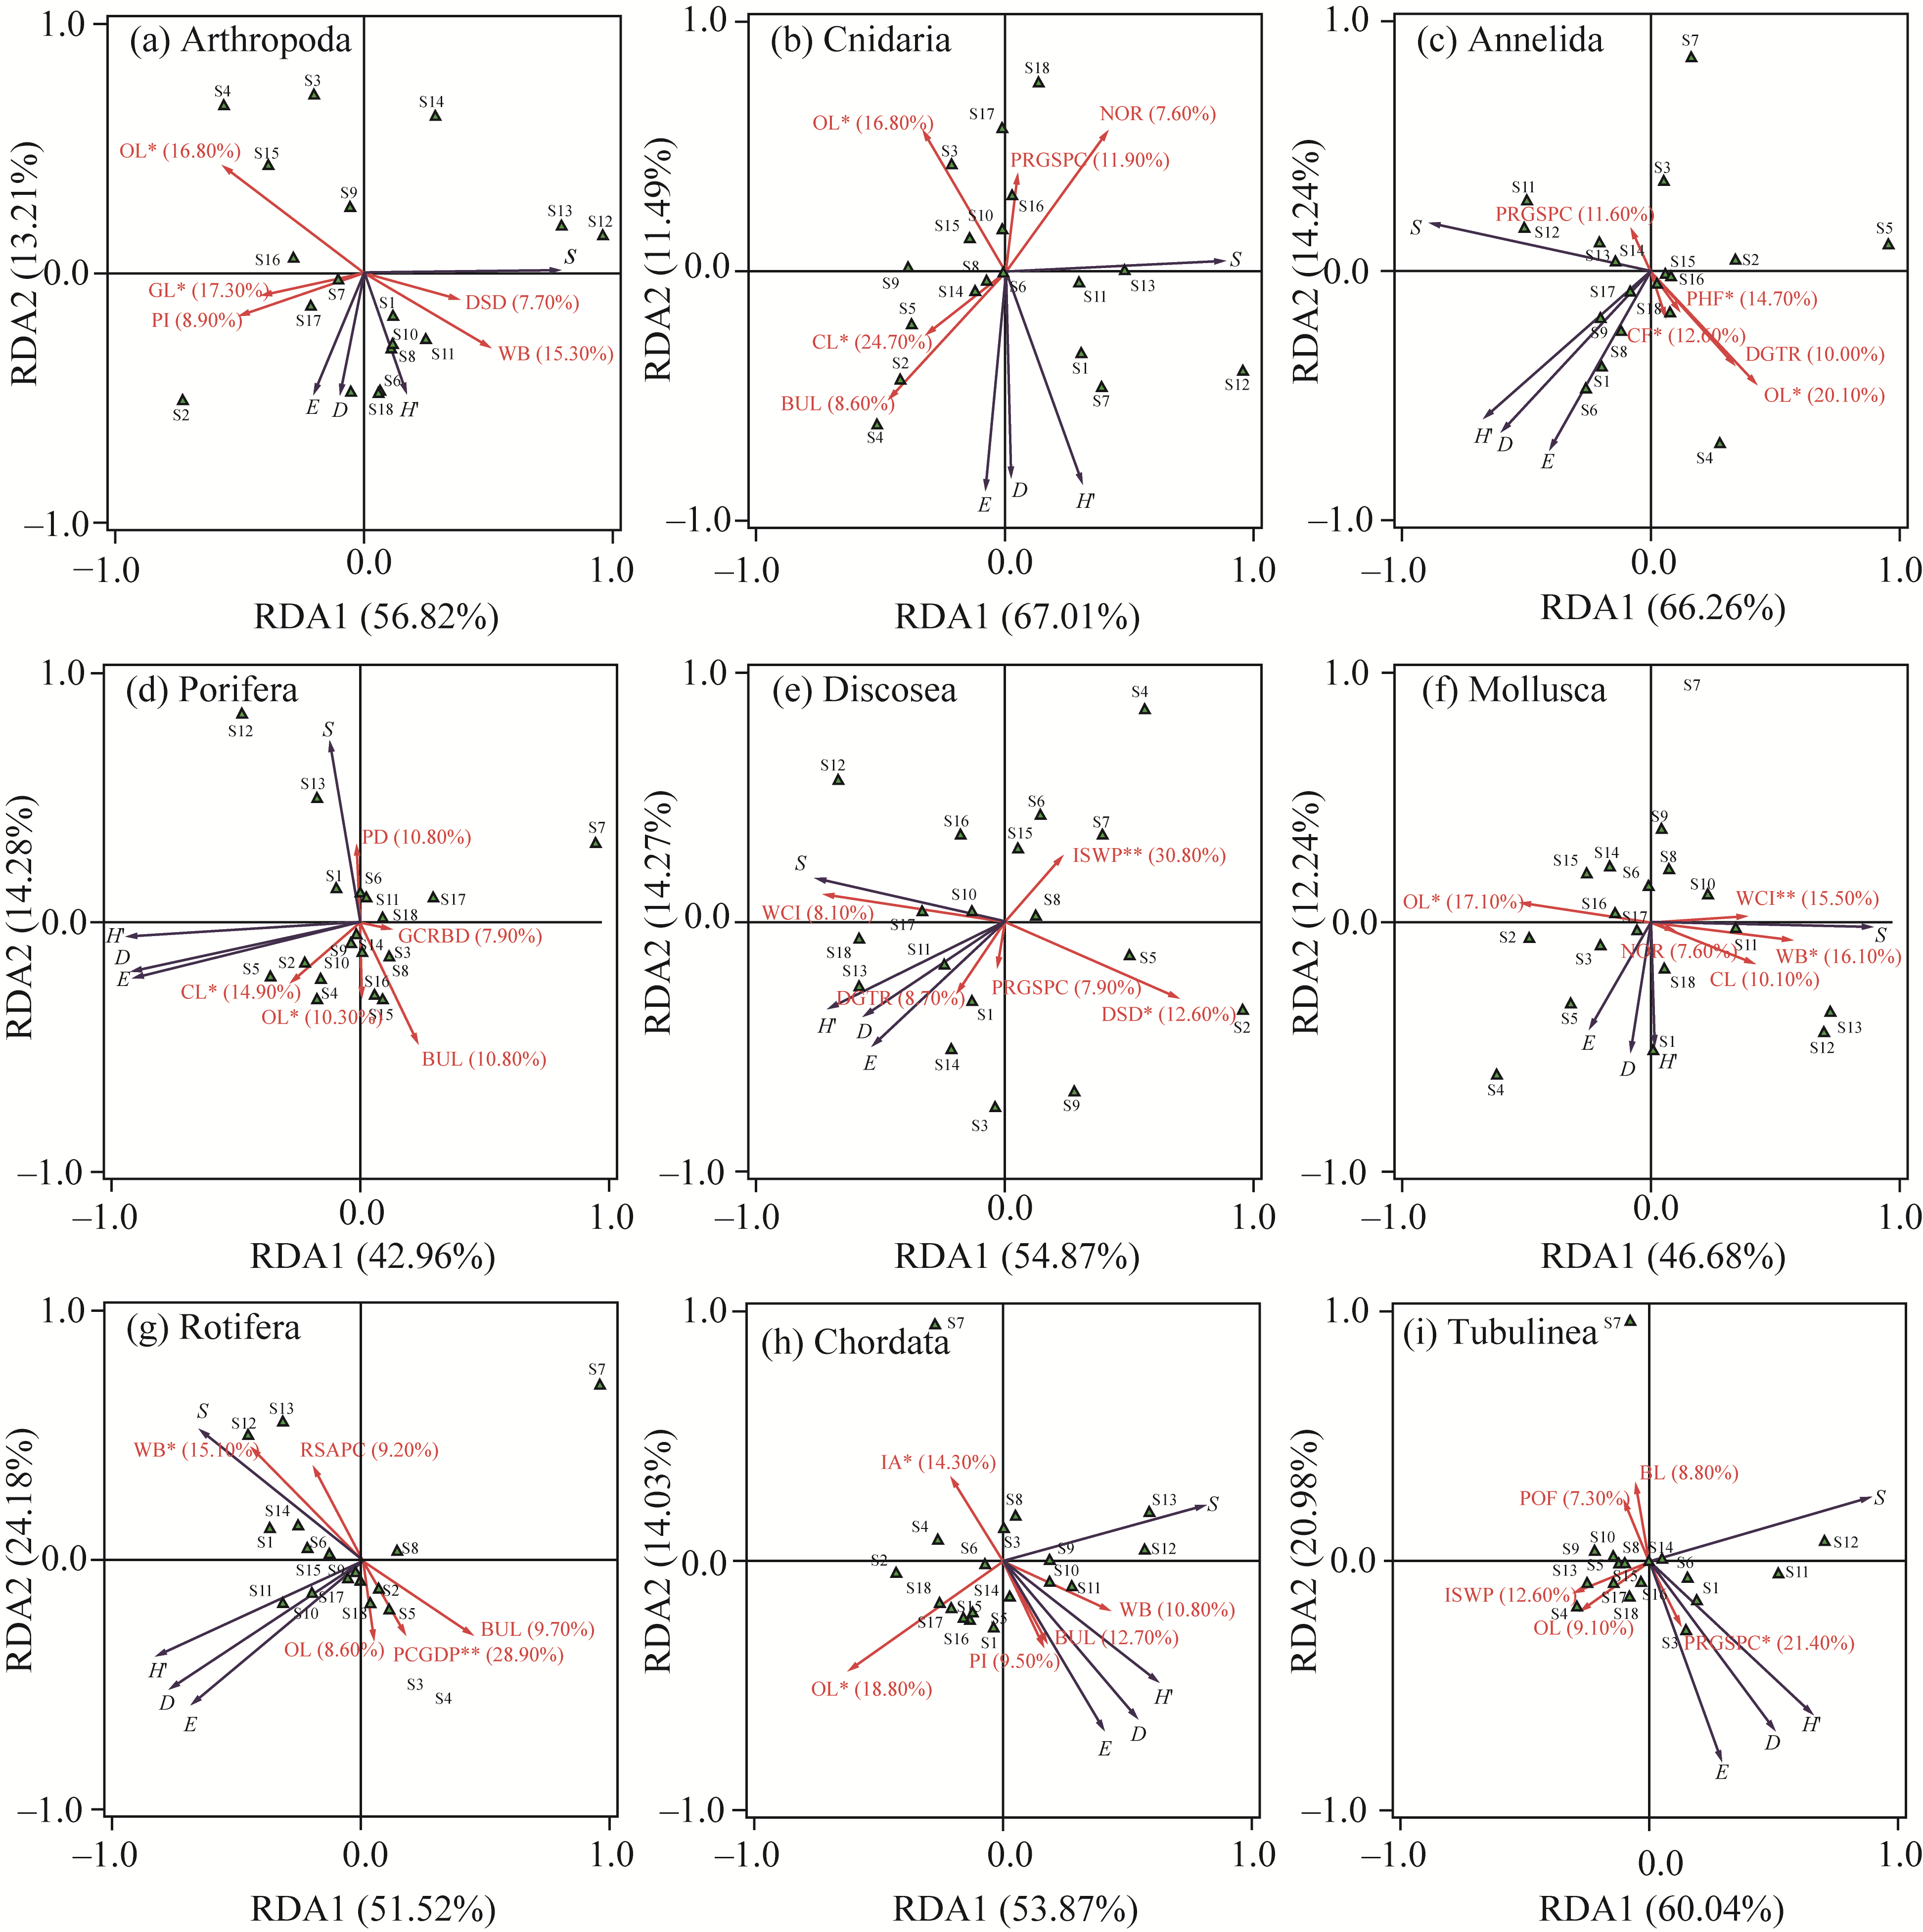
Fig. 4Redundancy analysis (RDA) of socioeconomic factors and land use rates with alpha diversity index of top 9 abundant macroinvertebrate phyla. (a), Arthropoda; (b), Cnidaria; (c), Annelida; (d), Porifera; (e), Discosea; (f), Mollusca; (g), Rotifera; (h), Chordata; (i), Tubulinea. S, richness; E, evenness; H', Shannon; D, Simpson; CL, cropland; WB, water body; FL, forest land; GL, grassland; SL, shrubland; BUL, built-up land; OL, other lands. *, P<0.050 level; **, P<0.010 level.
Sampling site
Arthropoda
Cnidaria
Annelida
Porifera
Discosea
S
E
H'
D
S
E
H'
D
S
E
H'
D
S
E
H'
D
S
E
H'
D
S1
334
0.728
4.230
0.962
173
0.711
3.662
0.927
19
0.767
2.259
0.861
36
0.627
2.248
0.803
33
0.701
2.450
0.870
S2
176
0.777
4.017
0.960
87
0.766
3.421
0.938
8
0.327
0.680
0.301
28
0.778
2.593
0.885
11
0.438
1.050
0.497
S3
266
0.624
3.486
0.906
109
0.515
2.415
0.760
16
0.253
0.701
0.268
28
0.576
1.92
0.765
28
0.821
2.735
0.905
S4
210
0.702
3.754
0.908
78
0.783
3.410
0.938
7
0.899
1.749
0.801
24
0.831
2.639
0.894
13
0.439
1.125
0.578
S5
208
0.790
4.219
0.973
89
0.705
3.167
0.917
2
0.081
0.056
0.020
23
0.855
2.682
0.915
15
0.621
1.682
0.773
S6
383
0.794
4.720
0.981
139
0.646
3.188
0.853
20
0.805
2.413
0.861
36
0.799
2.865
0.921
31
0.328
1.125
0.385
S7
371
0.595
3.519
0.843
174
0.745
3.844
0.956
19
0.014
0.042
0.011
37
0.014
0.049
0.011
41
0.030
0.110
0.029
S8
337
0.716
4.166
0.945
130
0.604
2.939
0.786
28
0.602
2.007
0.752
33
0.616
2.155
0.781
31
0.575
1.975
0.718
S9
190
0.842
4.417
0.982
70
0.659
2.800
0.866
18
0.400
1.156
0.580
19
0.703
2.070
0.827
16
0.755
2.094
0.825
S10
397
0.767
4.588
0.973
150
0.639
3.201
0.883
24
0.512
1.627
0.689
29
0.608
2.047
0.788
48
0.718
2.779
0.894
S11
449
0.781
4.767
0.983
200
0.596
3.156
0.859
26
0.700
2.280
0.825
43
0.576
2.166
0.790
58
0.694
2.818
0.882
S12
724
0.769
5.067
0.973
299
0.726
4.139
0.929
49
0.499
1.941
0.714
82
0.762
3.358
0.938
62
0.714
2.947
0.890
S13
484
0.615
3.804
0.917
201
0.589
3.125
0.873
38
0.285
1.035
0.332
43
0.653
2.455
0.833
42
0.790
2.953
0.920
S14
379
0.449
2.664
0.677
152
0.673
3.379
0.940
20
0.304
0.911
0.458
36
0.562
2.014
0.722
25
0.783
2.520
0.876
S15
341
0.774
4.516
0.977
148
0.526
2.631
0.772
16
0.586
1.626
0.745
38
0.603
2.194
0.828
54
0.586
2.337
0.802
S16
155
0.800
4.034
0.964
81
0.705
3.100
0.908
9
0.303
0.665
0.298
12
0.674
1.675
0.737
21
0.606
1.846
0.755
S17
231
0.734
3.995
0.953
121
0.423
2.029
0.598
7
0.789
1.534
0.749
25
0.403
1.297
0.555
45
0.622
2.368
0.841
S18
336
0.717
4.172
0.964
180
0.410
2.130
0.634
12
0.772
1.919
0.826
39
0.465
1.704
0.675
59
0.732
2.984
0.900
Sampling site
Mollusca
Nematoda
Rotifera
Chordata
Tubulinea
S
E
H'
D
S
E
H'
D
S
E
H'
D
S
E
H'
D
S
E
H'
D
S1
44
0.866
3.277
0.948
3
0.650
0.714
0.395
23
0.820
2.57
0.887
12
0.768
1.909
0.787
9
0.748
1.643
0.737
S2
23
0.832
2.609
0.907
13
0.782
2.005
0.819
14
0.674
1.778
0.737
8
0.56
1.164
0.491
5
0.562
0.705
0.438
S3
33
0.776
2.713
0.880
17
0.571
1.616
0.624
10
0.765
1.763
0.790
18
0.537
1.552
0.693
8
0.849
1.766
0.813
S4
23
0.66
2.068
0.788
12
0.818
2.031
0.830
9
0.717
1.575
0.750
11
0.434
1.04
0.489
4
0.688
0.954
0.515
S5
27
0.844
2.781
0.914
15
0.811
2.197
0.860
11
0.641
1.536
0.691
9
0.636
1.398
0.679
5
0.478
0.770
0.398
S6
50
0.796
3.116
0.918
30
0.858
2.917
0.920
20
0.730
2.186
0.839
19
0.826
2.433
0.886
8
0.599
1.245
0.654
S7
48
0.030
0.114
0.033
32
0.021
0.073
0.018
12
0.003
0.007
0.001
14
0.005
0.013
0.003
10
0.002
0.005
0.001
S8
51
0.826
3.249
0.944
14
0.633
1.671
0.680
16
0.710
1.968
0.812
34
0.849
2.993
0.931
12
0.742
1.844
0.798
S9
32
0.718
2.488
0.878
6
0.680
1.219
0.670
15
0.834
2.259
0.868
20
0.653
1.957
0.770
4
0.559
0.775
0.438
S10
56
0.770
3.101
0.9204
23
0.803
2.517
0.901
19
0.758
2.232
0.858
23
0.745
2.336
0.865
4
0.372
0.516
0.256
S11
77
0.801
3.479
0.935
36
0.865
3.099
0.936
19
0.820
2.416
0.889
26
0.76
2.476
0.855
15
0.613
1.659
0.643
S12
99
0.762
3.499
0.938
60
0.887
3.632
0.965
24
0.856
2.721
0.914
49
0.729
2.836
0.881
23
0.848
2.659
0.912
S13
91
0.399
1.802
0.705
30
0.682
2.320
0.815
34
0.444
1.566
0.680
39
0.85
3.112
0.934
5
0.621
0.999
0.509
S14
50
0.695
2.720
0.849
31
0.564
1.937
0.705
24
0.662
2.103
0.737
18
0.882
2.549
0.904
10
0.549
1.265
0.562
S15
38
0.809
2.942
0.922
15
0.574
1.553
0.619
26
0.894
2.913
0.933
18
0.889
2.571
0.910
6
0.534
0.956
0.463
S16
21
0.868
2.642
0.918
3
0.630
0.692
0.420
9
0.556
1.223
0.589
9
0.409
0.899
0.506
5
0.843
1.357
0.725
S17
39
0.449
1.644
0.574
9
0.854
1.876
0.825
12
0.729
1.812
0.797
5
0.713
1.147
0.586
5
0.738
1.188
0.634
S18
53
0.515
2.045
0.638
20
0.793
2.377
0.877
19
0.790
2.325
0.870
17
0.847
2.399
0.889
6
0.434
0.778
0.350
Table S2 Diversity indices for the top 10 species of the metazoan
Indicator
Entropy value
Indicator
Entropy value
ej
Pij
ωj (%)
ej
Pij
ωj (%)
SQF
SOC
0.974
0.026
2.91
IEF
SOC
0.974
0.026
2.42
OM
0.973
0.027
3.02
OM
0.973
0.027
2.52
TN
0.972
0.028
3.10
TN
0.972
0.028
2.59
TP
0.961
0.039
4.39
TP
0.961
0.039
3.66
AP
0.977
0.023
2.56
AP
0.977
0.023
2.14
EC
0.978
0.022
2.50
EC
0.968
0.032
2.98
MC
0.945
0.055
6.10
MC
0.971
0.029
2.65
pH
0.973
0.027
2.99
pH
0.941
0.059
5.50
NH4+-N
0.968
0.032
3.57
NH4+-N
0.978
0.022
2.09
NO3--N
0.971
0.029
3.18
NO3--N
0.945
0.055
5.09
DOC
0.941
0.059
6.59
DOC
0.973
0.027
2.49
Hg
0.958
0.042
4.70
Hg
0.958
0.042
3.92
As
0.949
0.051
5.66
As
0.949
0.051
4.72
Cu
0.940
0.060
6.68
Cu
0.940
0.060
5.57
Zn
0.927
0.073
8.10
Zn
0.927
0.073
6.75
Mn
0.940
0.060
6.65
Mn
0.940
0.060
5.55
Pb
0.956
0.044
4.92
Pb
0.956
0.044
4.10
Cr
0.922
0.078
8.66
Cr
0.922
0.078
7.23
Cd
0.934
0.066
7.38
Cd
0.934
0.066
6.15
Ni
0.943
0.057
6.35
Ni
0.943
0.057
5.30
DP
S
0.893
0.107
59.88
S
0.893
0.107
9.93
E
0.975
0.025
13.89
E
0.975
0.025
2.30
H'
0.974
0.026
14.73
H'
0.974
0.026
2.44
D
0.979
0.021
11.51
D
0.978
0.021
1.91
Table 3 Entropy value, information utility value, and weight of sediment quality factors (SQF), diversity parameters (DP), and integrated evaluation factors (IEF)
Sampling site
Normalized value
Sampling site
Normalized value
SQEI
DEI
SEQI
SQEI
DEI
SEQI
S1
0.484
0.542
0.494
S10
0.683
0.612
0.671
S2
0.535
0.353
0.505
S11
0.553
0.715
0.580
S3
0.388
0.419
0.393
S12
0.347
0.990
0.453
S4
0.640
0.282
0.581
S13
0.144
0.662
0.230
S5
0.642
0.338
0.592
S14
0.463
0.458
0.462
S6
0.521
0.515
0.520
S15
0.874
0.550
0.821
S7
0.564
0.221
0.507
S16
0.694
0.358
0.639
S8
0.622
0.577
0.614
S17
0.840
0.400
0.767
S9
0.779
0.406
0.717
S18
0.764
0.544
0.728
Table 4 Normalized numerical results of the weighting process of Entropy Weight Method (EWM) at each sampling site
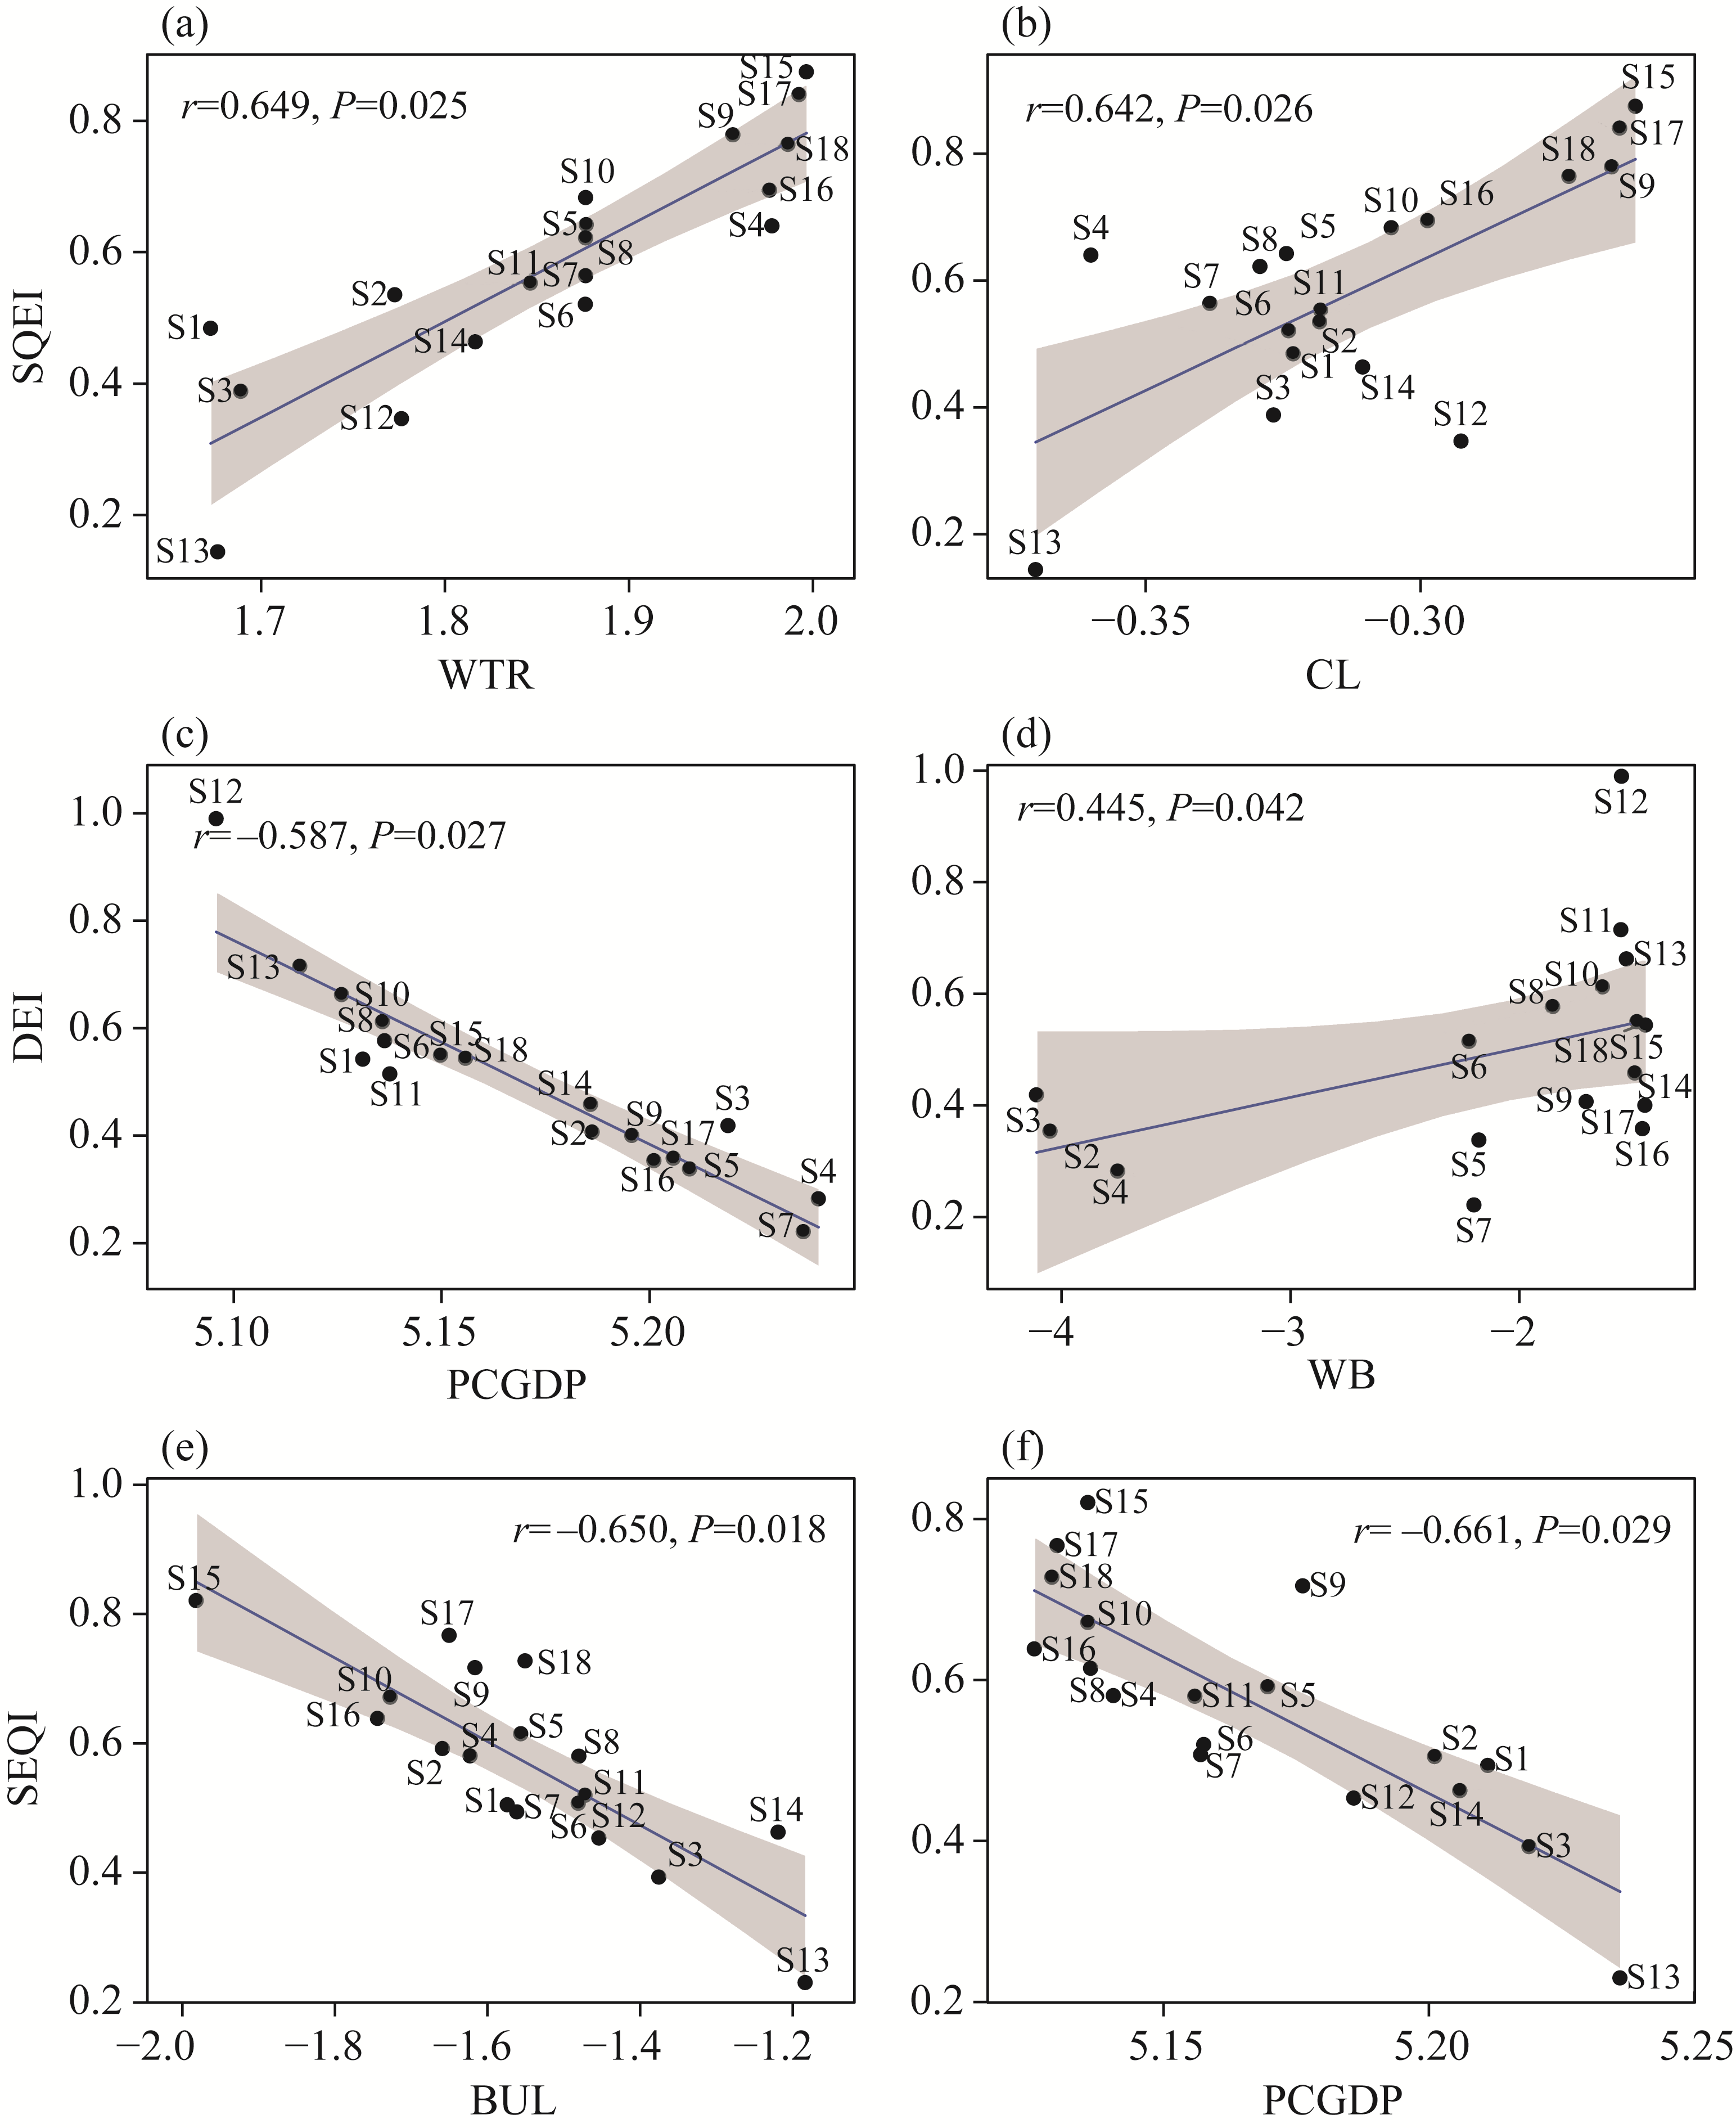
Fig. 5Linear fitting map of socioeconomic factors, land use change, sediment quality, biodiversity, and eco-quality. (a), relationship between SQEI and WTR; (b), relationship between SQEI and CL; (c), relationship between DEI and PCGDP; (d), relationship between DEI and WB; (e), relationship between SEQI and BUL; (f), relationship between SEQI and PCGDP. Data of WTR, CL, PCGDP, WB, and BUL have all undergone logarithmic transformation with base 10. The shaded area means the 95.00% confidence interval.
Fig. S1Relationship between diversity entropy index (DEI) and grassland (GL). Data of GL have undergone logarithmic transformation with base 10. The shaded area means the 95.00% confidence interval.
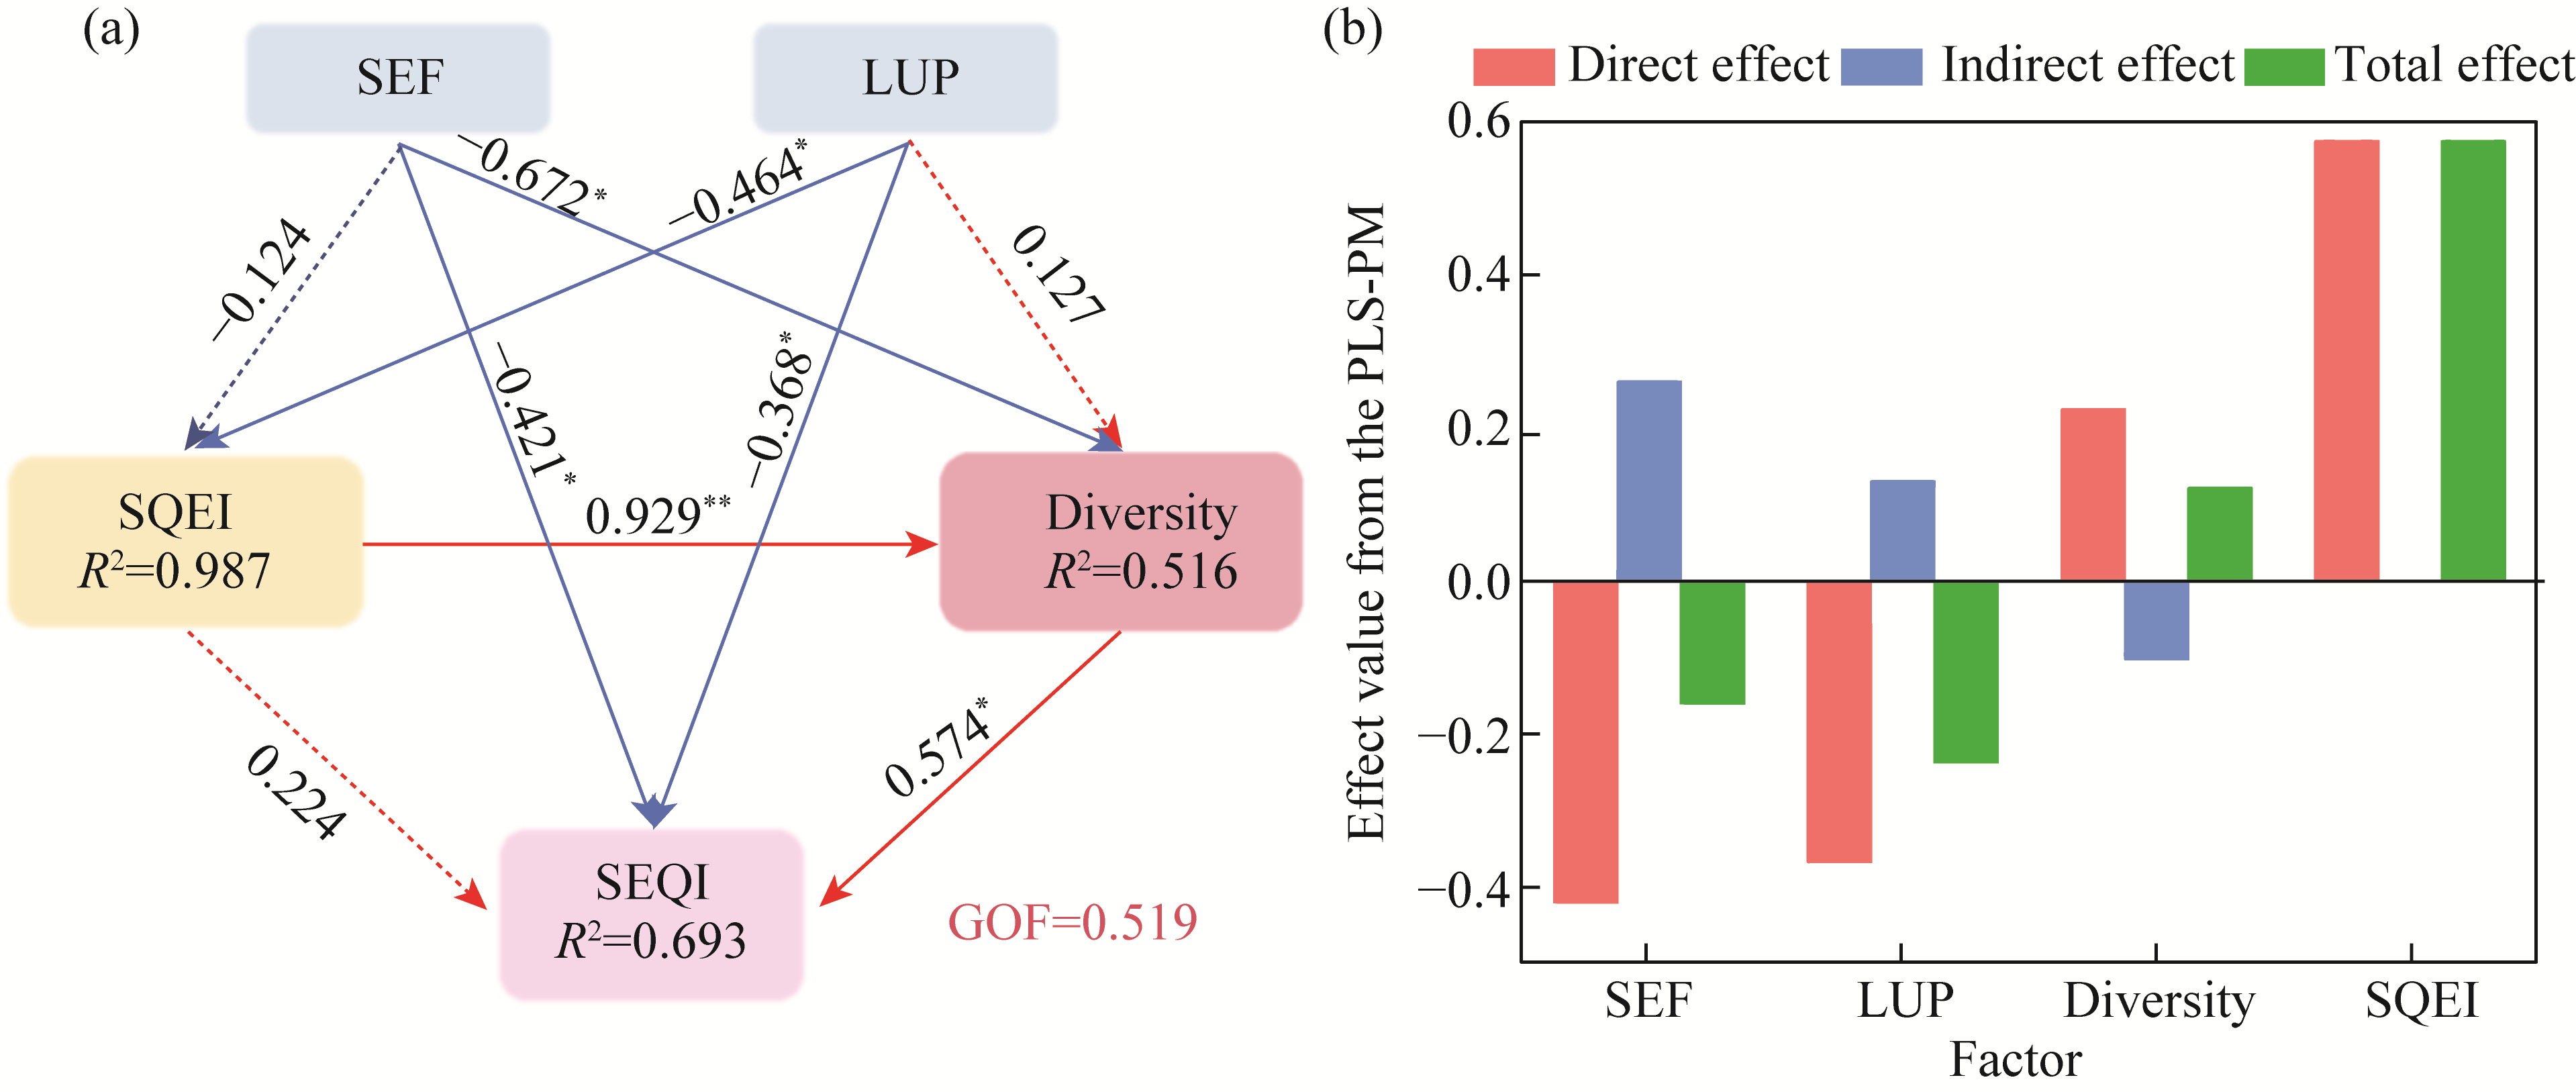
Fig. 6Direct and indirect effects of various factors on the profile of SEQI in the Beiluo River Basin using the Partial Least Squares-Path Modeling (PLS-PM). (a), PLS-PM path diagram showing latent variables of socioeconomic factors (SEF), land use pattern (LUP), SQEI, diversity index, and SEQI; (b), standard direct, indirect, and total effects obtained from the PLS-PM. Solid line indicates the direct effect, and dashed line indicates the indirect effect in Figure 6a. GOF, goodness of fit. *, P<0.050 level; **, P<0.010 level.
[1]
Allan D, Erickson D, Fay J. 1997. The influence of catchment land use on stream integrity across multiple spatial scales. Freshwater Biology, 37(1): 149-161.
doi: 10.1046/j.1365-2427.1997.d01-546.x
[2]
Baguley J G, Montagna P A, Cooksey C, et al. 2015. Community response of deep-sea soft-sediment macroinvertebrate metazoan to the Deepwater Horizon blowout and oil spill. Marine Ecology Progress Series, 528: 127-140.
doi: 10.3354/meps11290
[3]
Bhat R A, Singh D V, Qadri H, et al. 2022. Vulnerability of municipal solid waste: An emerging threat to aquatic ecosystems. Chemosphere, 287: 132223, doi: 10.1016/j.chemosphere.2021.132223.
[4]
Bijay-Singh, Craswell E. 2021. Fertilizers and nitrate pollution of surface and ground water: An increasingly pervasive global problem. SN Applied Sciences, 3: 518, doi: 10.1007/s42452-021-04521-8.
[5]
Callahan B J, McMurdie P J, Rosen M J, et al. 2016. DADA2: High-resolution sample inference from Illumina amplicon data. Nature Methods, 13: 581-583.
doi: 10.1038/nmeth.3869
pmid: 27214047
[6]
Castelli K R, Silva A M, Dunning Jr J B. 2021. Improving the biodiversity in urban green spaces: A nature based approach. Ecological Engineering, 173: 106398, doi: 10.1016/j.ecoleng.2021.106398.
[7]
Chung M G, Frank K A, Pokhrel Y, et al. 2021. Natural infrastructure in sustaining global urban freshwater ecosystem services. Nature Sustainability, 4: 1068-1075.
doi: 10.1038/s41893-021-00786-4
[8]
Clausen R, York R. 2008. Global biodiversity decline of marine and freshwater fish: A cross-national analysis of economic, demographic, and ecological influences. Social Science Research, 37(4): 1310-1320.
doi: 10.1016/j.ssresearch.2007.10.002
[9]
Davis N G, Hodson R, Matthaei C D. 2022. Long-term variability in deposited fine sediment and macroinvertebrate communities across different land-use intensities in a regional set of New Zealand Rivers. New Zealand Journal of Marine and Freshwater Research, 56(2): 191-212.
doi: 10.1080/00288330.2021.1884097
[10]
Dehkordi M M, Nodeh Z P, Dehkordi K S, et al. 2024. Soil, air, and water pollution from mining and industrial activities: Sources of pollution, environmental impacts, and prevention and control methods. Results in Engineering, 23: 102729, doi: 10.1016/j.rineng.2024.102729.
[11]
Deng Q C, Wei Y P, Yin J, et al. 2020. Ecological risk of human health in sediments in a Karstic river basin with high longevity population. Environmental Pollution, 265: 114418, doi: 10.1016/j.envpol.2020.114418.
[12]
Ding J, Jiang Y, Liu Q, et al. 2016. Influences of the land use pattern on water quality in low-order streams of the Dongjiang River basin, China: A multi-scale analysis. Science of The Total Environment, 551-552: 205-216.
doi: 10.1016/j.scitotenv.2016.01.162
[13]
Eastwood N, Zhou J R, Derelle R, et al. 2023. 100 years of anthropogenic impact causes changes in freshwater functional biodiversity. eLife, 12: RP86576, doi: 10.7554/eLife.86576.
[14]
Feng Y, Zheng B H, Jia H F, et al. 2021. Influence of social and economic development on water quality in Dongting Lake. Ecological Indicators, 131: 108220, doi: 10.1016/j.ecolind.2021.108220.
[15]
Ferreira V, Elosegi A, Tiegs S D, et al. 2020. Organic matter decomposition and ecosystem metabolism as tools to assess the functional integrity of streams and rivers-a systematic review. Water, 12(12): 3523, doi: 10.3390/w12123523.
[16]
Fu L, Dong X Y, Shen H L, et al. 2023. River ecosystem health assessment in rapid urbanization regions (Shenzhen, China) under the guidance of bioremediation objectives. Water, 15(21): 3859, doi: 10.3390/w15213859.
[17]
Gao X, Li W, Zhang Y L, et al. 2024. Integrated assessment of ecological quality combining biological and environmental data in the Yellow River estuary. Water, 16(11): 1615, doi: 10.3390/w16111615.
[18]
Gaur V K, Sharma P, Sirohi R, et al. 2020. Assessing the impact of industrial waste on environment and mitigation strategies: A comprehensive review. Journal of Hazardous Materials, 398: 123019, doi: 10.1016/j.jhazmat.2020.123019.
[19]
Gillis P L, Parrott J L, Helm P. 2022. Environmental fate and effects of road run-off. Archives of Environmental Contamination and Toxicology, 82: 159-161.
doi: 10.1007/s00244-021-00906-3
pmid: 34977971
[20]
Gong X H, Zhao Z H, Zhang L, et al. 2022. North-south geographic heterogeneity and control strategies for polycyclic aromatic hydrocarbons (PAHs) in Chinese lake sediments illustrated by forward and backward source apportionments. Journal of Hazardous Materials, 431: 128545, doi: 10.1016/j.jhazmat.2022.128545.
[21]
Gunarathne V, Phillips A J, Zanoletti A, et al. 2024. Environmental pitfalls and associated human health risks and ecological impacts from landfill leachate contaminants: Current evidence, recommended interventions and future directions. Science of The Total Environment, 912: 169026, doi: 10.1016/j.scitotenv.2023.169026.
[22]
Guo J P, Chen W W, Wu M L, et al. 2023. Distribution, sources, and risk assessment of organochlorine pesticides in water from Beiluo River, Loess Plateau, China. Toxics, 11(6): 496, doi: 10.3390/toxics11060496.
[23]
Guo J X, Pan Y, Chen R D, et al. 2024. Tracing nitrogen and phosphorus pollution in urban runoff: Insights from isotopic tracers and SWMM modeling. Journal of Cleaner Production, 472: 143513, doi: 10.1016/j.jclepro.2024.143513.
[24]
Haase P, Cortés-Guzmán D, He F, et al. 2025. Successes and failures of conservation actions to halt global river biodiversity loss. Nature Reviews Biodiversity, 1: 104-118.
doi: 10.1038/s44358-024-00012-x
[25]
Henseler J, Hubona G, Ray P A. 2017. Partial least squares path modeling:Updated guidelines. In: LatanH, NoonanR. Partial Least Squares Path Modeling. Cham: Springer, 19-39.
[26]
Husseneder C, Rayle P, Aker B G, et al. 2022. A comparison of intertidal metazoan biodiversity among different salinity zones of Louisiana coastal marshes. Frontiers in Environmental Science, 10: 950527, doi: 10.3389/fenvs.2022.950527.
[27]
Jahan S, Singh A. 2023. Causes and impact of industrial effluents on receiving water bodies: A review. Malaysian Journal of Science and Advanced Technology, 3(2): 111-121.
[28]
Juncal M J L, Masino P, Bertone E, et al. 2023. Towards nutrient neutrality: A review of agricultural runoff mitigation strategies and the development of a decision-making framework. Science of The Total Environment, 874: 162408, doi: 10.1016/j.scitotenv.2023.162408.
[29]
Jwaideh M A, Sutanudjaja E H, Dalin C. 2022. Global impacts of nitrogen and phosphorus fertiliser use for major crops on aquatic biodiversity. The International Journal of Life Cycle Assessment, 27: 1058-1080.
doi: 10.1007/s11367-022-02078-1
[30]
Kang Y, Yue L P, Xu Y, et al. 2008. Impact of petroleum exploitation on water environment in the upper reaches of north Luohe River in northern Shaanxi. Journal of Catastrophology, 23(3): 71-75, 95. (in Chinese)
[31]
Kõljalg U, Nilsson R H, Abarenkov K, et al. 2013. Towards a unified paradigm for sequence-based identification of fungi. Molecular Ecology, 22(21): 5271-5277.
doi: 10.1111/mec.12481
pmid: 24112409
[32]
Kuang W H, Hou Y L, Dou Y Y, et al. 2021. Mapping global urban impervious surface and green space fractions using Google Earth Engine. Remote Sensing, 13(20): 4187, doi: 10.3390/rs13204187.
[33]
Lee J W, Lee S W, Park S R. 2025. Assessing the effect of environmental factors and land use changes on benthic macroinvertebrate communities in stream ecosystems. Ecological Informatics, 91: 103404, doi: 10.1016/j.ecoinf.2025.103404.
[34]
Lerat-Hardy A, Coynel A, Schäfer J, et al. 2022. Impacts of highway runoff on metal contamination including rare earth elements in a small urban watershed: case study of Bordeaux Metropole (SW France). Archives of Environmental Contamination and Toxicology, 82: 206-226.
doi: 10.1007/s00244-021-00816-4
[35]
Li F L, Altermatt F, Yang J H, et al. 2020. Human activities' fingerprint on multitrophic biodiversity and ecosystem functions across a major river catchment in China. Global Change Biology, 26(12): 6867-6879.
doi: 10.1111/gcb.v26.12
[36]
Li J Q, Yang N, Shen Z Y. 2024. Evaluation of the water quality monitoring network layout based on driving-pressure-state-response framework and entropy weight TOPSIS model: A case study of Liao River, China. Journal of Environmental Management, 361: 121267, doi: 10.1016/j.jenvman.2024.121267.
[37]
Li X L, Brierley G, Shi D J, et al. 2012. Ecological protection and restoration in Sanjiangyuan National Nature Reserve, Qinghai Province, China. Perspectives on environmental management and technology in Asian river basins, In: HiggittD. Perspectives on Environmental Management and Technology in Asian River Basins. Dordrecht: Springer, 93-120.
[38]
Li Y, Bi Y H, Mi W J, et al. 2021. Land-use change caused by anthropogenic activities increase fluoride and arsenic pollution in groundwater and human health risk. Journal of Hazardous Materials, 406: 124337, doi: 10.1016/j.jhazmat.2020.124337.
[39]
Li Y, Mi W J, Ji L, et al. 2023a. Urbanization and agriculture intensification jointly enlarge the spatial inequality of river water quality. Science of The Total Environment, 878: 162559, doi: 10.1016/j.scitotenv.2023.162559.
[40]
Li Y, Wang J, Lin C Y, et al. 2023b. Riverine antibiotic occurrence and potential ecological risks in a low-urbanized and rural basin of the middle Yangtze River: Socioeconomic, land use, and seasonal effects. Environmental Research, 228: 115827, doi: 10.1016/j.envres.2023.115827.
[41]
Liu J G, Zang C F, Tian S Y, et al. 2013. Water conservancy projects in China: Achievements, challenges and way forward. Global Environmental Change, 23(3): 633-643.
doi: 10.1016/j.gloenvcha.2013.02.002
[42]
Locke K A. 2024. Impacts of land use/land cover on water quality: A contemporary review for researchers and policymakers. Water Quality Research Journal, 59(2): 89-106.
[43]
Lu W W, Font R A, Cheng S P, et al. 2019. Assessing the context and ecological effects of river restoration-A meta-analysis. Ecological Engineering, 136: 30-37.
doi: 10.1016/j.ecoleng.2019.06.004
[44]
Luo H J, Sun Y N, Pan J, et al. 2024. Residual distribution and risk assessment of neonicotinoids in urban green space soils of the Pearl River Delta, South China: A socioeconomic analysis. Journal of Hazardous Materials, 477: 135330, doi: 10.1016/j.jhazmat.2024.135330.
[45]
Madi E N Garibaldi, J M, Wagner C. 2016. An exploration of issues and limitations in current methods of TOPSIS and fuzzy TOPSIS. 2016 IEEE International Conference on Fuzzy Systems (FUZZ-IEEE). Vancouver: IEEE, 2098-2105.
[46]
Markert N, Guhl B, Feld C K. 2024. Linking wastewater treatment plant effluents to water quality and hydrology: Effects of multiple stressors on fish communities. Water Research, 260: 121914, doi: 10.1016/j.watres.2024.121914.
[47]
Matiatos I, Wassenaar L I, Monteiro L R, et al. 2021. Global patterns of nitrate isotope composition in rivers and adjacent aquifers reveal reactive nitrogen cascading. Communications Earth & Environment, 2: 52, doi: 10.1038/s43247-021-00121-x.
[48]
McGovern M, Poste A E, Oug E, et al. 2020. Riverine impacts on benthic biodiversity and functional traits: A comparison of two sub-Arctic fjords. Estuarine, Coastal and Shelf Science, 240: 106774, doi: 10.1016/j.ecss.2020.106774.
[49]
Mo J, Li X L, Mou A N, et al. 2024. Metazoan diversity and community assemblages in sediments across a Western Pacific Trench-Arc-Basin system: Insights from eDNA metabarcoding. Frontiers in Marine Science, 10: 1320540, doi: 10.3389/fmars.2023.1320540.
[50]
Molla A H, Saha R, Sultana S, et al. 2025. Assessment of toxicities and threat to biodiversity in an industrial effluent discharged environment. International Journal of Environmental Science and Technology, 22: 2591-2600.
doi: 10.1007/s13762-024-05777-4
[51]
Munier N, Hontoria E. 2021. Uses and Limitations of the AHP Method. Cham: Springer.
[52]
Nava-López M Z, Diemont S A, Hall M, et al. 2016. Riparian buffer zone and whole watershed influences on river water quality: Implications for ecosystem services near megacities. Environmental Processes, 3: 277-305.
doi: 10.1007/s40710-016-0145-3
[53]
Newbold T, Hudson L N, Hill S L L, et al. 2015. Global effects of land use on local terrestrial biodiversity. Nature, 520: 45-50.
doi: 10.1038/nature14324
[54]
Nguyen H H, Venohr M, Gericke A, et al. 2023. Dynamics in impervious urban and non-urban areas and their effects on run-off, nutrient emissions, and macroinvertebrate communities. Landscape and Urban Planning, 231: 104639, doi: 10.1016/j.landurbplan.2022.104639.
[55]
Qian B, Zhu Y X, Wang W X, et al. 2020. Can entropy weight method correctly reflect the distinction of water quality indices? Water Resources Management, 34: 3667-3674.
doi: 10.1007/s11269-020-02641-1
[56]
Qian Y, Dong Z, Yan Y, et al. 2022. Ecological risk assessment models for simulating impacts of land use and landscape pattern on ecosystem services. Science of The Total Environment, 833: 155218, doi: 10.1016/j.scitotenv.2022.155218.
[57]
Qin B Q, Paerl H W, Brookes J D, et al. 2019. Why Lake Taihu continues to be plagued with cyanobacterial blooms through 10 years (2007-2017) efforts. Science Bulletin, 64(6): 354-356.
doi: 10.1016/j.scib.2019.02.008
[58]
Ren Q Y, Hill J E. 2023. Rapid and accurate taxonomic classification of cpn 60 amplicon sequence variants. ISME Communications, 3(1): 77, doi: 10.1038/s43705-023-00283-z.
[59]
Ru X T, Qiao L X, Zhang H P, et al. 2024. Effects of land use and land cover change under shared socioeconomic pathways on future climate in the Yellow River basin, China. Urban Climate, 55: 101867, doi: 10.1016/j.uclim.2024.101867.
[60]
Shen L Z Q, Amatulli G, Sethi T, et al. 2020. Estimating nitrogen and phosphorus concentrations in streams and rivers, within a machine learning framework. Scientific Data, 7: 161, doi: 10.1038/s41597-020-0478-7.
pmid: 32467642
[61]
Singh R, Tiwari A K, Singh G S. 2021. Managing riparian zones for river health improvement: An integrated approach. Landscape and Ecological Engineering, 17: 195-223.
doi: 10.1007/s11355-020-00436-5
[62]
Song M M, Jiang Y, Liu Q, et al. 2021. Catchment versus riparian buffers: which land use spatial scales have the greatest ability to explain water quality changes in a typical temperate watershed?. Water, 13(13): 1758, doi: 10.3390/w13131758.
[63]
Soni H, Yadav R K, Patra S K. 2025. Global impact of urbanization on ecosystems: A comprehensive bibliometric analysis. Natural Hazards Research, 5(1): 21-35.
doi: 10.1016/j.nhres.2024.04.001
[64]
Sun H T, Chen Q Q, Chen W W, et al. 2022. Assessment of biological community in riparian zone contaminated by PAHs: Linking source apportionment to biodiversity. Science of The Total Environment, 851: 158121, doi: 10.1016/j.scitotenv.2022.158121.
[65]
Sun H T, Chen Q Q, Qu C K, et al. 2023. Occurrence of OCPs & PCBs and their effects on multitrophic biological communities in riparian groundwater of the Beiluo River, China. Ecotoxicology and Environmental Safety, 253: 114713, doi: 10.1016/j.ecoenv.2023.114713.
[66]
Tian Y L, Hao Y R, Qu C K, et al. 2024. Biodiversity of multi-trophic biological communities within riverine sediments impacted by PAHs contamination and land use changes. Environmental Pollution, 361: 124884, doi: 10.1016/j.envpol.2024.124884.
[67]
Wang R J, Liu L J, Tao Z Z, et al. 2024a. Effect of urbanization and urban forests on water quality improvement in the Yangtze River Delta: A case study in Hangzhou, China. Journal of Environmental Management, 351: 119980, doi: 10.1016/j.jenvman.2023.119980.
[68]
Wang S Y, Shentu H B, Yu H L, et al. 2024b. Impact of urbanization and land use on wetland water quality: A case study in Mengxi town. Urban Climate, 55: 101855, doi: 10.1016/j.uclim.2024.101855.
[69]
Wang Z, Xing X G, Yan F. 2021. An abnormal phenomenon in entropy weight method in the dynamic evaluation of water quality index. Ecological Indicators, 131: 108137, doi: 10.1016/j.ecolind.2021.108137.
[70]
Wen X, Zhen L. 2020. Soil erosion control practices in the Chinese Loess Plateau: A systematic review. Environmental Development, 34: 100493, doi: 10.1016/j.envdev.2019.100493.
[71]
Wen Y R, Schoups G, Van De Giesen N. 2017. Organic pollution of rivers: Combined threats of urbanization, livestock farming and global climate change. Scientific Reports, 7: 43289, doi: 10.1038/srep43289.
pmid: 28230079
[72]
Wilson M W, Ridlon A D, Gaynor K M, et al. 2020. Ecological impacts of human-induced animal behaviour change. Ecology Letters, 23(10): 1522-1536.
doi: 10.1111/ele.13571
pmid: 32705769
[73]
Wu H Y, Xu Y M, Zhang M, et al. 2024. Spatially explicit assessment of the heat-related health risk in the Yangtze River Delta, China, using multisource remote sensing and socioeconomic data. Sustainable Cities and Society, 104: 105300, doi: 10.1016/j.scs.2024.105300.
[74]
Xia X H, Zhang Y D. 2023. Impact of river water-sediment conditions on water-quality assessment. Scientia Sinica Technologica, 53(11): 1807-1814. (in Chinese)
doi: 10.1360/SST-2021-0603
[75]
Xie H Y, Ma Y, Jin X W, et al. 2024. Land use and river-lake connectivity: Biodiversity determinants of lake ecosystems. Environmental Science and Ecotechnology, 21: 100434, doi: 10.1016/j.ese.2024.100434.
[76]
Xing J C, Zhang J J, Wang J, et al. 2023. Ecological restoration in the Loess Plateau, China necessitates targeted management strategy: Evidence from the Beiluo River Basin. Forests, 14(9): 1753, doi: 10.3390/f14091753.
[77]
Yang H, Feng Q, Zhu J Y, et al. 2024. Towards sustainable futures: a review of sediment remediation and resource valorization techniques. Journal of Cleaner Production, 435: 140529, doi: 10.1016/j.jclepro.2023.140529.
[78]
Zhang C H, Zhao G F, Jiao Y N, et al. 2023. Critical analysis on the transformation and upgrading strategy of Chinese municipal wastewater treatment plants: Towards sustainable water remediation and zero carbon emissions. Science of The Total Environment, 896: 165201, doi: 10.1016/j.scitotenv.2023.165201.
[79]
Zhang X, Li S. 2022. Spatial and temporal distribution characteristics of water quality in Beiluo River and pollution sources based on principal component analysis. Bulletin of Soil and Water Conservation, 42(4): 153-160, 171. (in Chinese)
[80]
Zhang X Y, Zhang S H, Fang L, et al. 2024. The impacts of socioeconomic development and climate change on long-term nutrient dynamics: A case study in Poyang Lake. Science of The Total Environment, 957: 177843, doi: 10.1016/j.scitotenv.2024.177843.
[81]
Zhao Q Y, Zhang Y Y, Li X W, et al. 2024a. Evaluating a river's ecological health: A multidimensional approach. Environmental Science and Ecotechnology, 21: 100423, doi: 10.1016/j.ese.2024.100423.
[82]
Zhao X C, Xu H, Kang L J, et al. 2024b. Nitrate sources and transformations in a river-reservoir system: Response to extreme flooding and various land use. Journal of Hydrology, 638: 131491, doi: 10.1016/j.jhydrol.2024.131491.
[83]
Zhao X N, Shi J W, Xue L H, et al. 2024c. Water point and non-point nitrogen pollution due to land-use change and nitrate deposition in China from 2000 to 2020. Water, 16(10): 1396, doi: 10.3390/w16101396.
[84]
Zhi L H, Li X W, Bai J H, et al. 2020. Integrating ecological and socioeconomic networks using nitrogen metabolism in the Yellow River Delta, China. Resources, Conservation and Recycling, 162: 105012, doi: 10.1016/j.resconrec.2020.105012.
[85]
Zhou M X, Guo F Y. 2024. Mechanism and spatial spillover effect of digital economy on common prosperity in the Yellow River Basin of China. Scientific Reports, 14: 23086, doi: 10.1038/s41598-024-72257-7.
pmid: 39367017
[86]
Zou Z H, Yi Y, Sun J N. 2006. Entropy method for determination of weight of evaluating indicators in fuzzy synthetic evaluation for water quality assessment. Journal of Environmental Sciences, 18(5): 1020-1023.
doi: 10.1016/S1001-0742(06)60032-6