Quantifying the evolution of solar photovoltaic power potential in Xinjiang Uygur Autonomous Region (hereinafter referred as to Xinjiang) is critical for energy planning under China's carbon neutrality goals. This study applied the Equidistant Cumulative Distribution Function Matching (EDCDFm) method to correct biases in the sixth phase of the Coupled Model Intercomparison Project (CMIP6) multi-model data, using the fifth generation of European Centre for Medium Range Weather Forecasts (ECMWF) Reanalysis-Land (ERA5-Land) as a reference. Corrected data were used to drive 11 widely validated empirical photovoltaic models to evaluate the spatiotemporal evolution of photovoltaic power potential in Xinjiang from 2000 to 2060. The results showed that average annual power potential from 2000 to 2020 was 282.29 kWh/m2, with higher values in the south and lower in the north and a slight decreasing trend. In terms of future forecasting, compared with historical baseline period, photovoltaic power potential increased slightly under the Shared Socioeconomic Pathway (SSP)1-2.6 scenario, with about 79.41% of the land area showing favorable conditions of increased photovoltaic power potential and reduced coefficient of variation (CV). In contrast, under the SSP2-4.5 and SSP5-8.5 scenarios, unfavorable pattern of decreased photovoltaic power potential and increased CV expanded significantly, covering about 24.66% and 37.65% of the total area, respectively. Analysis of influencing factors showed that solar radiation was the dominant factor controlling photovoltaic power potential, while rising temperature had a negative effect. Under the SSP5-8.5 scenario, reduced solar radiation and rising temperature were the main factors driving the decline in photovoltaic power potential. At the regional level, although the central area currently had relatively low potential, it shows a decreasing CV and continuously increasing photovoltaic power potential in the future, indicating better conditions for development. Economic analysis showed that, under standard carbon price, the levelized cost of electricity (LCOE) on the SSP1-2.6 path was the lowest, yielding significant net social benefits. This study indicates that pursuing a sustainable development path is a key to mitigating the adverse impacts of climate change, providing scientific reference for medium- and long-term photovoltaic installation planning in Xinjiang.
Received: 19 December 2025
Published: 31 July 2026
MENG Nana, LI Ran, PENG Yimo, GE Tianxu, FAN Shichen, ZHANG Haiwei. Photovoltaic power potential of variability and its influencing factors in Xinjiang, China. Journal of Arid Land, 2026, 18(7): 1258-1282.
Fig. 1Overview of Xinjiang Uygur Autonomous Region (hereinafter referred to as Xinjiang) based on elevation data. DEM, digital elevation model. The figure is based on the standard map (GS(2024)0650) provided by the National Platform for Common Geospatial Information Services (http://bzdt.ch.mnr.gov.cn/). The boundary of the base map has not been modified.
Model
Institution
Resolution (longitude×latitude grid points)
ACCESS-ESM1-5
Commonwealth Scientific and Industrial Research Organization, Australia
192×145
BCC-CSM2-MR
Beijing Climate Center, China
320×160
CAMS-CSM1-0
Chinese Academy of Meteorological Sciences, China
320×160
FIO-ESM-2-0
First Institute of Oceanography, Ministry of Natural Resources of the People's Republic of China; and Qingdao National Laboratory for Marine Science and Technology, China
288×192
NESM3
Center for Earth System Modeling, Nanjing University of Information Science & Technology, China
192×96
TaiESM1
Research Center for Environmental Changes, Academia Sinica, Taiwan, China
288×192
CMCC-CM2-SR5
Fondazione Centro Euro-Mediterraneo sui Cambiamenti Climatici, Italy
288×192
IITM-ESM
Centre for Climate Change Research, Indian Institute of Tropical Meteorology Pune, India
192×94
MPI-ESM1-2-LR
Max Planck Institute for Meteorology, Germany
192×96
CanESM5
Canadian Centre for Climate Modelling and Analysis, Canada
128×64
Table S1 A list of the sixth phase of the Coupled Model Intercomparison Project (CMIP6) models
Table 1 Summary of empirical models for photovoltaic power potential
Parameter
Model 1
Model 2
Model 3
Model 4
Model 5
Model 6
Model 7
Model 8
Model 9
Model 10
Model 11
ηref
15
15
15
15
15
12
12
15
15
15
15
β
0.0045
0.0050
0.0045
0.0045
0.0045
0.0045
0.0045
0.0045
Tref
25
25
25
25
25
25
25
25
25
NOCT
47.0
47.0
45.5
45.5
47.0
RSTC
0.8
0.8
0.8
0.8
0.8
0.8
1.0
bh
0.81
ch
-1.63
W1
1
c1
4.22
47.00
-3.75
c2
1.080
0.943
1.140
c3
0.0226
0.0280
0.0175
c4
1.830
1.528
γ
0.10
0.12
0.10
τα
0.8531
A1
1.044
A2
-0.044
A3
0.05
γ1
-0.0041
k1
-0.017162
k2
-0.040289
k3
-0.004681
k4
0.000148
k5
0.000169
k6
0.000005
cT
0.035
Table S2 Values of constant parameters in the 11 photovoltaic models shown in Table 1
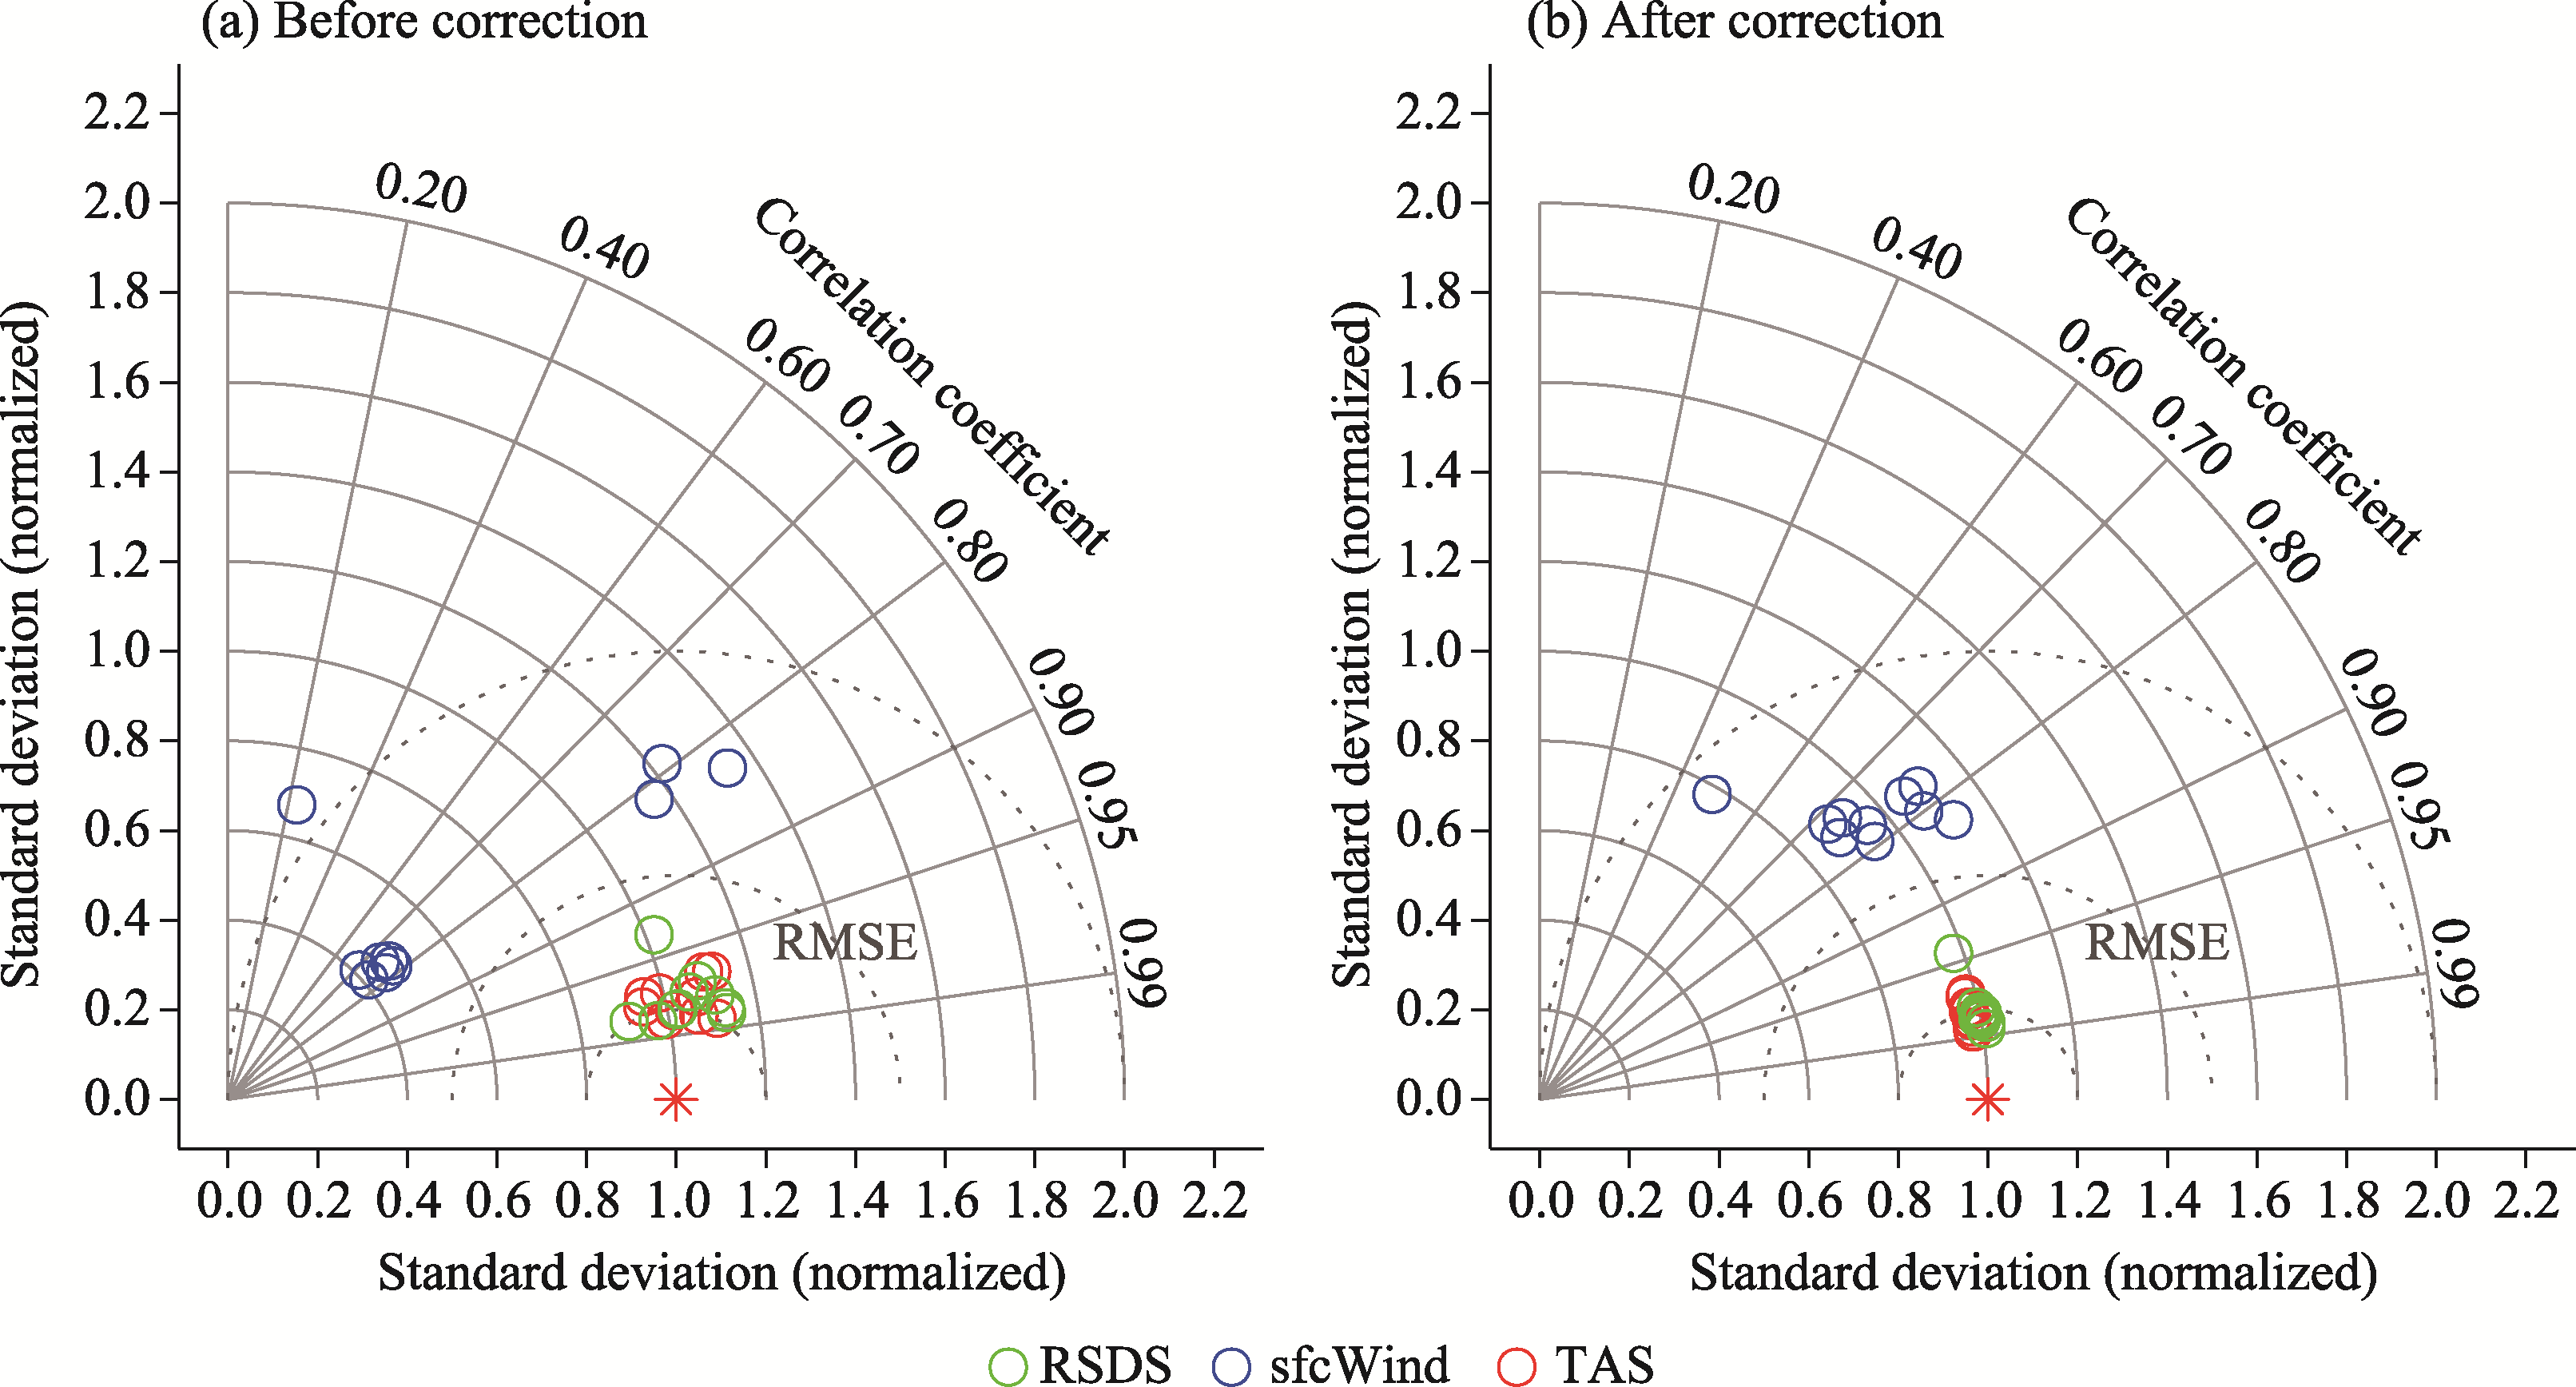
Fig. 2Taylor diagrams for the surface downward shortwave radiation (RSDS), near-surface wind speed at a height of 10 m (sfcWind), and near-surface air temperature at a height of 2 m (TAS) in Xinjiang during the historical baseline period (2000-2020), compared against reference data, before (a) and after (b) correction. The red star symbol represents the reference fields of the fifth generation of European Centre for Medium-Range Weather Forecasts (ECMWF) Reanalysis-Land (ERA5-Land). The azimuth angle corresponds to the Pearson correlation coefficient of the spatial pattern. The radial distance from the origin indicates the ratio of the standard deviation between simulations and the reference. The distance from a simulation point to the reference point represents the centered root mean square error (RMSE).
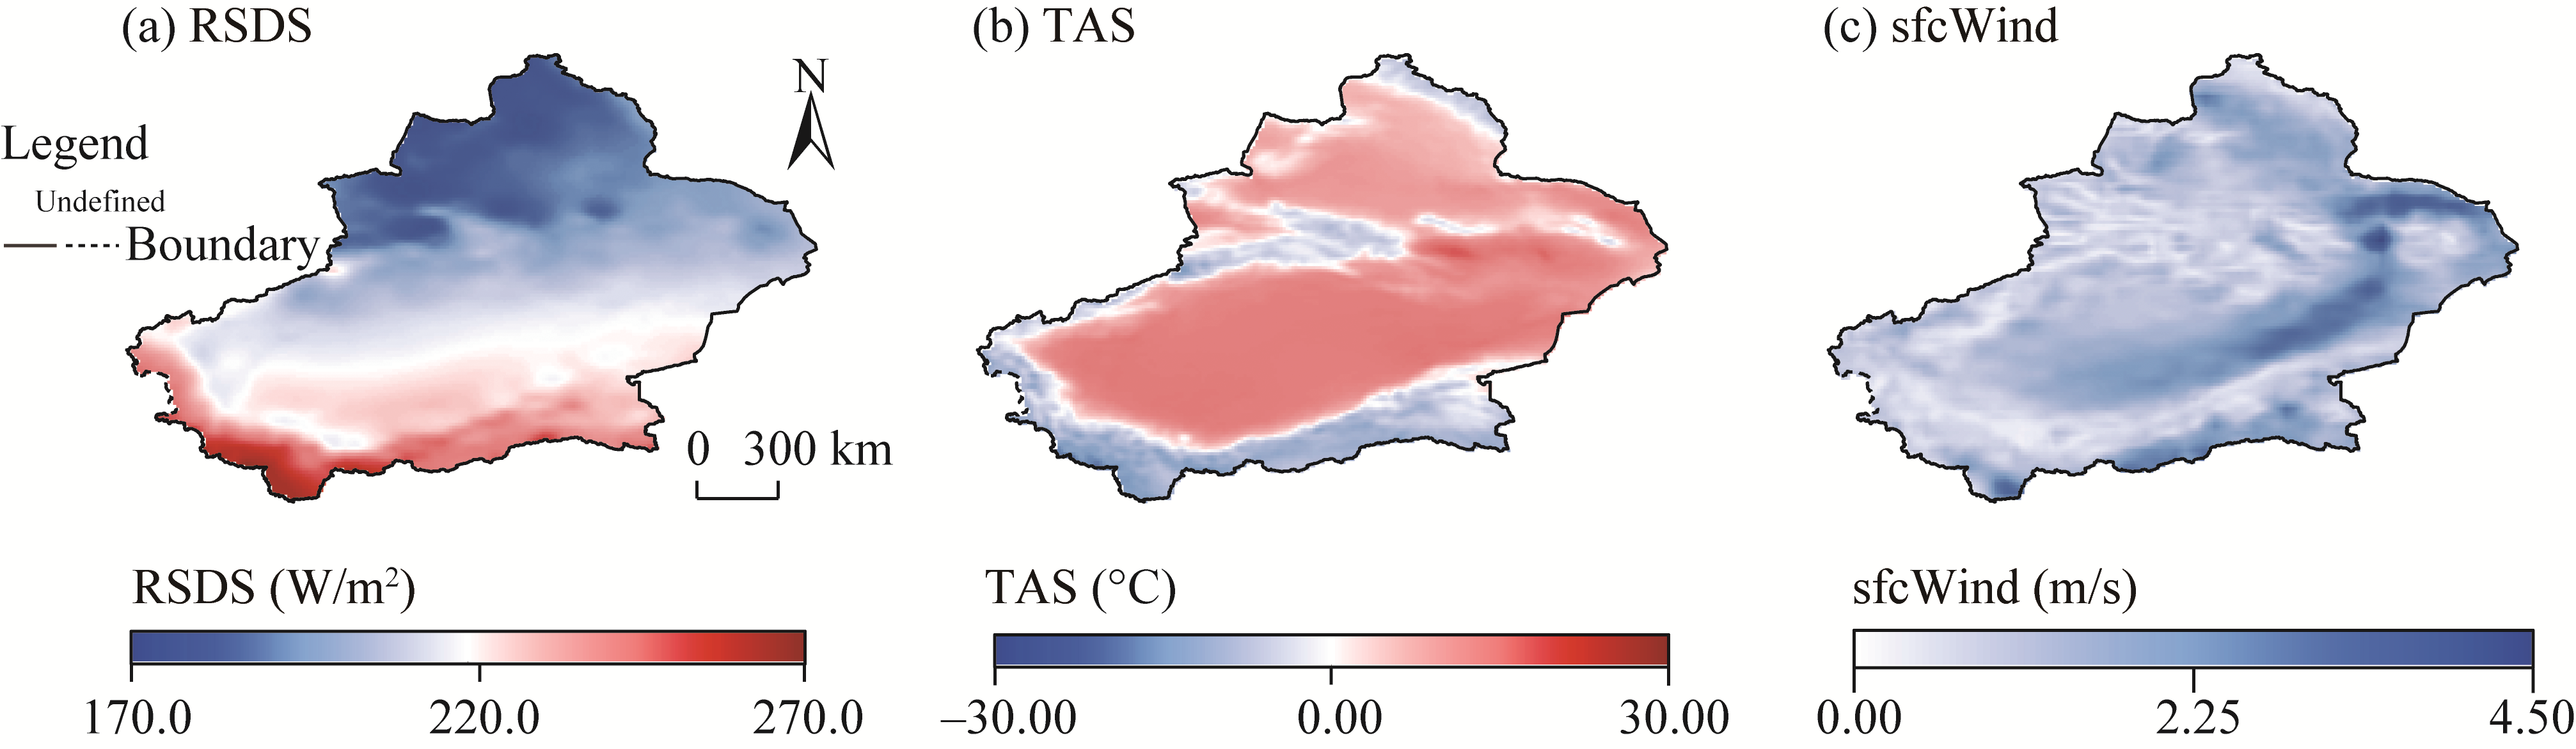
Fig. 3Spatial distribution of multi-year annual means of RSDS (a), TAS (b), and sfcWind (c) derived from ERA5-Land for the historical baseline period (2000-2020)
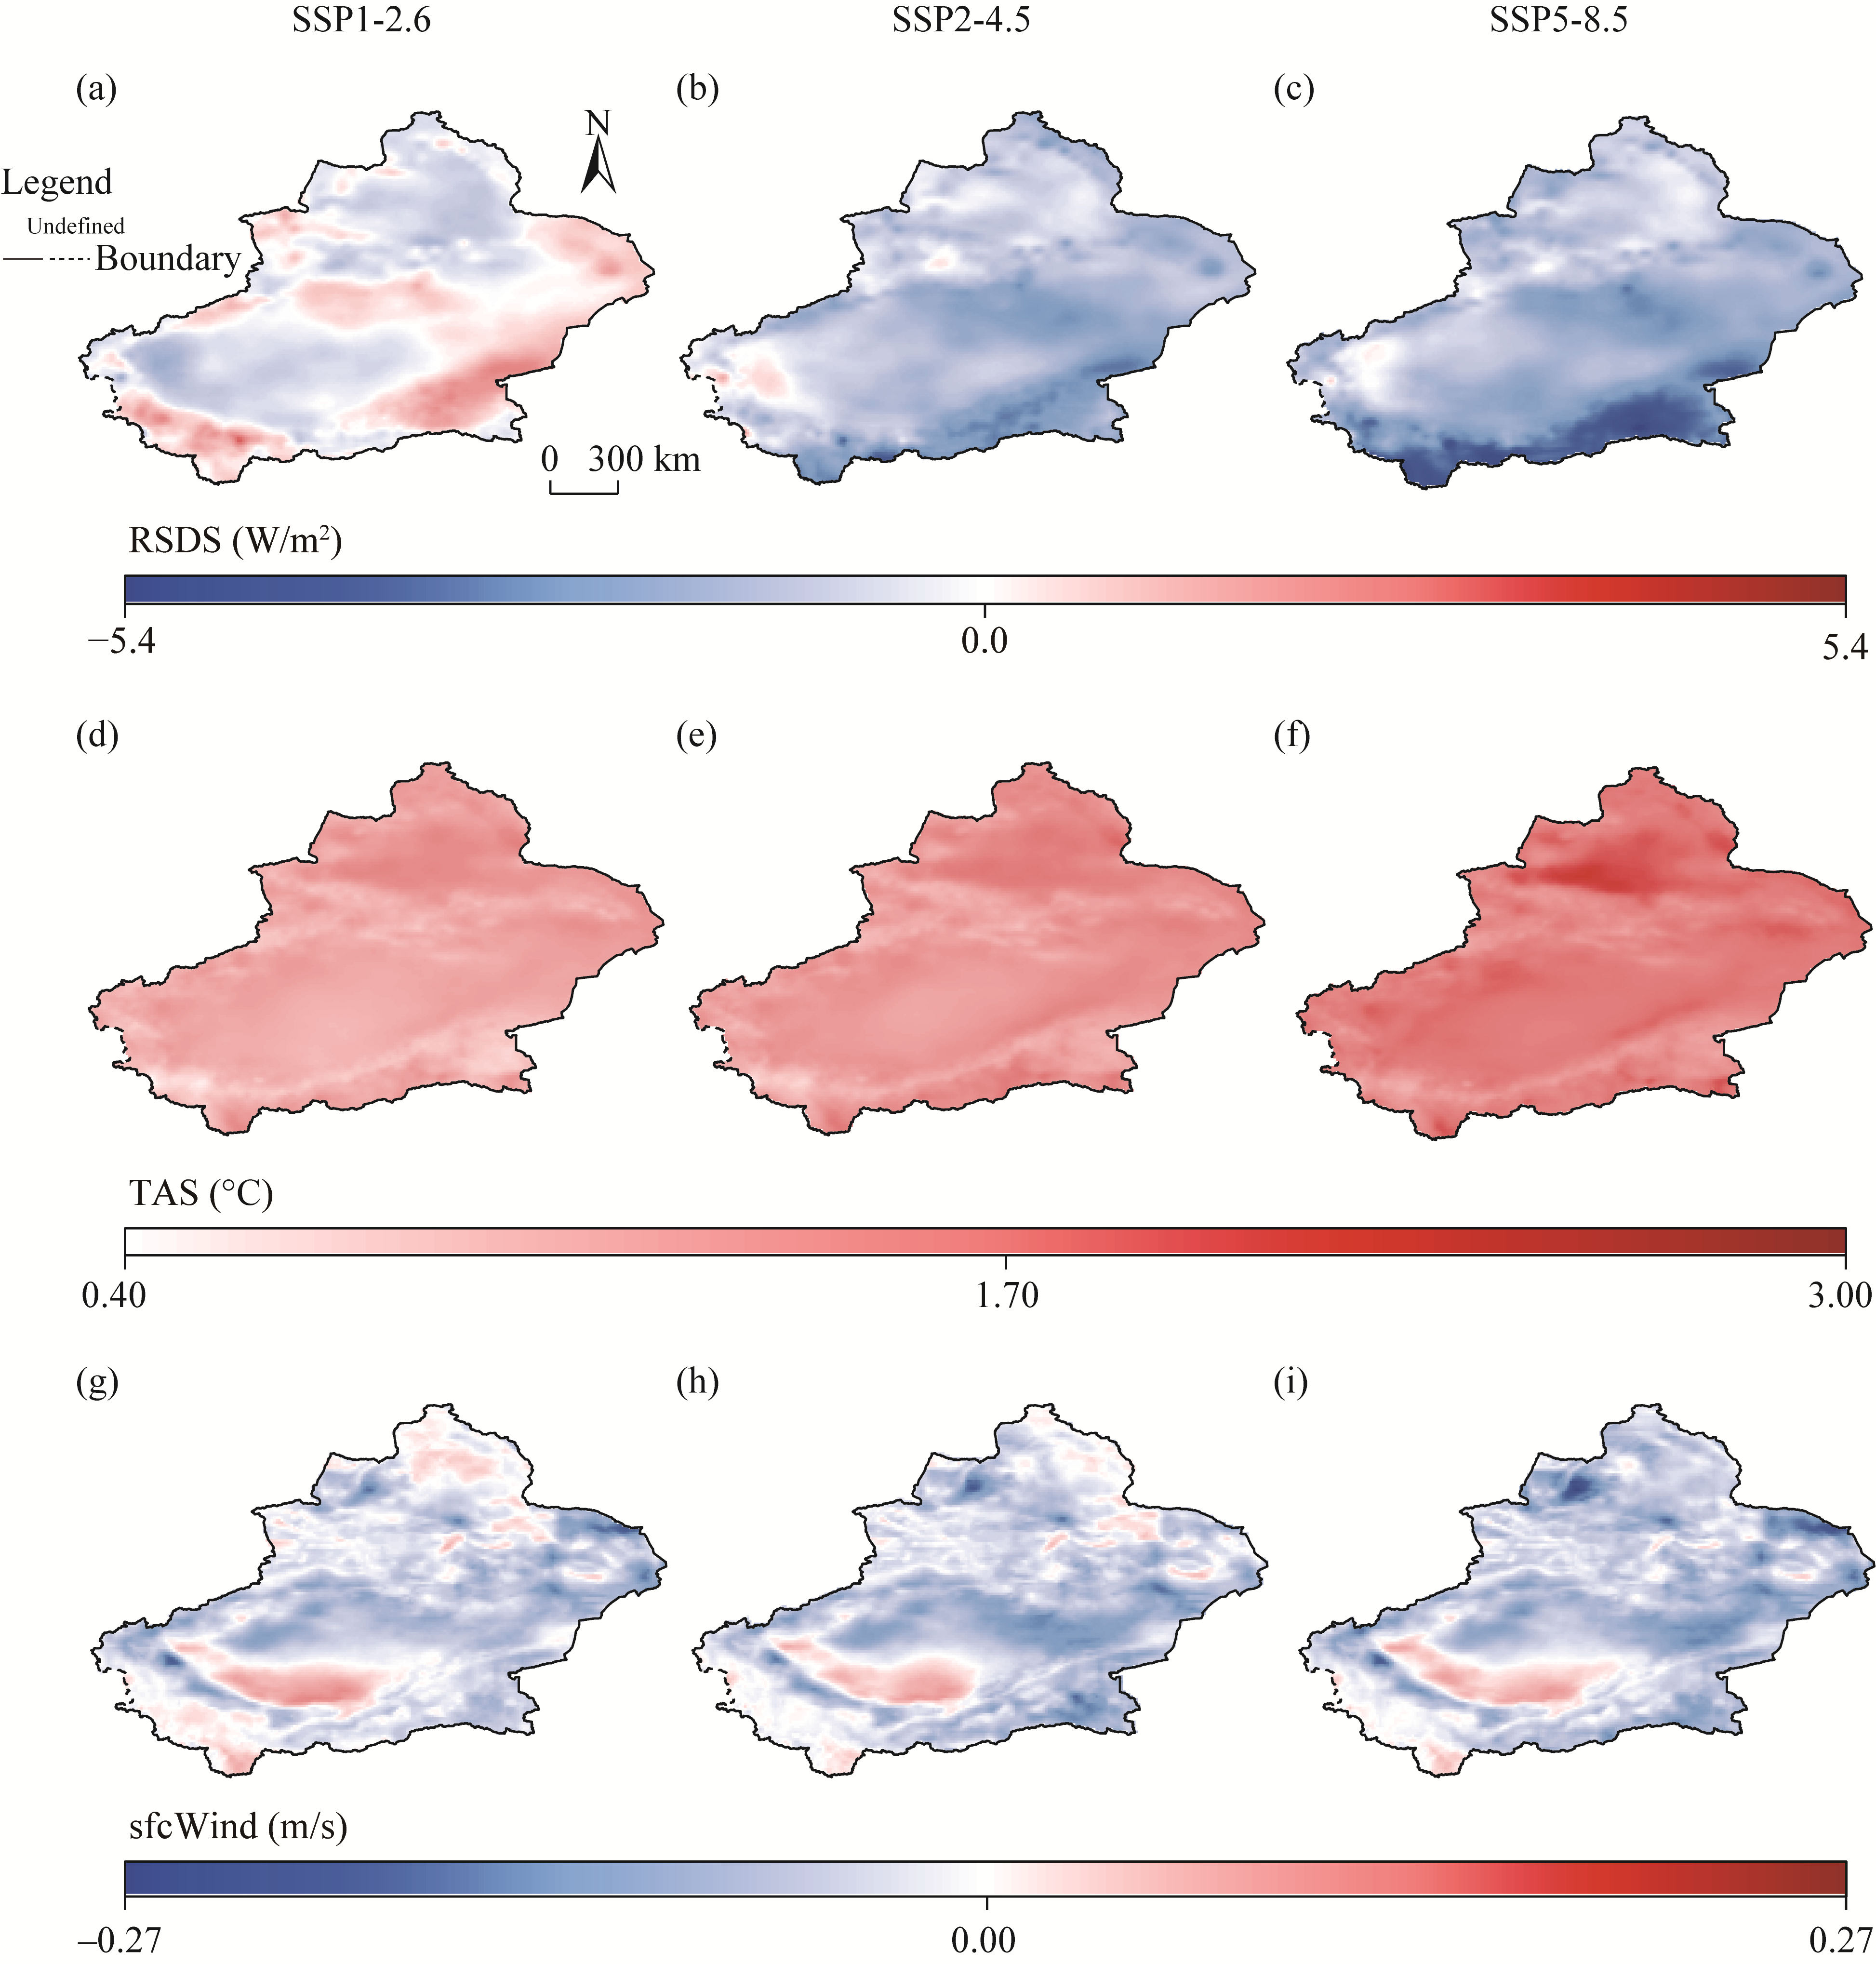
Fig. 4Absolute changes of RSDS (a-c), TAS (d-f), and sfcWind (g-i) in Xinjiang during 2021-2060 under different Shared Socioeconomic Pathways (SSPs)
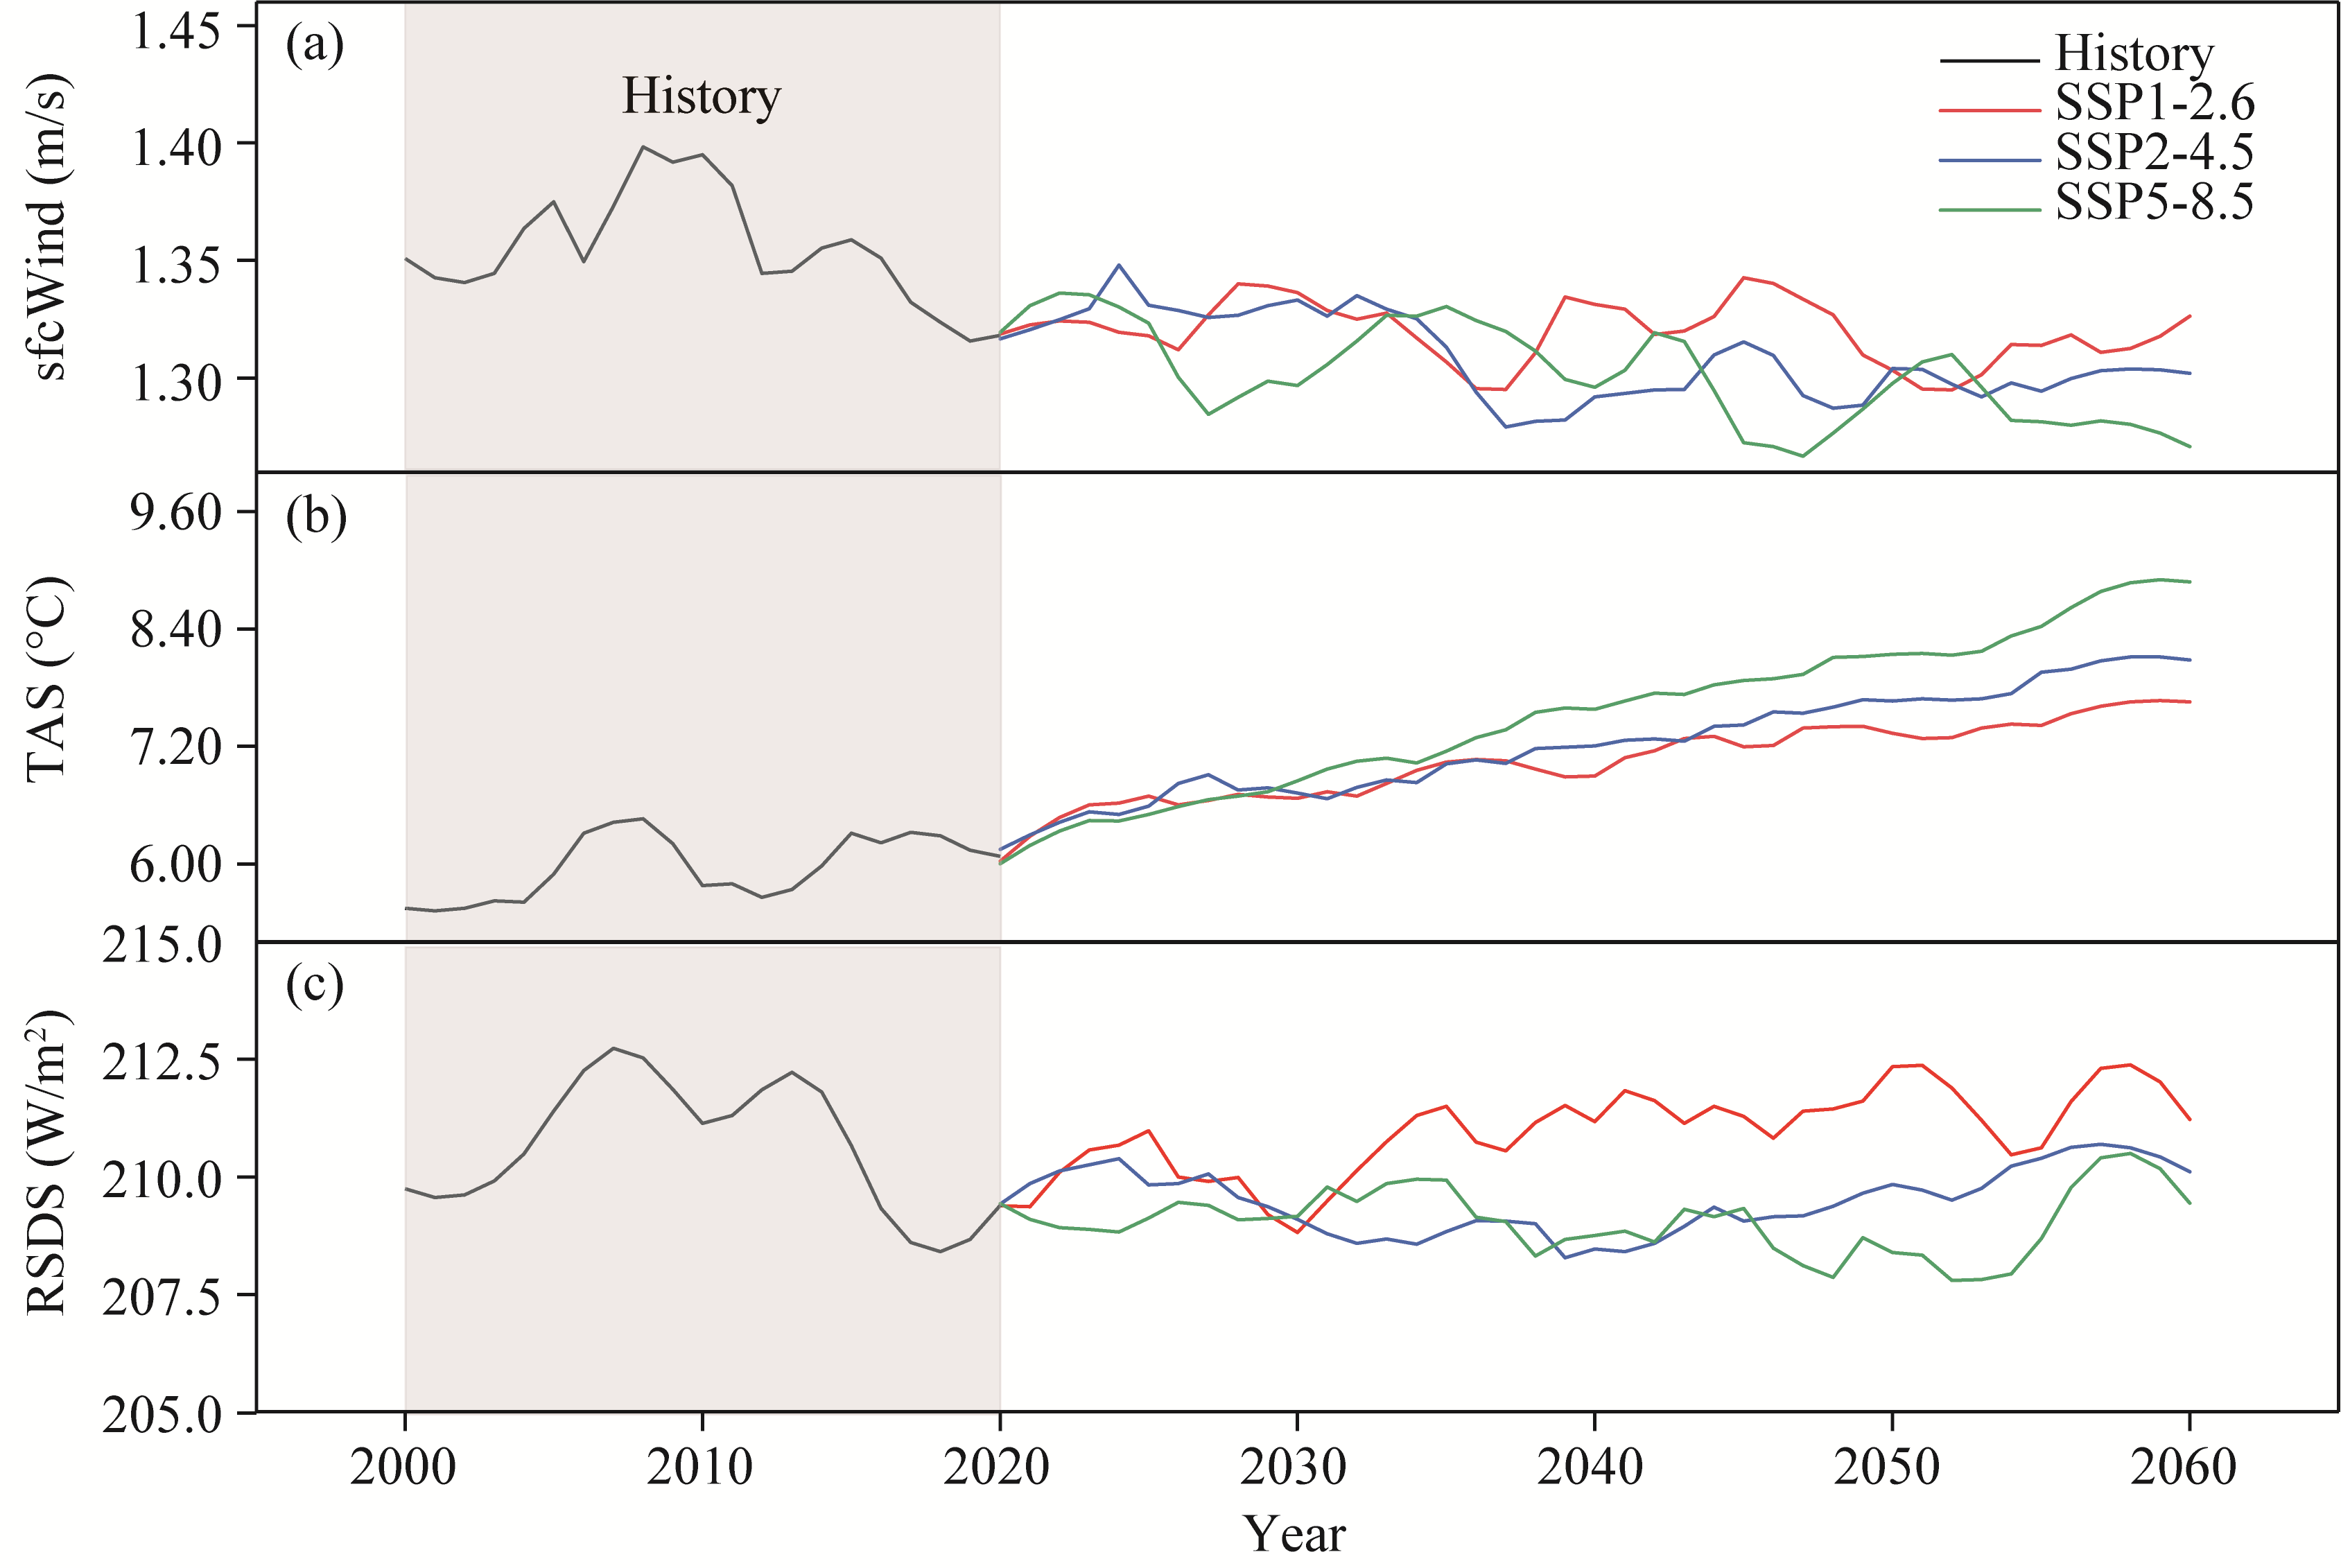
Fig. 5Inter-annual variation of sfcWind (a), TAS (b), and RSDS (c)
Fig. 6Spatial distribution of the annual average photovoltaic power potential in Xinjiang during 2000-2020 evaluated by 11 different photovoltaic models (a-k) and mean of multi-model (l)
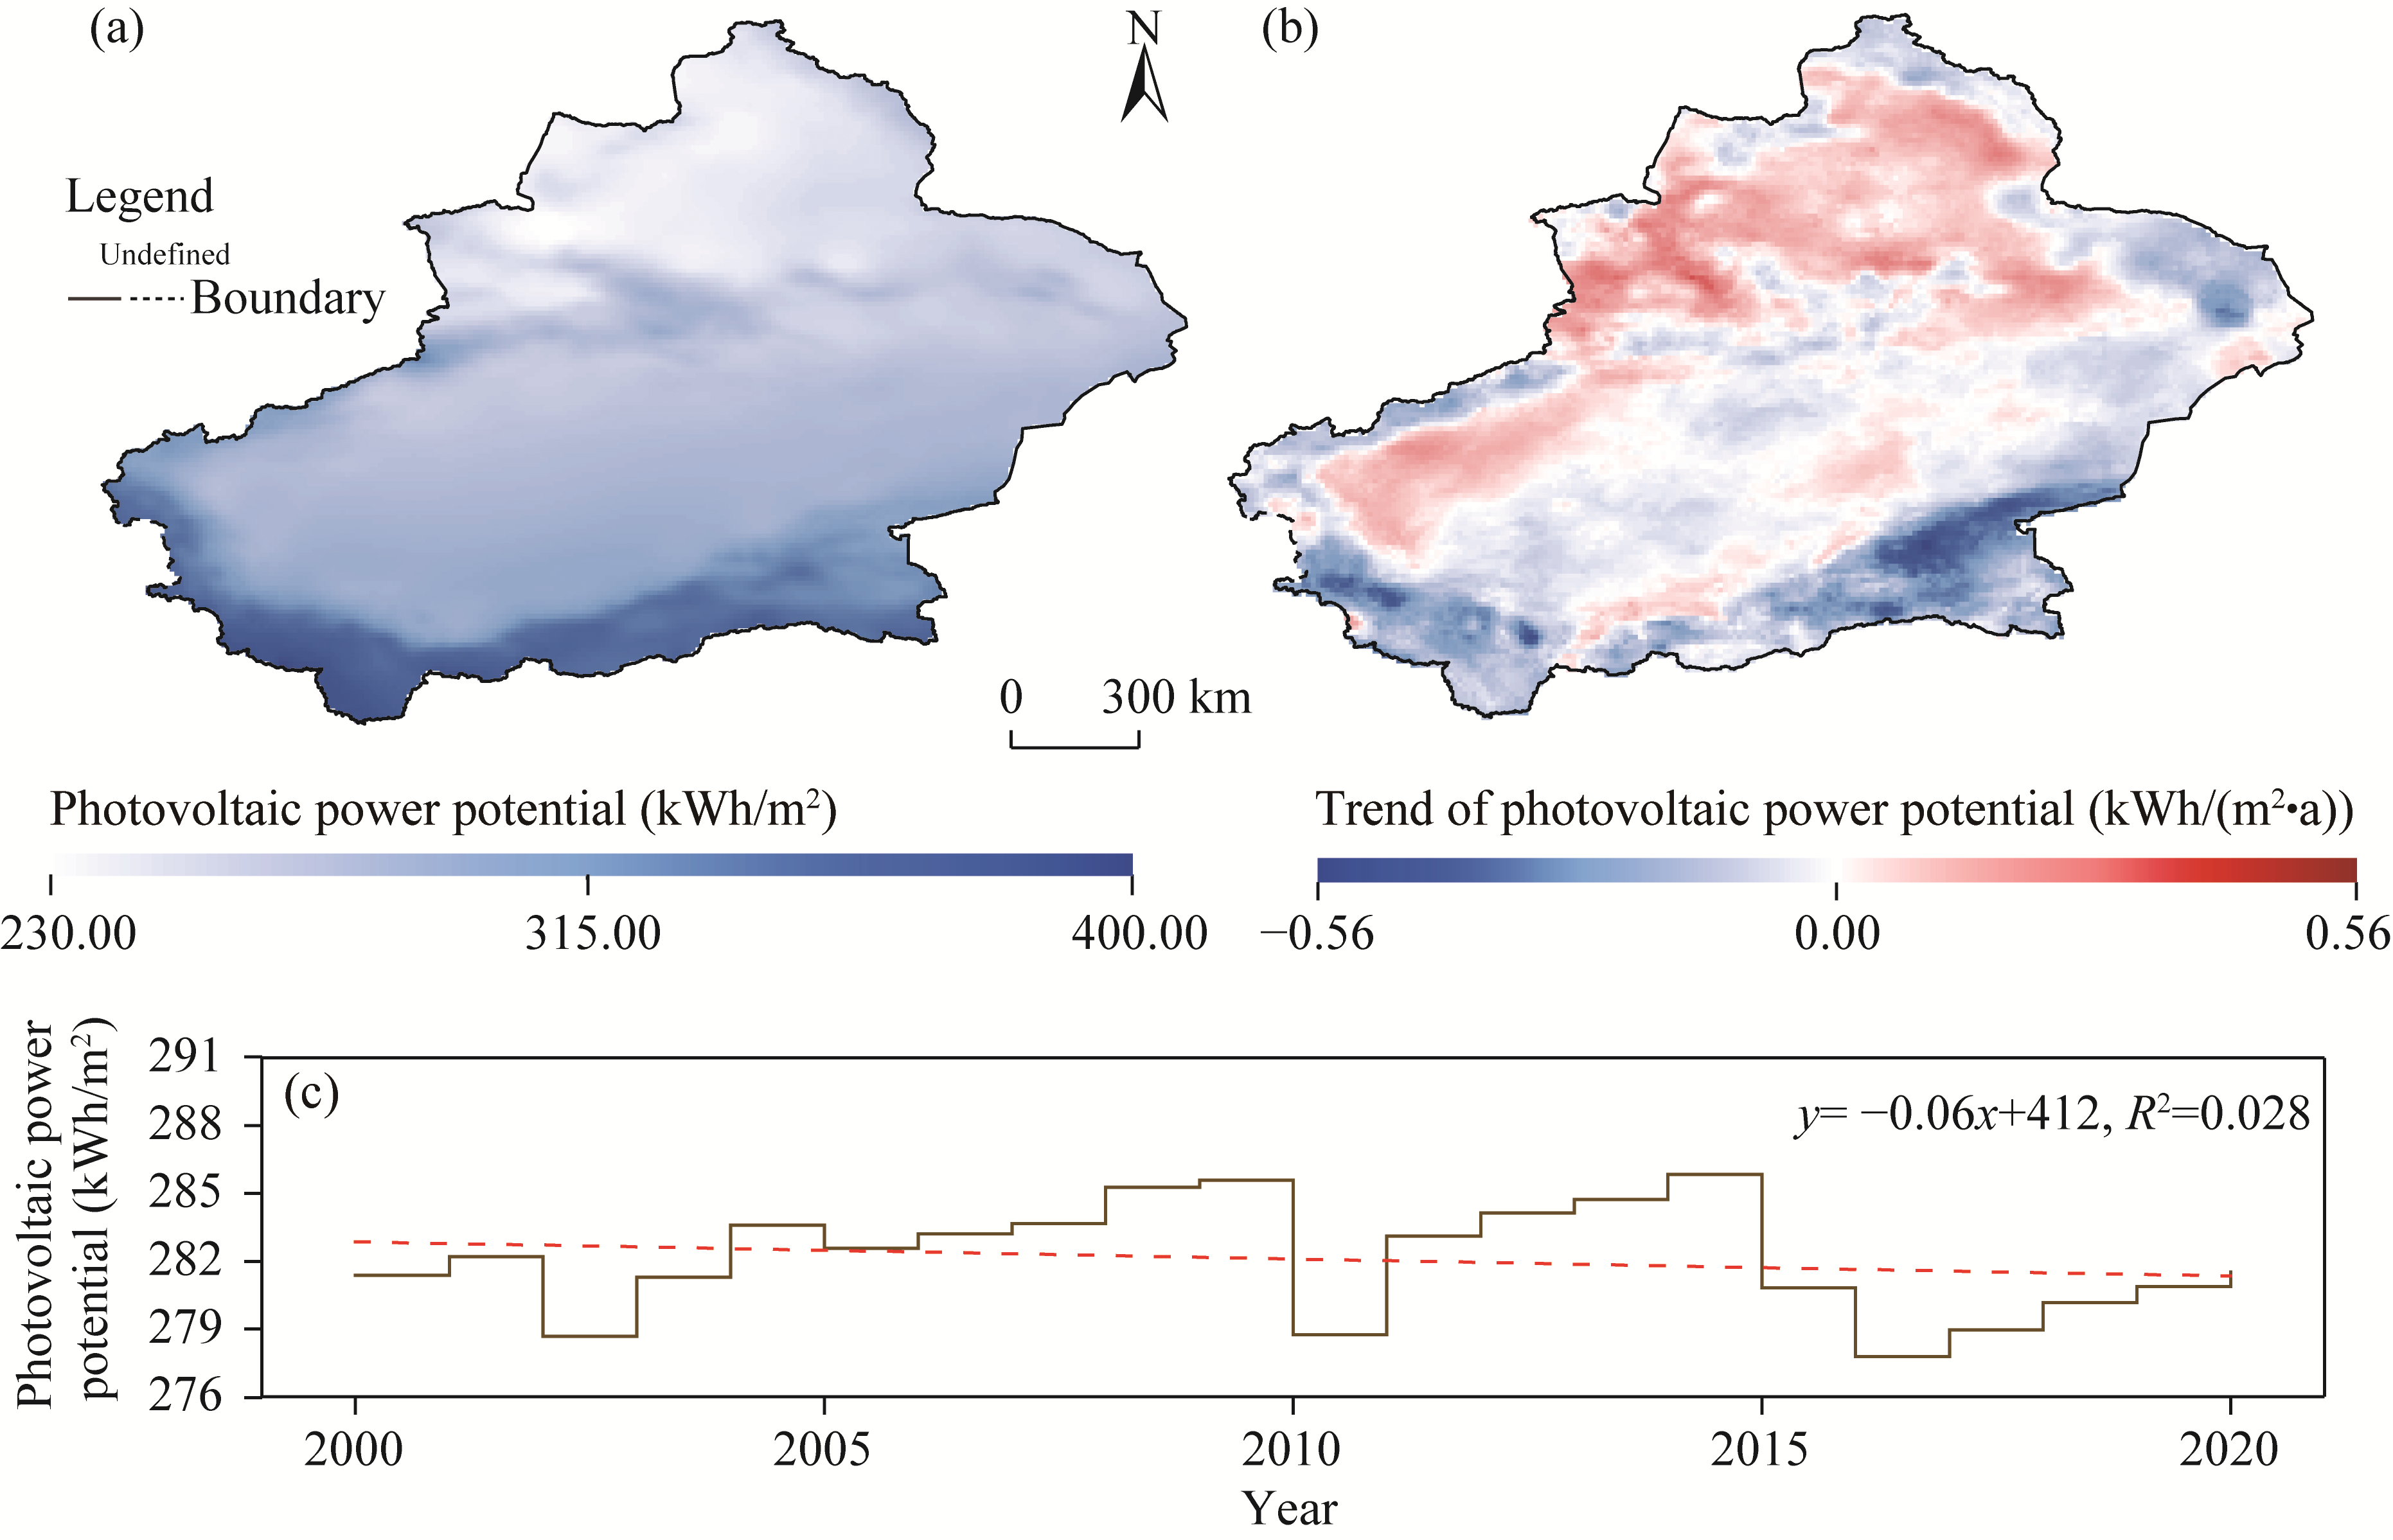
Fig. 7Spatial patterns of the annual average photovoltaic power potential during 2000-2020 (a) and Sen-Mann-Kendall (MK) trend test results (b), and temporal inter-annual variation (c)
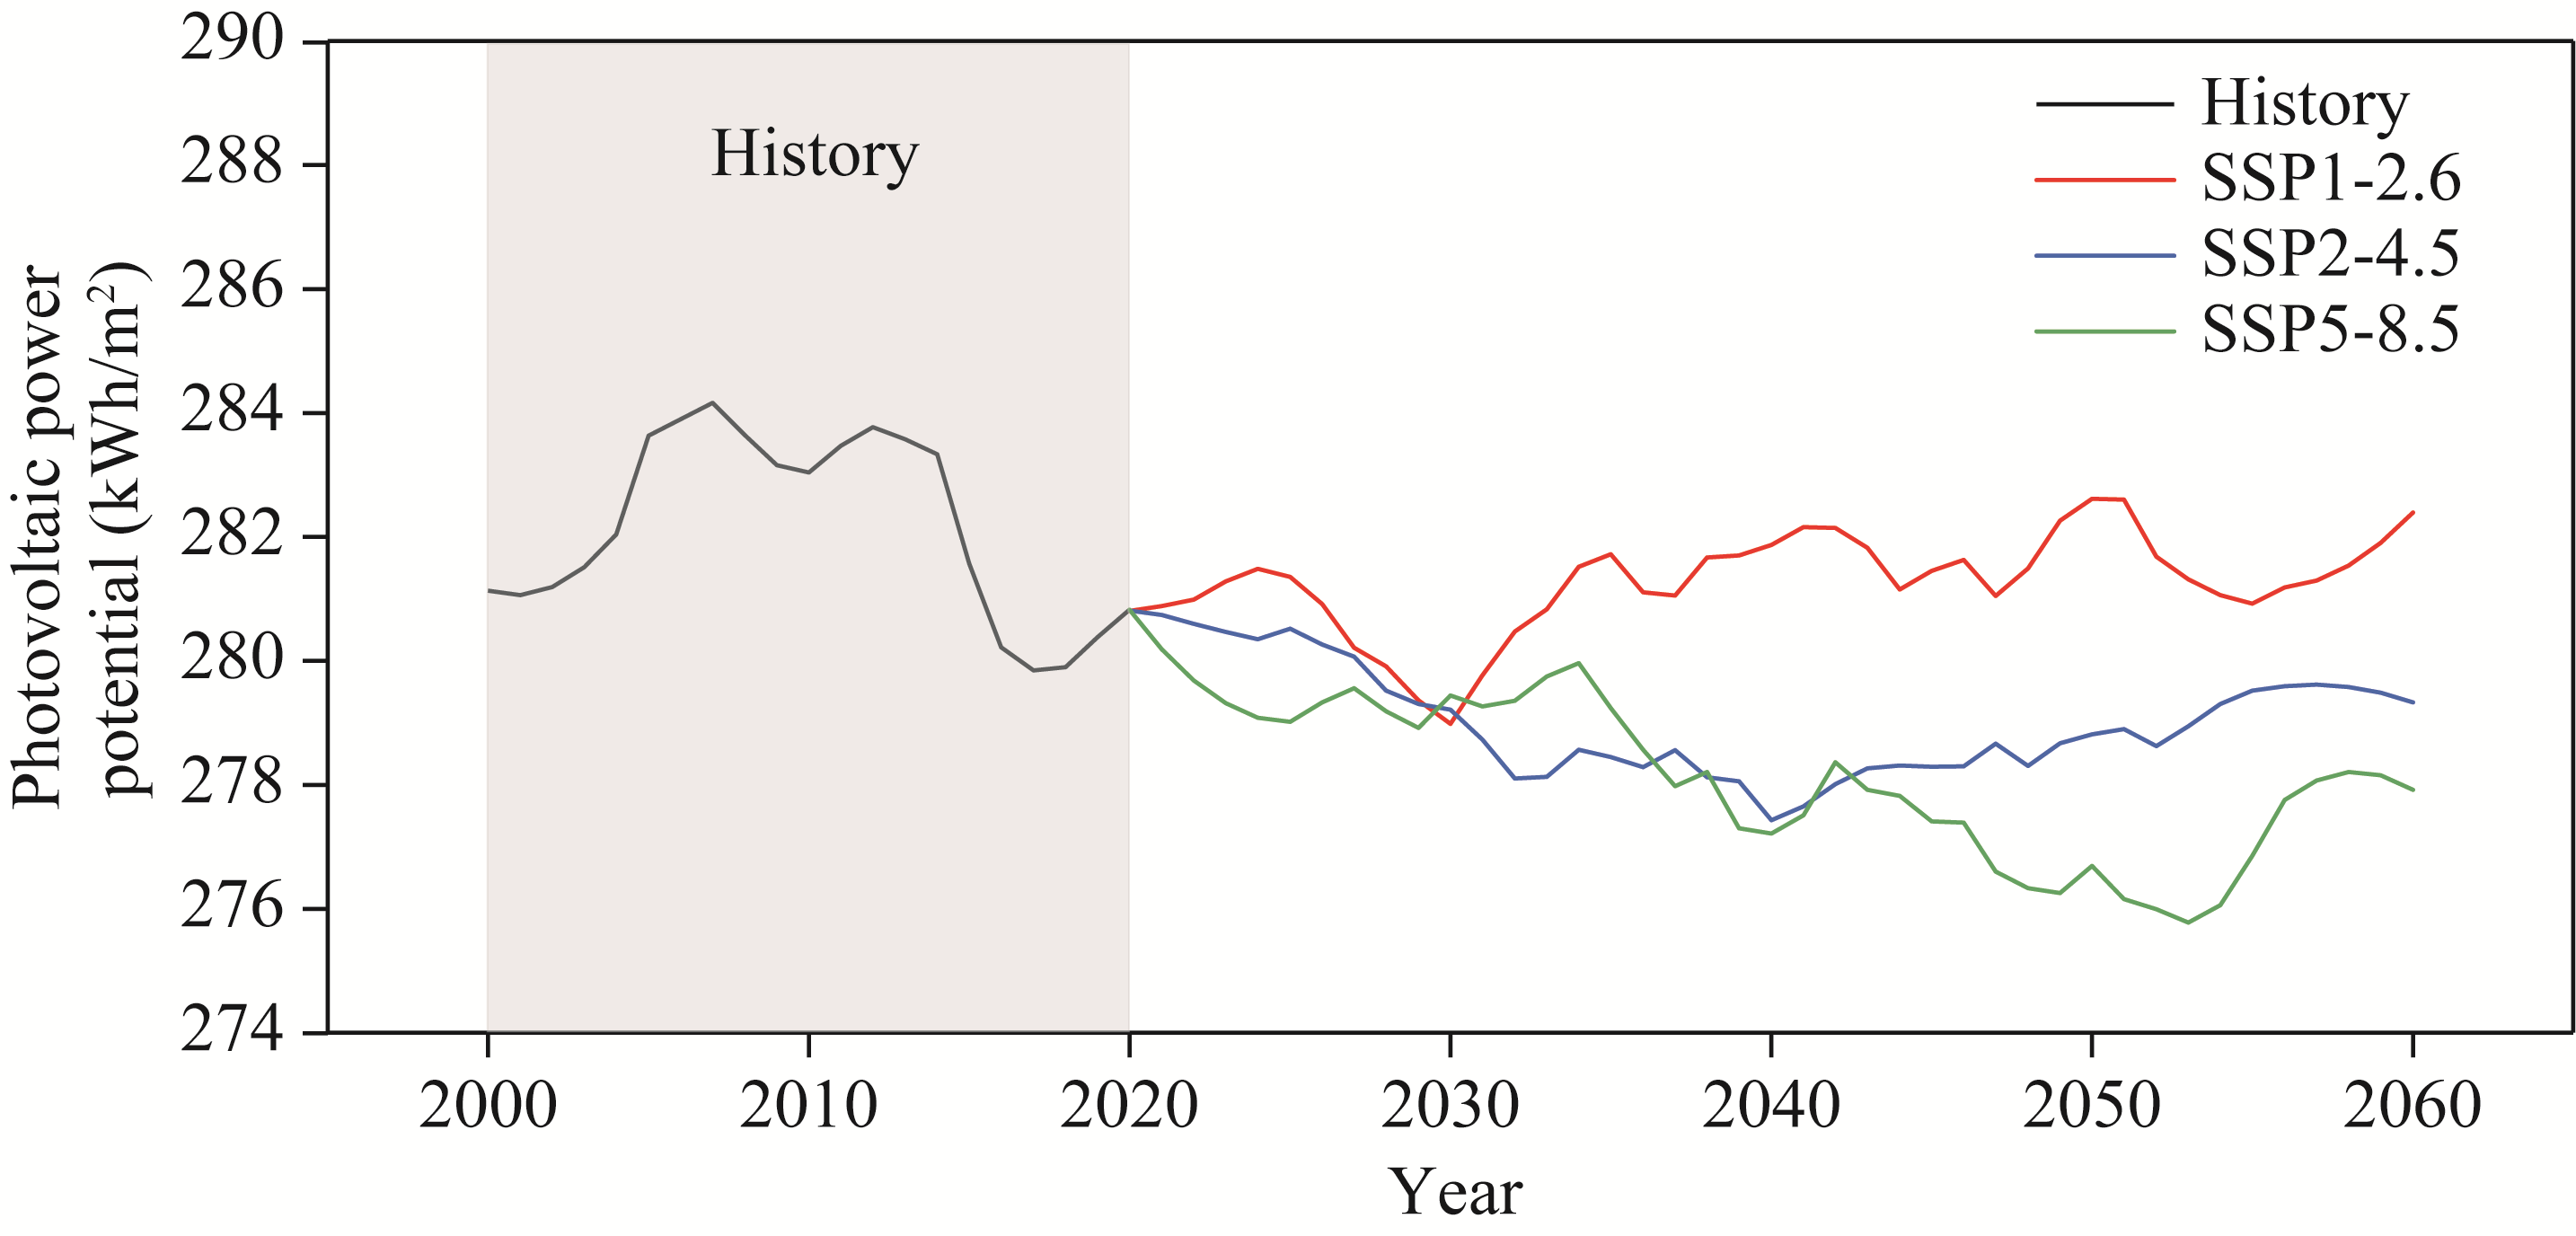
Fig. 8Trends in the photovoltaic power potential in Xinjiang during 2000-2060 under three SSPs
Fig. 9Analysis of the variability of the photovoltaic power potential in Xinjiang during the future carbon-neutral window (2021-2060) under three SSPs. (a-c), absolute change in the annual photovoltaic power potential relative to the historical baseline period (2000-2020); (d-f), relative change normalized by the historical mean from the average difference between 2021-2060 and 2000-2020; (g-i), trend of change in the coefficient of variation (CV); (j-l), Sen-MK spatial trend distribution of photovoltaic power potential during 2021-2060.
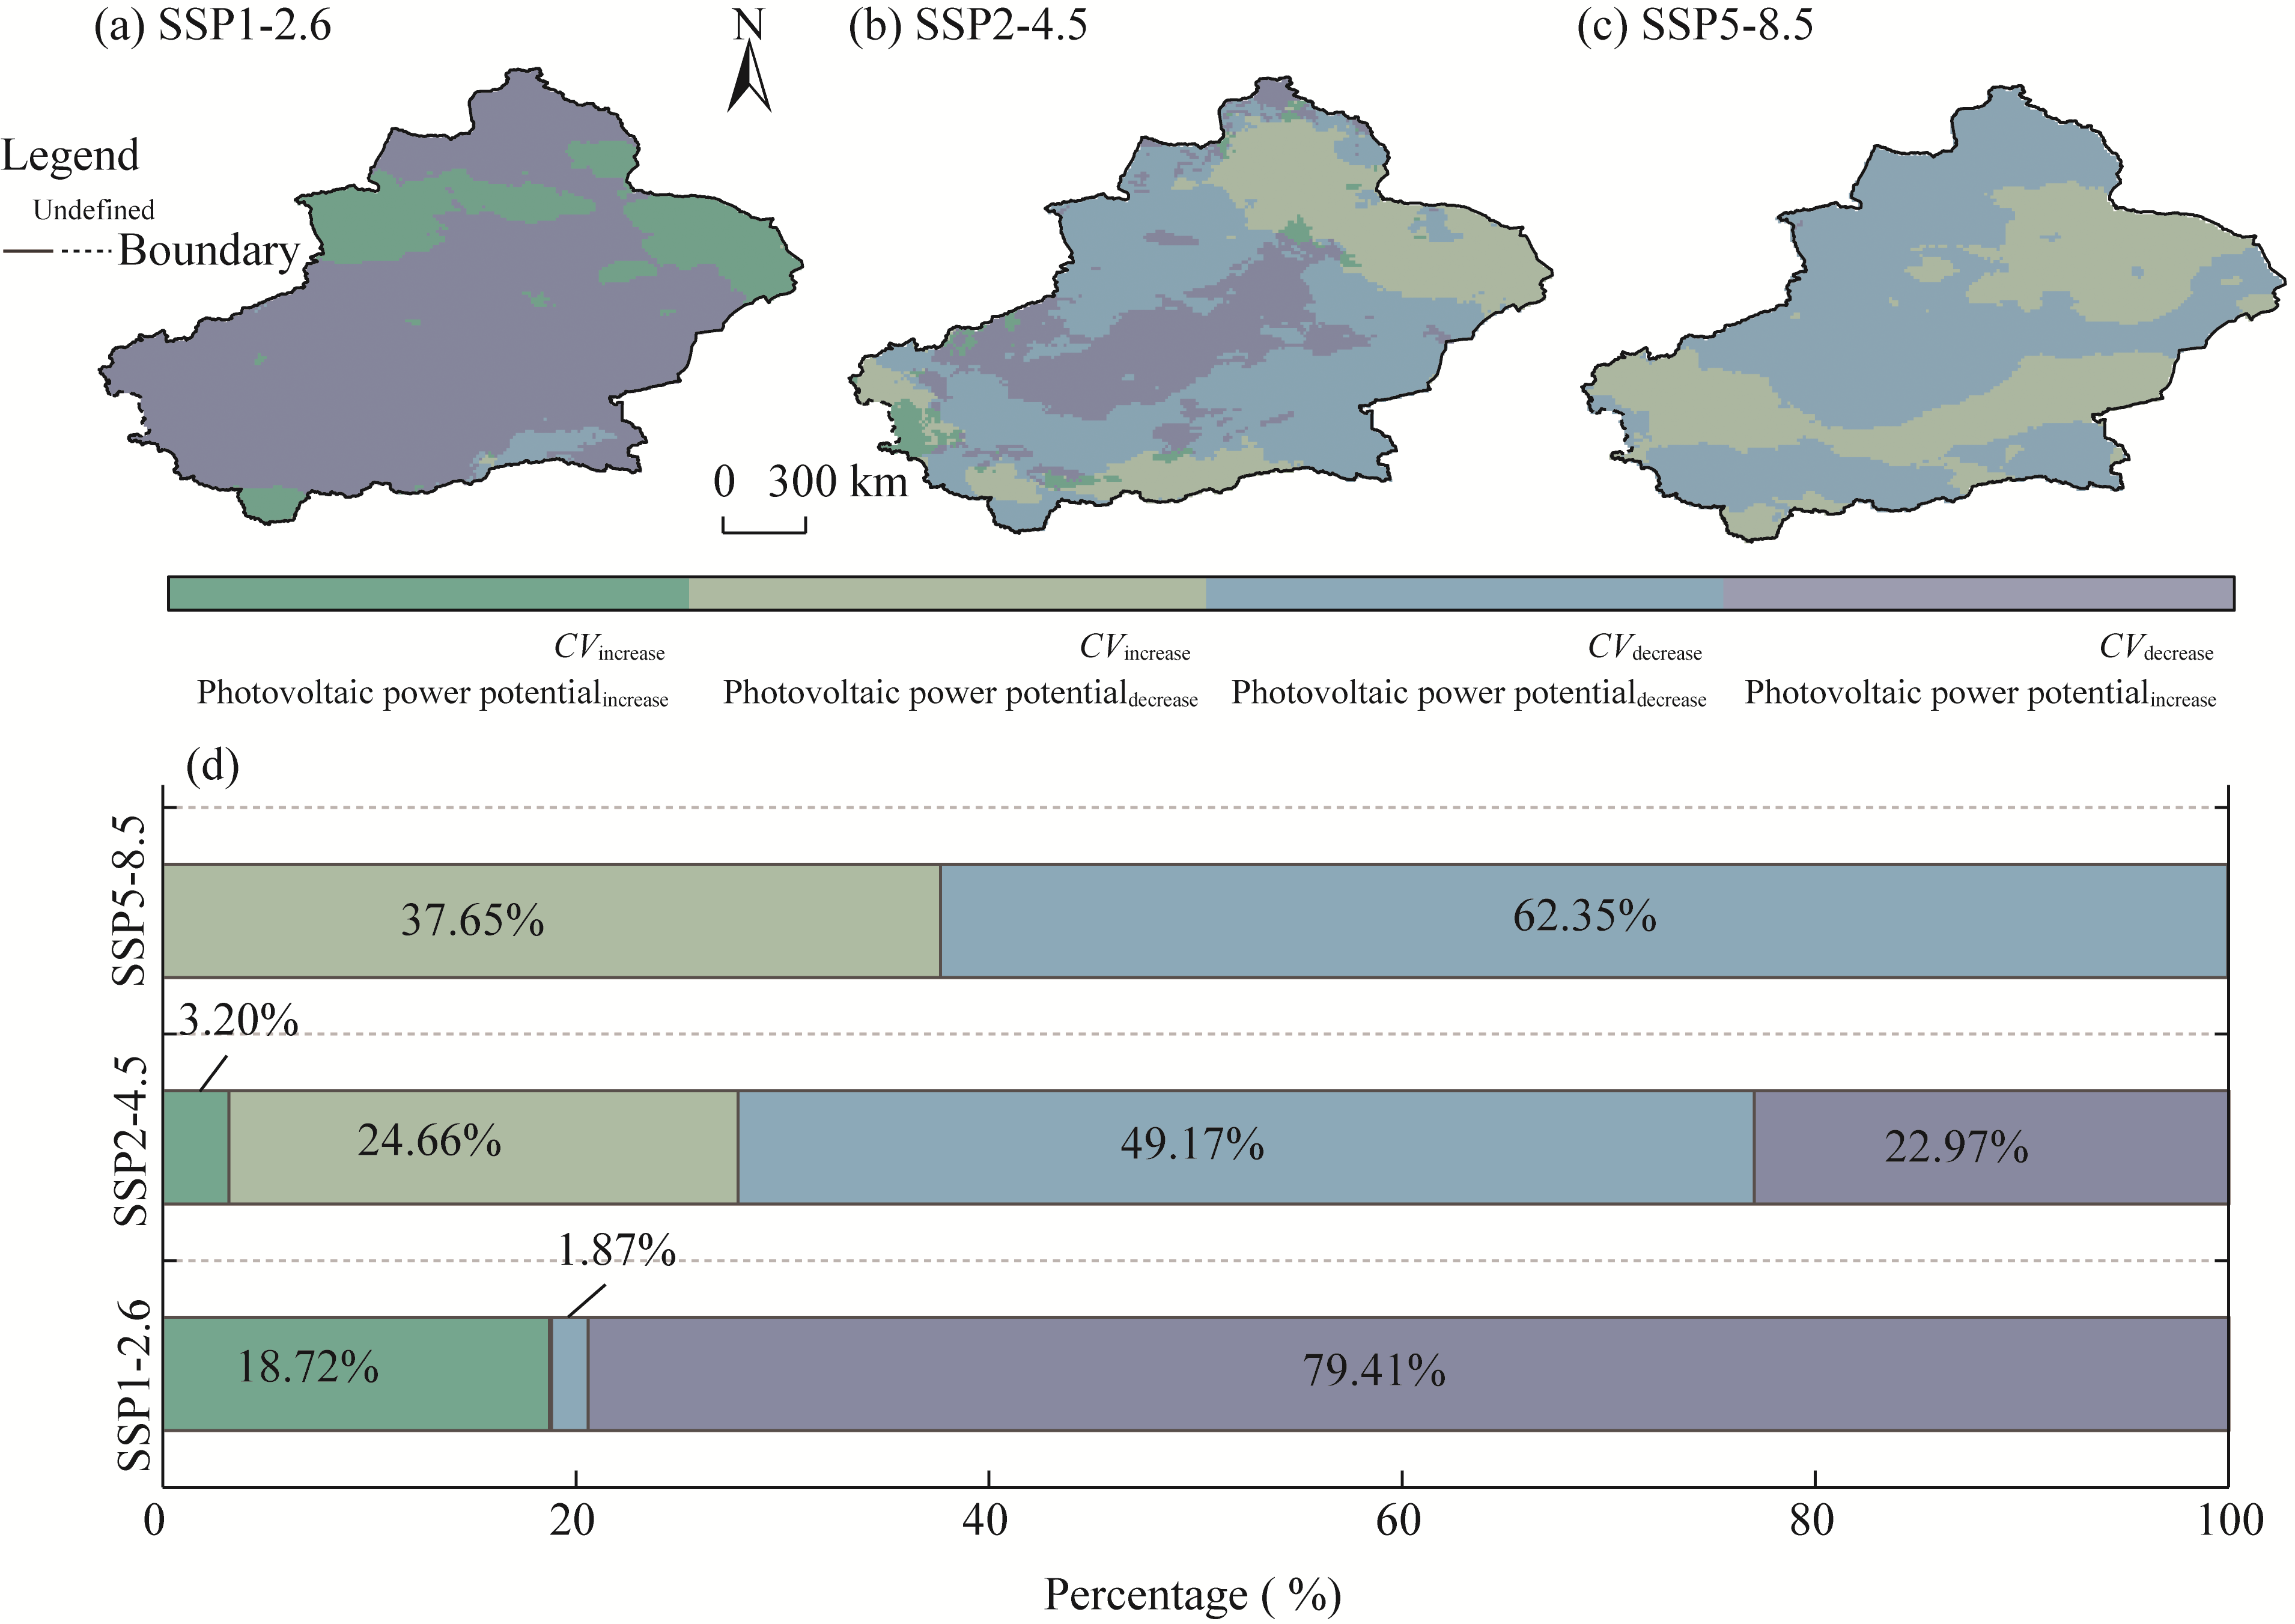
Fig. 10Four combined patterns of photovoltaic and CV trends during 2021-2060 under three SSPs. (a-c), spatial distribution of the four trend combinations; (d), area proportion statistics of the four classified patterns presented by stacked bar charts. Dashed areas represent regions with statistically significant at P<0.05 level.
Fig. 11Spatial patterns of the linear regression coefficients between climatic factors and photovoltaic power potential in Xinjiang. (a-d), RSDS; (e-h), sfcWind; (i-l), TAS. Areas covered with dots indicate statistical significance at P<0.05 level.
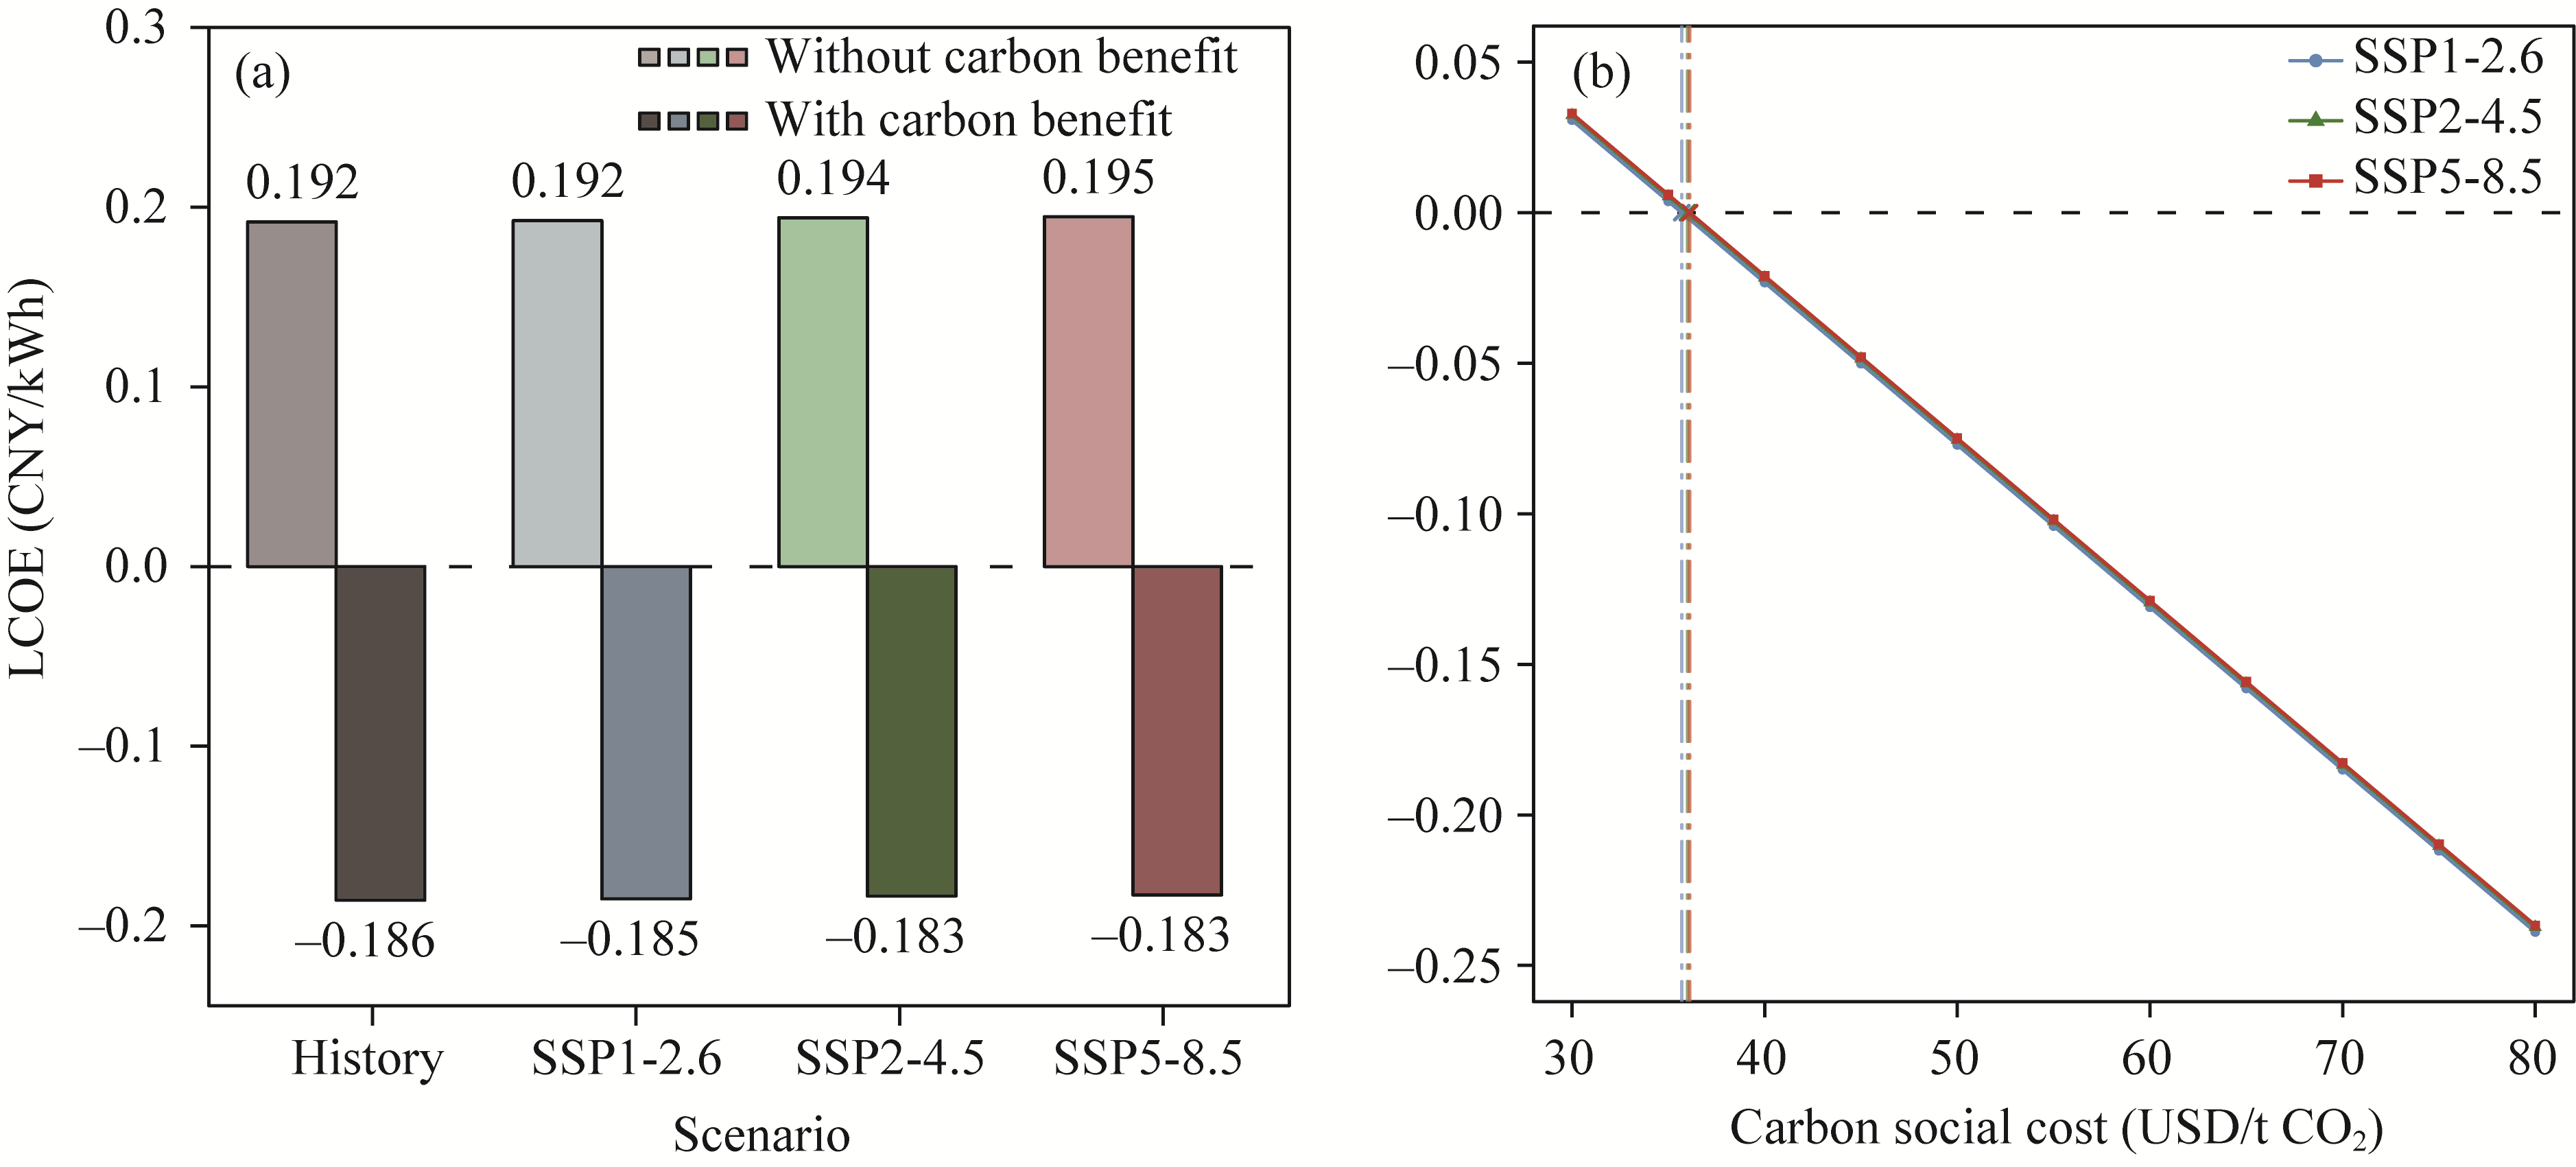
Fig. 12Levelized cost of energy (LCOE) of photovoltaic power potential in Xinjiang under different scenarios. (a), LCOE comparison with and without carbon benefits under a carbon social cost of 70 USD/t CO2; (b), sensitivity of LCOE to carbon social cost across SSP scenarios.
[1]
Abdulfattah I S, Rajab J M, Chaabane M, et al. 2025. Trend analysis of air surface temperature using Mann-Kendall test and Sen's slope estimator in Tunisia. Journal of Agrometeorology, 27(3): 355-359.
doi: 10.54386/jam.v27i3
[2]
Abatzoglou J T, Dobrowski S Z, Parks S A, et al. 2018. TerraClimate, a high-resolution global dataset of monthly climate and climatic water balance from 1958-2015. Scientific Data, 5: 170191, doi: 10.1038/sdata.2017.191.
[3]
Al-Hanoot A K, Mokhlis H, Mekhilef S, et al. 2024. Distributed PV systems in Saudi Arabia: Current status, challenges, and prospects. Energy Strategy Reviews, 55: 101535, doi: 10.1016/j.esr.2024.101535.
[4]
Almhdi E, Miskeen G. 2025. Power and carbon footprint evaluation and optimization in transitioning data centers. Wadi Alshatti University Journal of Pure and Applied Sciences, 3(2): 221-229.
[5]
Alves E F, Polleux L, Guerassimoff G, et al. 2023. Allocation of spinning reserves in autonomous grids considering frequency stability constraints and short-term solar power variations. IEEE Access, 11: 29896-29908.
doi: 10.1109/ACCESS.2023.3261805
[6]
Ashraf A, Sagheer M. 2025. Renewable energy capacity and technological innovations: A review of global trends and future directions. Environmental Progress & Sustainable Energy, 44(6): e70071, doi: 10.1002/ep.70071.
[7]
Bayrakci M, Choi Y, Brownson J R S. 2014. Temperature dependent power modeling of photovoltaics. Energy Procedia, 57: 745-754.
doi: 10.1016/j.egypro.2014.10.282
[8]
Bovik A C. 2009. Basic gray level image processing. In: The Essential Guide to Image Processing. Pittsburgh: Academic Press, 43-68.
[9]
Cao J W, Li X, et al. 2026. Improving the utilization of PV-wind power by thermal, hydro and pumped storage considering the local and cross-regional power demand. Energy, 347: 139919, doi: 10.1016/j.energy.2024.131186.
[10]
Chen Y W, Xu Y, Cheng G T, et al. 2023. Assessment of solar energy potential in China using an ensemble of photovoltaic power models. Science of The Total Environment, 877: 162979, doi: 10.1016/j.scitotenv.2023.162979.
[11]
Cheng L, Zhang F L, Li S Y, et al. 2020. Solar energy potential of urban buildings in 10 cities of China. Energy, 196: 117038, doi: 10.1016/j.energy.2020.117038.
[12]
Crook J, Jones L, Forster P, et al. 2011. Climate change impacts on future photovoltaic and concentrated solar power energy output. Energy and Environmental Science, 4(9): 3101-3109.
doi: 10.1039/c1ee01495a
[13]
Davis M W, Fanney A H, Dougherty B P. 2001. Prediction of building integrated photovoltaic cell temperatures. Journal of Solar Energy Engineering, 123(3): 200-210.
doi: 10.1115/1.1385825
[14]
Ding N, Liu J, Yang J, et al. 2018. Water footprints of energy sources in China: Exploring options to improve water efficiency. Journal of Cleaner Production, 174: 1021-1031.
doi: 10.1016/j.jclepro.2017.10.273
[15]
Doubleday K, Jascourt S, Kleiber W, et al. 2021. Probabilistic solar power forecasting using Bayesian model averaging. IEEE Transactions on Sustainable Energy, 12(1): 325-337.
doi: 10.1109/TSTE.2020.2993524
[16]
El-Khozondar H, El-Khozondar R, Nassar Y, et al. 2025. Economic and environmental implications of solar energy street lighting in urban regions: A case study. Wadi Alshatti University Journal of Pure and Applied Sciences, 3(1): 142-151.
[17]
Fan S Y, He M Y, Zhang Z H. 2023. Daily prediction method of dust accumulation on photovoltaic (PV) panels using echo state network with delay output. Applied Soft Computing, 144: 110528, doi: 10.1016/j.asoc.2023.110528.
[18]
Feng Y, Zhang X L, Jia Y, et al. 2021. High-resolution assessment of solar radiation and energy potential in China. Energy Conversion and Management, 240: 114265, doi: 10.1016/j.enconman.2021.114265.
[19]
Feron S, Cordero R R, Damiani A, et al. 2020. Climate change extremes and photovoltaic power output. Nature Sustainability, 4(3): 270-276.
doi: 10.1038/s41893-020-00643-w
[20]
Gribbon K T, Bailey D G. 2004. A novel approach to real-time bilinear interpolation. In: Proceedings of the Second IEEE International Workshop on Electronic Design, Test and Applications (DELTA 2004). [ 2025-10-12]. https://www-ist.massey.ac.nz/dbailey/sprg/pdfs/2004_DELTA_126.pdf.
[21]
Gu C L, Huang A N, Li X, et al. 2024. Offline correction of CMIP6 HighResMIP simulated surface solar irradiance with 3D sub-grid terrain radiative effects. Geophysical Research Letters, 51(10): e2023GL107737, doi: 10.1029/2023GL107737.
[22]
He J M, Hong L, Shao C K, et al. 2023. Global evaluation of simulated surface shortwave radiation in CMIP6 models. Atmospheric Research, 292: 106896, doi: 10.1016/j.atmosres.2023.106896.
[23]
Hersbach H, Bell B, Berrisford P, et al. 2020. The ERA 5 global reanalysis. Quarterly Journal of the Royal Meteorological Society, 146(730): 1999-2049.
doi: 10.1002/qj.v146.730
[24]
Hossen M S, Evan R I. 2023. Assessing historical climate trends in Dhaka City: A multivariate analysis using Mann-Kendall and Sen's slope method. International Journal of Climate Research, 7(1): 24-45.
doi: 10.18488/112.v7i1.3452
[25]
Hou C Z, Karnauskas K B, Huang D Q, et al. 2025. Detecting and calibrating large biases in global onshore wind power assessment across temporal scales. Nature Communications, 16: 3775, doi: 10.1038/s41467-025-59195-2.
[26]
Hou W J, Zhang X L, Deng H Y, et al. 2023. Comprehensive regionalization and potential water crisis for solar power development in arid and semi-arid regions of Northwest China. Resources, Conservation and Recycling, 193: 106939, doi: 10.1016/j.resconrec.2023.106939.
[27]
Hua Y P, Wei M B, Yuan J, et al. 2024. The impact of climate change on solar radiation and photovoltaic energy yields in China. Atmosphere, 15(8): 939, doi: 10.3390/atmos15080939.
[28]
Huang Y F, Long Y P, Ma Q M, et al. 2025. A dataset of high-resolution meteorological drought indices under the CMIP6 framework in China (2015-2100). China Scientific Data, 10(3): 1-11. (in Chinese)
[29]
IEA (International Energy Agency). Renewables 2023: Electricity. [2025-08-01].https://www.iea.org/reports/renewables-2023/electricity.
[30]
Inweer M A, Nassar Y F. 2025. Carbon emissions life cycle assessment of cement industry in Libya. Wadi Alshatti University Journal of Pure and Applied Sciences, 3(2): 162-173.
[31]
Iweh C D, Gyamfi S, Tanyi E, et al. 2021. Distributed generation and renewable energy integration into the grid: Prerequisites, push factors, practical options, issues and merits. Energies, 14(17): 5375, doi: 10.3390/en14175375.
[32]
Jin Y B, Hu S J, Ziegler A D, et al. 2023. Energy production and water savings from floating solar photovoltaics on global reservoirs. Nature Sustainability, 6(7): 865-874.
doi: 10.1038/s41893-023-01089-6
[33]
Kan A K, Zeng Y L, Meng X Y, et al. 2021. The linkage between renewable energy potential and sustainable development: Understanding solar energy variability and photovoltaic power potential in Tibet, China. Sustainable Energy Technologies and Assessments, 48: 101551, doi: 10.1016/j.seta.2021.101551.
[34]
Krakauer N Y, Cohan D S. 2017. Interannual variability and seasonal predictability of wind and solar resources. Resources, 6(3): 29, doi: 10.3390/resources6030029.
[35]
Li K X, Zheng F, Zhu J, et al. 2024. Advancing annual global mean surface temperature prediction to 2 months lead using physics based strategy. npj Climate and Atmospheric Science, 7: 219, doi: 10.1038/s41612-024-00554-6.
[36]
Liu C, Chen L, Li K, et al. 2025. Historical and future climate changes impact global solar photovoltaic power potential: Role of key meteorological variables. Atmospheric and Oceanic Science Letters, 18(6): 100619, doi: 10.1016/j.aosl.2025.100619.
[37]
Liu F, Wang X M, Sun F B, et al. 2022. Correct and remap solar radiation and photovoltaic power in China based on machine learning models. Applied Energy, 312: 118775, doi: 10.1016/j.apenergy.2022.118775.
[38]
Liu Z Y, Peng T, Ma S L, et al. 2023. Potential benefits and risks of solar photovoltaic power plants on arid and semi-arid ecosystems: An assessment of soil microbial and plant communities. Frontiers in Microbiology, 14: 1190650, doi: 10.3389/fmicb.2023.1190650.
[39]
Lu N, Yao L, Qin J, et al. 2022. High emission scenario substantially damages China's photovoltaic potential. Geophysical Research Letters, 49(20): e2022GL100068, doi: 10.1029/2022GL100068.
[40]
Lü Y K, Zhao R Y, Zhou Q W, et al. 2024. Investigation on influence of environmental factors on temperature and output characteristics of solar PV modules. Acta Energiae Solaris Sinica, 45(11): 194-203. (in Chinese)
[41]
Luderer G, Madeddu S, Merfort L, et al. 2022. Impact of declining renewable energy costs on electrification in low-emission scenarios. Nature Energy, 7(1): 32-42.
doi: 10.1038/s41560-021-00937-z
[42]
Mallapaty S. 2020. How China could be carbon neutral by mid-century. Nature, 586(7830): 482-483.
doi: 10.1038/d41586-020-02927-9
[43]
Minh N Q, Huong N T T, Khanh P Q, et al. 2024. Impacts of resampling and downscaling digital elevation model and its morphometric factors: a comparison of hopfield neural network, bilinear, bicubic, and kriging interpolations. Remote Sensing, 16(5): 819, doi: 10.3390/rs16050819.
[44]
Mora Segado P, Carretero J, Sidrach-de-Cardona M. 2015. Models to predict the operating temperature of different photovoltaic modules in outdoor conditions. Progress in Photovoltaics: Research and Applications, 23(10): 1267-1282.
doi: 10.1002/pip.v23.10
[45]
Muñoz-Sabater J, Dutra E, Agustí-Panareda A, et al. 2021. ERA5-Land: A state-of-the-art global reanalysis dataset for land applications. Earth System Science Data, 13(9): 4349-4383.
doi: 10.5194/essd-13-4349-2021
[46]
NCSC (National Center for Climate Change Strategy and International Cooperation). 2023. 2020 Baseline Emission Factors for China's Regional Power Grids for Emission Reduction Projects. [2025-09-18].https://finance.sina.com.cn/esg/2023-11-18/doc-imzvafie4226730.shtml. (in Chinese) (in Chinese)
[47]
O'Neill B C, Tebaldi C, van Vuuren D P, et al. 2016. The scenario model intercomparison project (ScenarioMIP) for CMIP6. Geoscientific Model Development, 9(9): 3461-3482.
doi: 10.5194/gmd-9-3461-2016
[58]
Papaefthymiou G, Dragoon K. 2016. Towards 100% renewable energy systems: Uncapping power system flexibility. Energy Policy, 92: 69-82.
doi: 10.1016/j.enpol.2016.01.025
[49]
Pérez J C, González A, Díaz J P, et al. 2019. Climate change impact on future photovoltaic resource potential in an orographically complex archipelago, the Canary Islands. Renewable Energy, 133: 749-759.
doi: 10.1016/j.renene.2018.10.077
[50]
Peters I M, Buonassisi T. 2019. The impact of global warming on silicon PV energy yield in 2100. In: 2019 IEEE 46th Photovoltaic Specialists Conference (PVSC). Institute of Electrical and Electronics Engineers (IEEE). Chicago, USA.
[51]
Piao J L, Chen W, Wang L, et al. 2022. Future projections of precipitation, surface temperatures and drought events over the monsoon transitional zone in China from bias-corrected CMIP6 models. International Journal of Climatology, 42(2): 1203-1219.
doi: 10.1002/joc.v42.2
[52]
Qu Z, Jiang C, Wang Y X, et al. 2024. China's photovoltaic development and its spillover effects on carbon footprint at cross-regional scale: Insights from the largest photovoltaic industry in northwest arid area. Sustainability, 16(22): 9922, doi: 10.3390/su16229922.
[53]
Quan Y F, Duan M S, Luo C J. 2025. Measuring implicit carbon prices of renewable energy incentives: Insights from China. Energy for Sustainable Development, 85: 101656, doi: 10.1016/j.esd.2025.05.003.
[54]
Saxena A, Brown C, Arneth A, et al. 2023. Modelling the global photovoltaic potential on land and its sensitivity to climate change. Environmental Research Letters, 18(10): 104017, doi: 10.1088/1748-9326/acf878.
[55]
Shafiei K, Zadeh S G, Hagh M T. 2024. Planning for a network system with renewable resources and battery energy storage, focused on enhancing resilience. Journal of Energy Storage, 87: 111339, doi: 10.1016/j.est.2024.111339.
[56]
Soler-Castillo Y, Rimada J C, Hernández L, et al. 2021. Modelling of the efficiency of the photovoltaic modules: Grid-connected plants to the Cuban national electrical system. Solar Energy, 223: 150-157.
doi: 10.1016/j.solener.2021.05.052
[57]
Sun J B, Cui W R, Wang W H, et al. 2025. The microclimatic and ecohydrological effects of photovoltaic facilities in arid/semi-arid regions of China: An integrated modeling study. Journal of Environmental Management, 382: 125395, doi: 10.1016/j.jenvman.2025.125395.
[58]
Sweerts B, Pfenninger S, Yang S, et al. 2019. Estimation of losses in solar energy production from air pollution in China since 1960 using surface radiation data. Nature Energy, 4(8): 657-663.
doi: 10.1038/s41560-019-0412-4
[59]
Teutschbein C, Seibert J. 2012. Bias correction of regional climate model simulations for hydrological climate-change impact studies: Review and evaluation of different methods. Journal of hydrology, 456: 12-29.
[60]
van Ruijven B J, de Cian E, Sue Wing I. 2019. Amplification of future energy demand growth due to climate change. Nature Communications, 10(1): 2762, doi: 10.1038/s41467-019-10631-0.
[61]
Wang F H, Xia Y. 2025. Spatiotemporal evolution patterns and influencing factors of major crop production in arid areas: A case study of Xinjiang, China. Arid Land Geography, 48(3): 444-454. (in Chinese)
[62]
Wang Y J, Wang R, Tanaka K, et al. 2023. Accelerating the energy transition towards photovoltaic and wind in China. Nature, 619: 761-767.
doi: 10.1038/s41586-023-06180-8
[63]
Wang Y Q, Yang X L, Zhang M R, et al. 2019. Projected effects of climate change on future hydrological regimes in the Upper Yangtze River Basin, China. Advances in Meteorology, 2019: 1545746, doi: 10.1155/2019/1545746.
[64]
Wu C, Zhang X P, Sterling M. 2022. Solar power generation intermittency and aggregation. Scientific Reports, 11(1): 1363, doi: 10.1038/s41598-022-05247-2.
[65]
Xiang Y Y, Wang Y, Chen Y N, et al. 2021. Impact of climate change on the hydrological regime of the Yarkant River Basin, China: An assessment using three SSP scenarios of CMIP6 GCMs. Remote Sensing, 14(1): 115, doi: 10.3390/rs14010115.
[66]
Yao J Q, Mao W Y, Chen J, et al. 2021. Signal and impact of wet-to-dry shift over Xinjiang, China. Acta Geographica Sinica, 76(1): 57-72. (in Chinese)
doi: 10.11821/dlxb202101005
[67]
Zhang X L, Zhou B T, Wang X X, et al. 2025. Anthropogenic influence has intensified the severity of summer compound hot and drought events over Xinjiang, China. Weather and Climate Extremes, 48: 100774, doi: 10.1016/j.wace.2025.100774.
[68]
Zhao X L. 2025. Carbon pricing policies trade-offs between environment and economics. Applied Energy, 401: 126822, doi: 10.1016/j.apenergy.2025.126822.
[69]
Zhou J Y, Lu H, Yang K, et al. 2023. Projection of China's future runoff based on the CMIP6 mid-high warming scenarios. Science China Earth Sciences, 66(3): 528-546.
doi: 10.1007/s11430-022-1055-5
[70]
Zhu X R, Tian J H, Wang Y. 2025. The impact of climate change on wind and solar photovoltaic power potential and distribution in China. Advances in Climate Change Research, 16(4): 730-746.
doi: 10.1016/j.accre.2025.04.015
[71]
Zorzetto E, Malyshev S, Chaney N, et al. 2023. Effects of complex terrain on the shortwave radiative balance: A sub-grid-scale parameterization for the GFDL Earth System Model version 4.1. Geoscientific Model Development, 16(7): 1937-1960.
doi: 10.5194/gmd-16-1937-2023
[72]
Zou L, Wang L C, Li J R, et al. 2019. Global surface solar radiation and photovoltaic power from Coupled Model Intercomparison Project Phase 5 climate models. Journal of Cleaner Production, 224: 304-324.
doi: 10.1016/j.jclepro.2019.03.268