Spatial variability and temporal stability of actual evapotranspiration on a hillslope of the Chinese Loess Plateau
ZHANG Yongkun1, HUANG Mingbin2,*()
1State Key Laboratory of Plateau Ecology and Agriculture, Qinghai University, Xining 810016, China 2Institute of Soil and Water Conservation, Northwest Agriculture and Forestry University, Yangling 712100, China
Actual evapotranspiration (ETa) is a key component of water balance. This study aimed to investigate the spatial variability and time stability of ETa along a hillslope and to analyze the key factors that control the spatiotemporal variability of ETa. The potential evaporation, surface runoff and 0-480 cm soil water profile were measured along a 243 m long transect on a hillslope of the Loess Plateau during the normal (2015) and wet (2016) water years. ETa was calculated using water balance equation. Results indicated that increasing precipitation during the wet water year did not alter the spatial pattern of ETa along the hillslope; time stability analysis showed that a location with high time stability of ETa could be used to estimate the mean ETa of the hillslope. Time stability of ETa was positively correlated with elevation (P<0.05), indicating that, on a hillslope in a semi-arid area, elevation was the primary factor influencing the time stability of ETa.
Received: 09 September 2019
Published: 10 March 2021
ZHANG Yongkun, HUANG Mingbin. Spatial variability and temporal stability of actual evapotranspiration on a hillslope of the Chinese Loess Plateau. Journal of Arid Land, 2021, 13(2): 189-204.
Fig. 1Sampling sites in (a) Liudaogou watershed and (b) layout of 38 soil water content monitoring locations spaced at 5 m intervals on a hillslope. Surface runoff experimental plots and evaporation pans at the upper (sampling site, 1-13), middle (sampling site, 14-27), and lower (sampling site, 28-38) slope positions.
Property
Soil profile (cm)
Statistical parameter
Slop position
Upper
Middle
Lower
ELE (m)
Max
1170
1151
1140
Min
1152
1141
1131
Mean±SD
1159±4.72a
1146±3.83b
1136±3.13c
Slope (°)
Max
24.32
16.56
9.21
Min
34.10
25.43
16.23
Mean±SD
27.69±2.90a
22.69±3.09b
12.12±2.07c
Ks (cm/h)
0-30
Max
6.20
7.66
6.31
Min
1.57
1.97
0.89
Mean±SD
3.00±1.52a
3.76±1.78b
2.52±1.65a
BD (g/cm3)
0-30
Max
1.61
1.73
1.74
Min
1.25
1.32
1.13
Mean±SD
1.39±0.09a
1.48±0.1a
1.53±0.11a
LAIm (m2/m2)
Max
1.86
2.32
2.96
Min
0.62
0.61
0.55
Mean±SD
1.13±0.33a
1.56±0.22b
1.47±0.25b
Clay (%)
0-200
Max
16.62
16.26
16.80
Min
9.42
12.33
5.46
Mean±SD
13.56±2.24a
14.70±1.2a
12.97±3.15a
Silt (%)
0-200
Max
40.33
41.71
42.44
Min
26.55
31.58
15.59
Mean±SD
35.26±4.94a
37.20±2.89a
31.57±7.28a
Sand (%)
0-200
Max
64.02
55.65
78.95
Min
43.32
42.69
40.76
Mean±SD
51.19±7.01a
48.10±4.00a
55.46±10.38a
Table 1 Soil properties, topographic attributes, and vegetation features at different slope positions along the hillslope
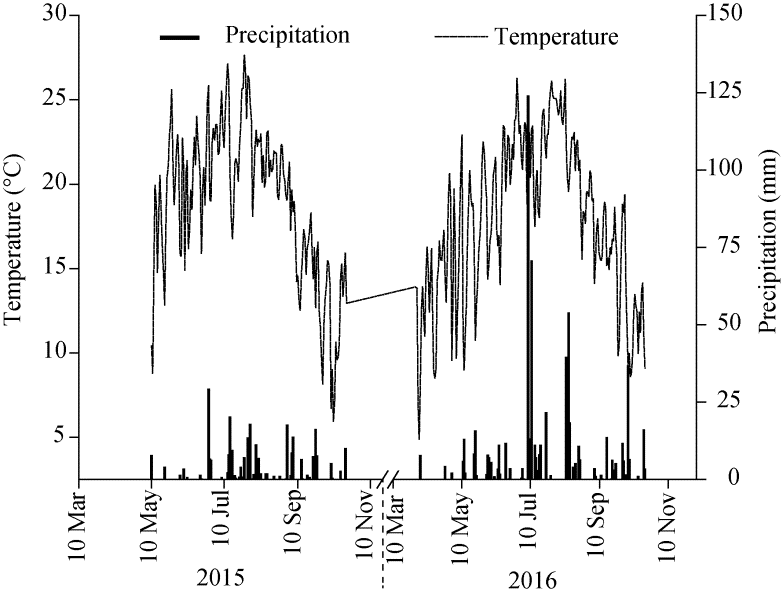
Fig. 2Distributions of daily precipitation and temperature in the study area during the observation period in 2015 and 2016
Fig. 3Comparisons of potential evapotranspiration (PET) values respectively calculated by evaporation pan and penman equation at the upper slope position on the hillslope
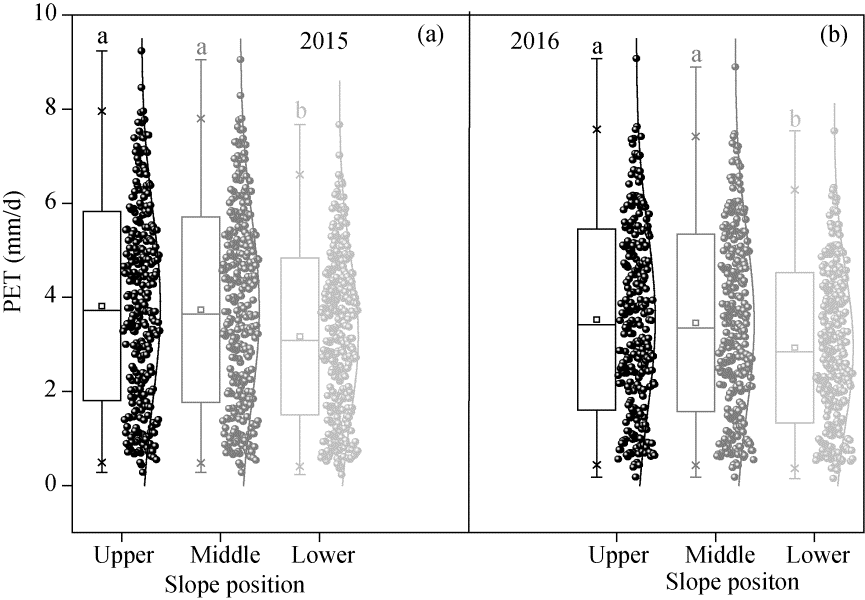
Fig. 4Daily potential evapotranspiration (PET) at the upper, middle, and lower slope positions during the normal (2015, a) and wet (2016, b) water years. Vertical bars represent standard deviations, the same lowercase letters labelled over the boxes indicate no significant difference at P<0.05 level.
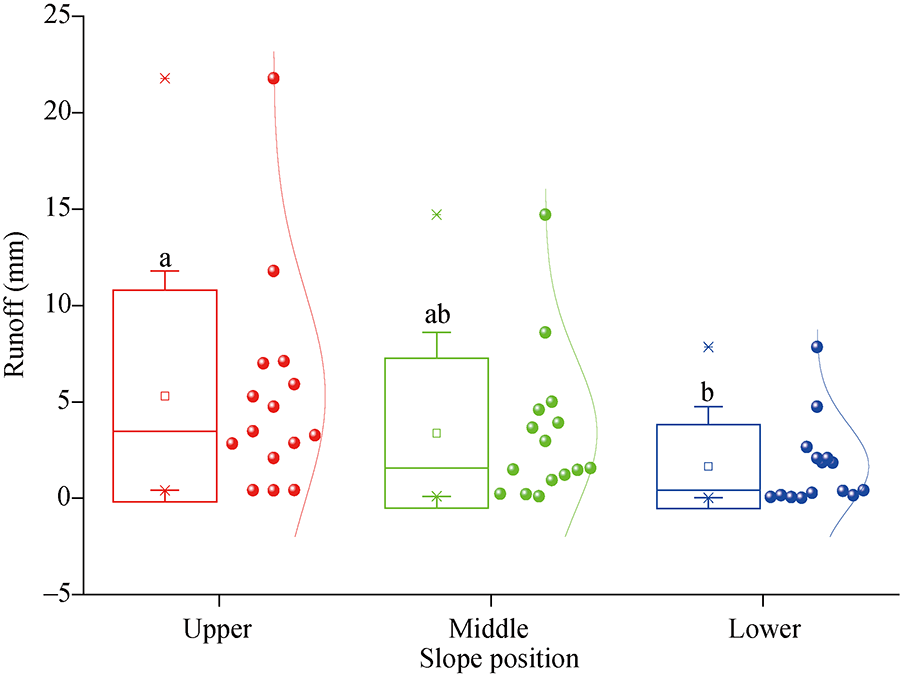
Fig. 5Variations in surface runoff depth at different slope positions in 2015 and 2016. Vertical bars represent standard deviations, the same lowercase letters labelled over the boxes indicate no significant difference at P<0.05 level.
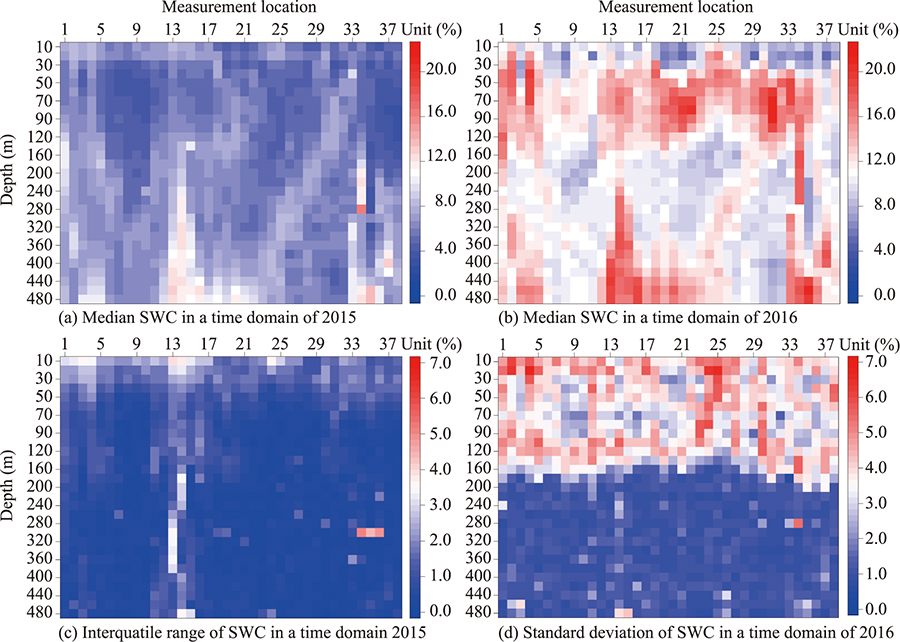
Fig. 6Median and interquartile ranges of soil water content (SWC) in the time domains of 2015 (a and c) and 2016 (b and d) for various depths and sampling locations
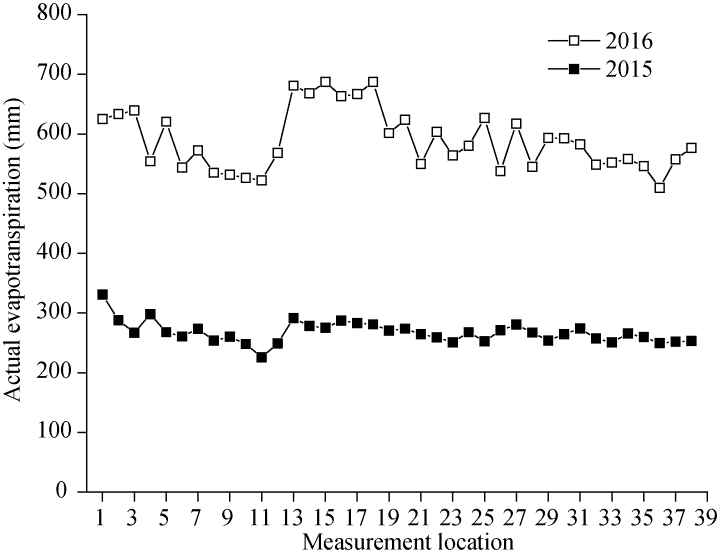
Fig. 7Variations in accumulated actual evapotranspiration (ETa) in each sampling location along the hillslope during normal (2015) and wet (2016) water years
Parameter
Maximum
Minimum
Mean
SD
Kurtosis
Skewness
MRD (%)
43.12
-20.92
0.00
15.86
1.373
1.265
SDRD (%)
113.40
21.44
42.10
20.24
5.061
2.131
ITS (%)
121.32
22.10
44.32
21.54
5.738
2.287
Table 2 Descriptive statistics of MRD, SDRD, and ITS values in ETa in each sampling location along the hillslope
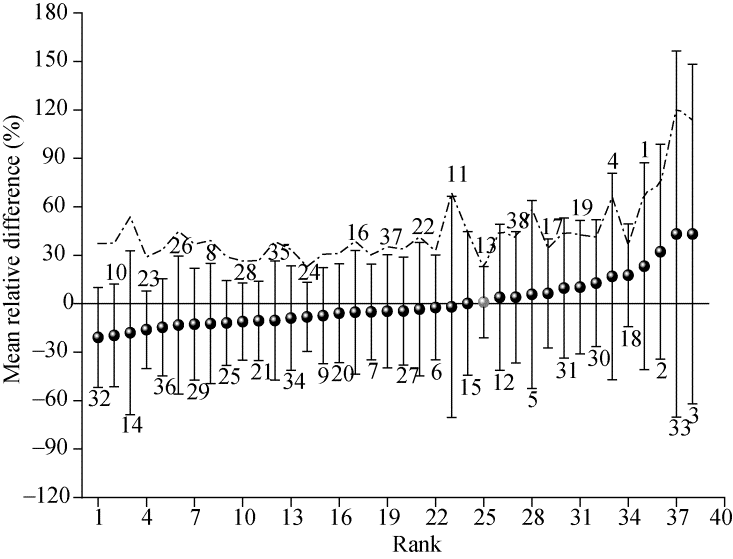
Fig. 8Ranked mean relative difference (MRD) of actual evapotranspiration (ETa) and the index of time stability (ITS) for each monitoring location on the hillslope. Vertical bars represent ±1 standard deviation of relative difference (SDRD). The dashed curve indicates ITS, and the most time stable location (MTSL) with the lowest ITS values is marked in grey.
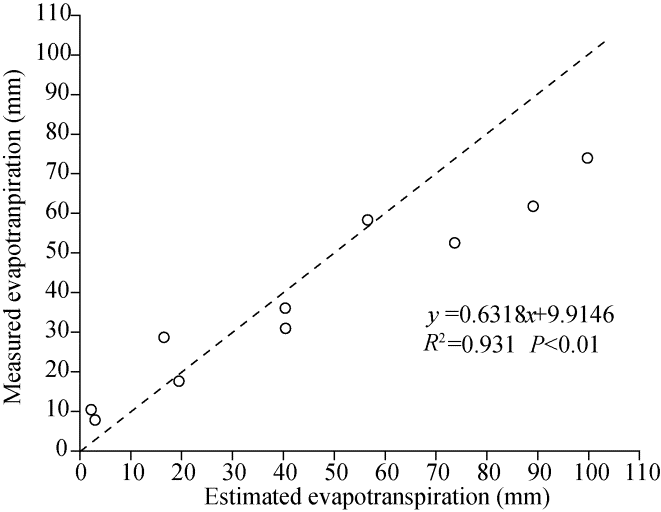
Fig. 9Predicted versus measured ETa on the hillslope. The dashed line is the 1:1 line.
MRD
SDRD
ITS
BD
Ks
ELE
LAIm
SWS
SCC
PMCC
MRD
1.000
SDRD
0.787**
1.000
ITS
0.784**
0.996**
1.000
BD
0.066
-0.055
-0.041
1.000
Ks
0.240
0.324*
0.308
0.187
1.000
ELE
0.375*
0.335*
0.331*
-0.543**
0.007
1.000
LAIm
-0.306
-0.309
-0.308
0.426**
0.191
-0.698**
1.000
SWS
0.504**
0.316
0.312
0.029
0.165
0.150
-0.099
1.000
SCC
0.140
0.022
0.032
-0.502**
-0.057
0.466**
-0.316
0.265
1.000
PMCC
0.322*
0.015
0.011
0.239
0.328*
-0.070
0.081
0.370*
0.217
1.000
Table 3 Matrix of Spearman rank correlation coefficients for factors influencing the mean relative difference (MRD), standard deviation of relative difference (SDRD) and index of time stability (ITS) of actual evapotranspiration (ETa)
Parameter
Tmax (°C)
Tmin (°C)
Rs (MJ/m2)
Ws (m/s)
Td (°C)
PET
Pearson correlation
0.816**
0.700**
0.890**
0.185**
0.429**
Sig. (2-tailed)
0.000
0.000
0.000
0.000
0.000
N
1025
1025
1025
1025
1025
Table 4 Matrix of Spearman rank correlation coefficients between potential evapotranspiration (PET) and five climatic factors
[1]
Baker J M. 1990. Measurement of soil water content. Remote Sensing Reviews, 5(1):263-279.
[2]
Bo X, Wang Q H, Fan J, et al. 2011. Application of the SCS-CN model to runoff estimation in a small watershed with high spatial heterogeneity. Pedosphere, 21(6):738-749.
[3]
Bromley J, Brouwer J, Barker A, et al. 1997. The role of surface water redistribution in an area of patterned vegetation in a semi-arid environment, south-west Niger. Journal of Hydrology, 198(1-4):1-29.
[4]
Carey S K, Woo M. 2001. Spatial variability of hillslope water balance, wolf creek basin, subarctic yukon. Hydrological Process, 15(16):3113-3132.
[5]
Chen H S, Shao M G, Li Y Y. 2008. The characteristics of soil water cycle and water balance on steep grassland under natural and simulated rainfall conditions in the Loess Plateau of China. Journal of Hydrology, 360(1-4):242-251.
[6]
Cheng X R, Huang M B, Shao M G, et al. 2009. A comparison of fine root distribution and water consumption of mature Caragana korshinkii Kom grown in two soils in a semiarid region, China. Plant and Soil, 315(1-2):149-161.
[7]
Douaik A, van Meirvenne M, Toth T. 2006. Temporal stability of spatial patterns of soil salinity determined from laboratory and field electrolytic conductivity. Arid Land Research and Management, 20(1):1-13.
[8]
Dunne T, Zhang W, Aubry B F. 1991. Effects of rainfall, vegetation, and microtopography on infiltration and runoff. Water Resources Research, 27(9):2271-2285.
[9]
El-Hassanin A S, Labib T M, Gaber E I. 1993. Effect of vegetation cover and land slope on runoff and soil losses from the watersheds of Burundi. Agriculture Ecosystems & Environment, 43(3-4):301-308.
[10]
Ewers B E, Mackay D S, Gower S T, et al. 2002. Tree species effects on stand transpiration in northern Wisconsin. Water Resources Research, 38(7):1103, doi: 10.1029/2011WR010636.
[11]
Fu W, Huang M B, Gallichand J, et al. 2012. Optimization of plant coverage in relation to water balance in the Loess Plateau of China. Geoderma, 173- 174:134-144.
[12]
Fu X L, Shao M G, Wei X R, et al. 2013. Effects of monovegetation restoration types on soil water distribution and balance on a hillslope in northern loess plateau of China. Journal of Hydrologic Engineering, 18(4):413-421.
[13]
Fyllas N M, Bentley L P, Shenkin A, et al. 2017. Solar radiation and functional traits explain the decline of forest primary productivity along a tropical elevation gradient. Ecology Letters, 20(6):730-740.
doi: 10.1111/ele.12771
pmid: 28464375
[14]
Gao G, Chen D L, Xu C Y, et al. 2007. Trend of estimated actual evapotranspiration over China during 1960-2002. Journal of Geophysical Research-Atmospheres, 112:D11120, doi: 10.1029/2006JD008010.
[15]
Gao L, Shao M. 2012. Temporal stability of shallow soil water content for three adjacent transects on a hillslope. Agricultural Water Management, 110:41-54.
[16]
Gao L, Lv Y J, Wang D D, et al. 2015. Can shallow-layer measurements at a single location be used to predict deep soil water storage at the slope scale? Journal of Hydrology, 531:534-542.
[17]
Gao X D, Wu P T, Zhao X N, et al. 2011. Estimating spatial mean soil water contents of sloping jujube orchards using temporal stability. Agricultural Water Management, 102(1):66-73.
[18]
Gao Y F, Zhao C Y, Muhammad W A, et al. 2019. Actual evapotranspiration of subalpine meadows in the Qilian Mountains, Northwest China. Journal of Arid Land, 11(3):371-384.
[19]
Garcia E, Tague C. 2014. Climate regime and soil storage capacity interact to effect evapotranspiration in western United States mountain catchments. Hydrology And Earth System Sciences, 11(2):2277-2319.
[20]
Gardner C M K, Robinson D, Blyth K, et al. 2001. Soil water content. In: Smith K A, Mullins C E. Soil and Environmental Analysis: Physical methods (2nd ed.). New York: Marcel Dekker, 1-64.
[21]
Grayson R B, Western A W, Chiew F H, et al. 1997. Preferred states in spatial soil moisture patterns: Local and nonlocal controls. Water Resources Research, 33(12):2897-2908.
[22]
Grayson R B, Western A W. 1998. Towards areal estimation of soil water content from point measurements: time and space stability of mean response. Journal of Hydrology, 207(1-2):68-82.
[23]
Green T R, Erskine R H. 2011. Measurement and inference of profile soil-water dynamics at different hillslope positions in a semiarid agricultural watershed. Water Resources Research, 47(12): W00H15, doi: 10.1029/2010WR010074.
[24]
Hu W, Shao, M A, Han F, et al. 2010. Watershed scale temporal stability of soil water content. Geoderma, 158(3-4):181-198.
[25]
Hu W, Si B C. 2014. Can soil water measurements at a certain depth be used to estimate mean soil water content of a soil profile at a point or at a hillslope scale? Journal of Hydrology, 516:67-75.
[26]
Jacobs J M, Mohanty B P, Hsu E C, et al. 2004. SMEX02: Field scale variability, time stability and similarity of soil moisture. Remote Sensing of Environment, 92(4):436-446.
[27]
Jia Y H, Shao M A. 2013. Temporal stability of soil water storage under four types of revegetation on the northern Loess Plateau of China. Agricultural Water Management, 117:33-42.
[28]
Jones J. 2011. Hydrologic responses to climate change: Considering geographic context and alternative hypotheses. Hydrological Process, 25(12):1996-2000.
[29]
Kool D, Agam N, Lazarovitch N, et al. 2014. A review of approaches for evapotranspiration partitioning. Agricultural and Forest Meteorology, 184:56-70.
[30]
Li Q Y, Sun Y W, Yuan W L, et al. 2017. Streamflow responses to climate change and LUCC in a semi-arid watershed of Chinese Loess Plateau. Journal of Arid Land, 9(4):609-621.
[31]
Lian J, Huang M. 2015. Evapotranspiration estimation for an oasis area in the Heihe River Basin using Landsat-8 images and the METRIC model. Water Resources Management, 29(14):51-57.
[32]
Lian J, Huang M. 2016. Comparison of three remote sensing based models to estimate evapotranspiration in an oasis-desert region. Agricultural Water Management, 165:153-162.
[33]
Liao K, Zhou Z, Lai X, et al. 2017. Evaluation of different approaches for identifying optimal sites to predict mean hillslope soil moisture content. Journal of Hydrology, 547:10-20.
[34]
Libardi P L, Reichardt K, Nielsen D R, et al. 1980. Simple field methods for estimating soil hydraulic conductivity. Soil Science Society of America Journal, 44(1):3-7.
[35]
Linacre E. 2004. Evaporation trends. Theoretical and Applied Climatology, 79:11-21.
[36]
Majidi M, Alizadeh A, Vazifedoust M, et al. 2015. Analysis of the effect of missing weather data on estimating daily reference evapotranspiration under different climatic conditions. Water Resources Management, 29(7):2107-2124.
[37]
Manabe S. 1969. Climate and the ocean circulation: I. The atmospheric circulation and the hydrology of the earth's surface. Monthly Weather Review, 97(11):739-774.
[38]
McVicar T R, van Niel T G, Li L T, et al. 2007. Spatially distributing monthly reference evapotranspiration and pan evaporation considering topographic influences. Journal of Hydrology, 338(3-4):196-220.
[39]
Mitchell P J, Benyon R G, Lane P N. 2012. Responses of evapotranspiration at different topographic positions and catchment water balance following a pronounced drought in a mixed species eucalypt forest, Australia. Journal of Hydrology, 440- 441:62-74.
[40]
Mo X G, Liu S X, Lin Z H, et al. 2004. Simulating temporal and spatial variation of evapotranspiration over the Lushi basin. Journal of Hydrology, 285(1-4):125-142.
[41]
Newman B D, Wilcox B P, Archer S R, et al. 2006. Ecohydrology of water-limited environments: A scientific vision. Water Resources Research, 42(6):W06302, doi: 10.1029/ 2005WR004141.
[42]
Nicholls E M, Carey S K, Humphreys E R, et al. 2016. Multi-year water balance assessment of a newly constructed wetland, Fort McMurray, Alberta. Hydrological Processes, 30(16):2739-2753.
[43]
Oishi A C R, Oren K A, Novick S, et al. 2010. Interannual invariability of forest evapotranspiration and its consequence to water flow downstream. Ecosystems, 13:421-436.
[44]
Pan Y X, Wang X P. 2009. Factors controlling the spatial variability of surface soil moisture within revegetated-stabilized desert ecosystems of the Tengger Desert, Northern China. Hydrological Process, 23(11):1591-1601.
[45]
Peel M C, Finlayson B L, McMahon T A. 2007. Updated world map of the Köppen-Geiger climate classification. Hydrology and Earth System Sciences Discussions, 4(2):439-473.
[46]
Piotrowska-Długosz A, Siwik-Ziomek A, Długosz J, et al. 2017. Spatio-temporal variability of soil sulfur content and arylsulfatase activity at a conventionally managed arable field. Geoderma, 295:107-118.
[47]
Santiago L S, Goldstein G, Meinzer F C, et al. 2000. Transpiration and forest structure in relation to soil waterlogging in a Hawaiian montane cloud forest. Tree Physiology, 20(10):673-681.
doi: 10.1093/treephys/20.10.673
pmid: 12651517
[48]
Shangguan Z P, Zheng S X. 2006. Ecological properties of soil water and effects on forest vegetation in the Loess Plateau. International Journal of Sustainable Development & World Ecology, 13(4):307-314.
[49]
Shuttleworth W J. 1993. Evaporation. In: Maidment D R. Handbook of Hydrology. Sydney: McGraw-Hill.
[50]
Starr G. 2005. Assessing temporal stability and spatial variability of soil water patterns with implications for precision water management. Agricultural Water Management, 72(3):223-243.
[51]
Thomas A. 2000. Spatial and temporal characteristics of potential evapotranspiration trends over China. International Journal of Climatology, 20(4):381-396.
[52]
Vachaud G, Passerat de Silans A, Balabanis P, et al. 1985. Temporal stability of spatially measured soil water probability density function. Soil Science Society of America Journal, 49(4):822-828.
[53]
Vivoni E R, Rodriguez J C, Watts C J. 2010. On the spatiotemporal variability of soil moisture and evapotranspiration in a mountainous basin within the North American monsoon region. Water Resources Research, 46(2):W02509, doi: 10.1029/2009WR008240.
[54]
Wilcox B P, Breshears D D, Seyfried M S. 2003. Water balance on rangelands. In: Stewart B A, Howell T A. Encyclopedia of Water Science. New York: Marcel Dekker, Inc., 791-794.
[55]
Wythers K R, Lauenroth W K, Paruelo J M. 1999. Bare-soil evaporation under semiarid field conditions. Soil Science Society of America Journal, 63(5):1341-1349.
[56]
Xu C Y, Singh V P. 2005. Evaluation of three complementary relationship evapotranspiration models by water balance approach to estimate actual regional evapotranspiration in different climatic regions. Journal of Hydrology, 308(1-4):105-121.
[57]
Yang L, Wei W, Mo B, et al. 2011. Soil water deficit under different artificial vegetation restoration in the semi-arid hilly region of the Loess Plateau. Acta Ecologica Sinica, 31:3060-3068. (in Chinese)
[58]
Zeng R J, Cai X M. 2016. Climatic and terrestrial storage control on evapotranspiration temporal variability: Analysis of river basins around the world. Geophysical Research Letters, 43(1):185-195.
[59]
Zhang D B, Yao P W, Na Z, et al. 2016. Soil water balance and water use efficiency of dryland wheat in different precipitation years in response to green manure approach. Scientific Reports, 6:26856, doi: 10.1038/srep26856.
doi: 10.1038/srep26856
pmid: 27225842
[60]
Zhang Y K, Xiao Q L, Huang M B. 2016. Temporal stability analysis identifies soil water relations under different land use types in an oasis agroforestry ecosystem. Geoderma, 271:150-160.
[61]
Zhao L W, Zhao W Z. 2014. Evapotranspiration of an oasis-desert transition zone in the middle stream of Heihe River, Northwest China. Journal of Arid Land, 6(5):529-539.