| Research article |
|

|
|
|
| Modeling and analyzing supply-demand relationships of water resources in Xinjiang from a perspective of ecosystem services |
LI Feng1,2,3, LI Yaoming1,2,3, ZHOU Xuewen4, YIN Zun5, LIU Tie1,2,3, XIN Qinchuan1,2,3,*( ) ) |
1State Key Laboratory of Desert and Oasis Ecology, Xinjiang Institute of Ecology and Geography, Chinese Academy of Sciences, Urumqi 830011, China
2Research Center for Ecology and Environment of Central Asia, Chinese Academy of Sciences, Urumqi 830011, China
3University of Chinese Academy of Sciences, Beijing 100049, China
4School of Atmospheric Sciences, Sun Yat-sen University, Guangzhou 510275, China
5Geophysical Fluid Dynamics Laboratory, Princeton University, Princeton, New Jersey, NJ 08542, USA |
|
|
|
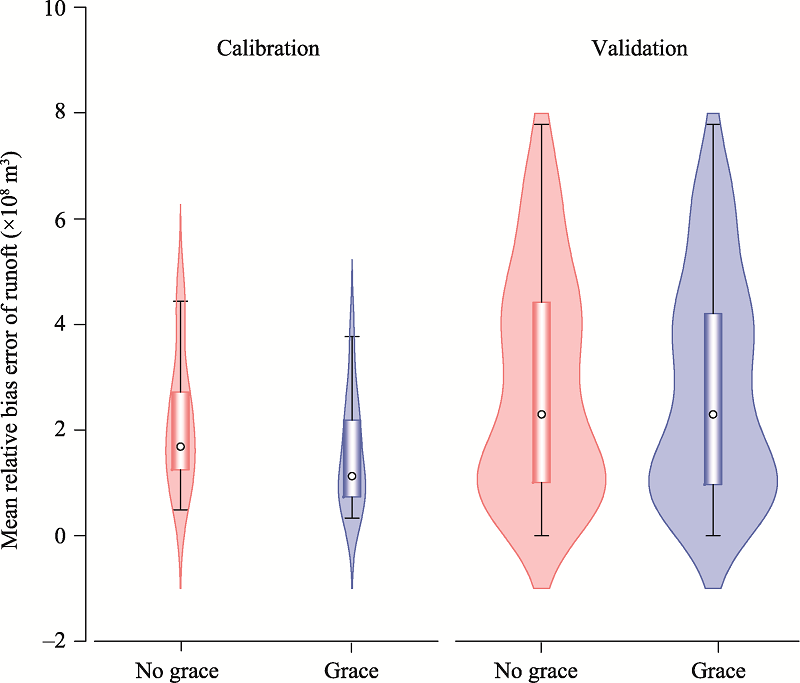
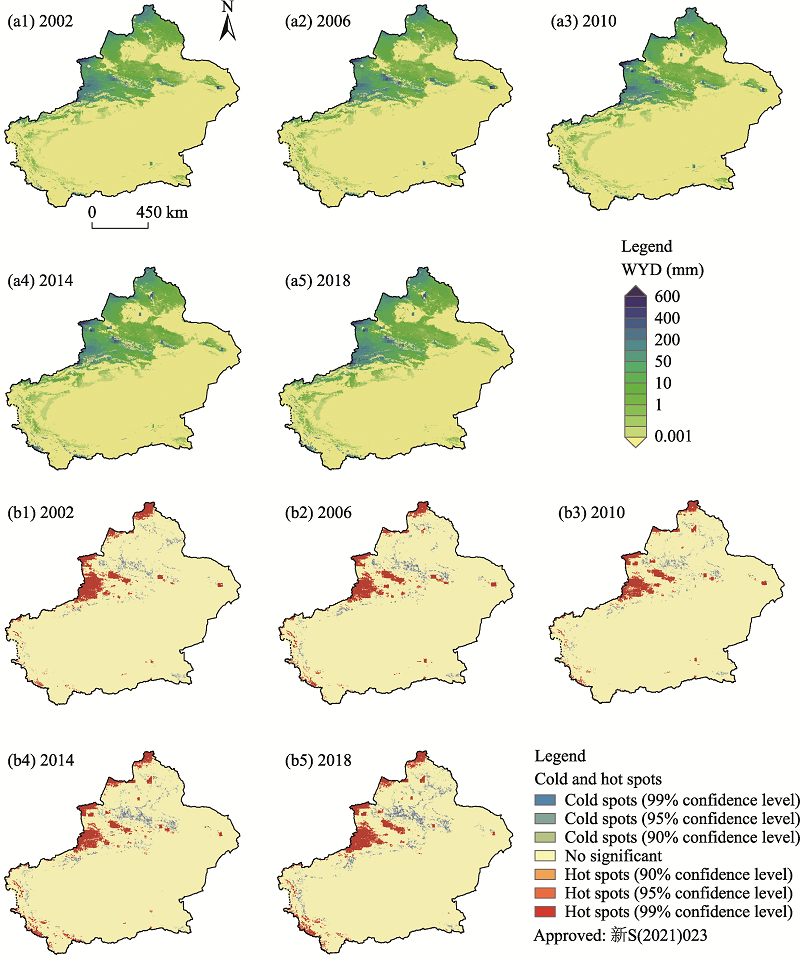
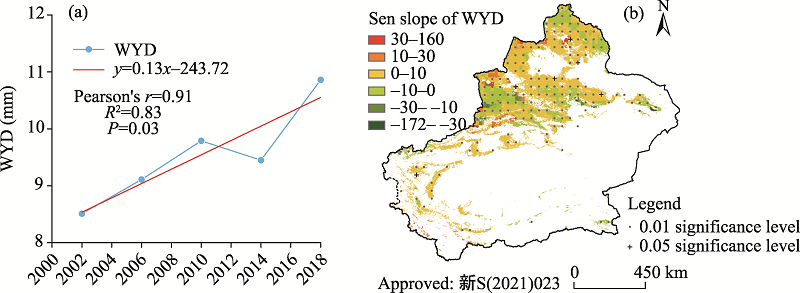
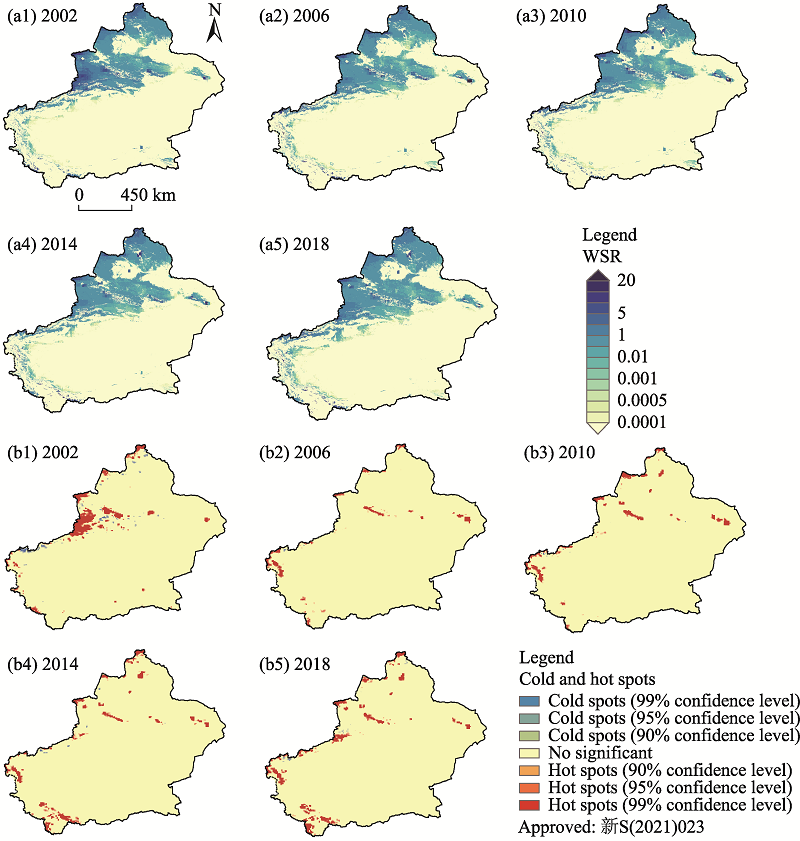
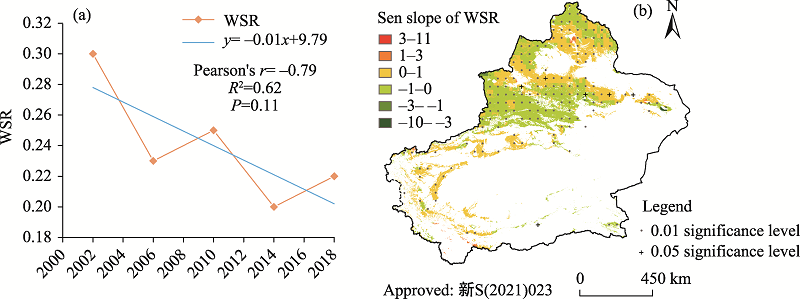
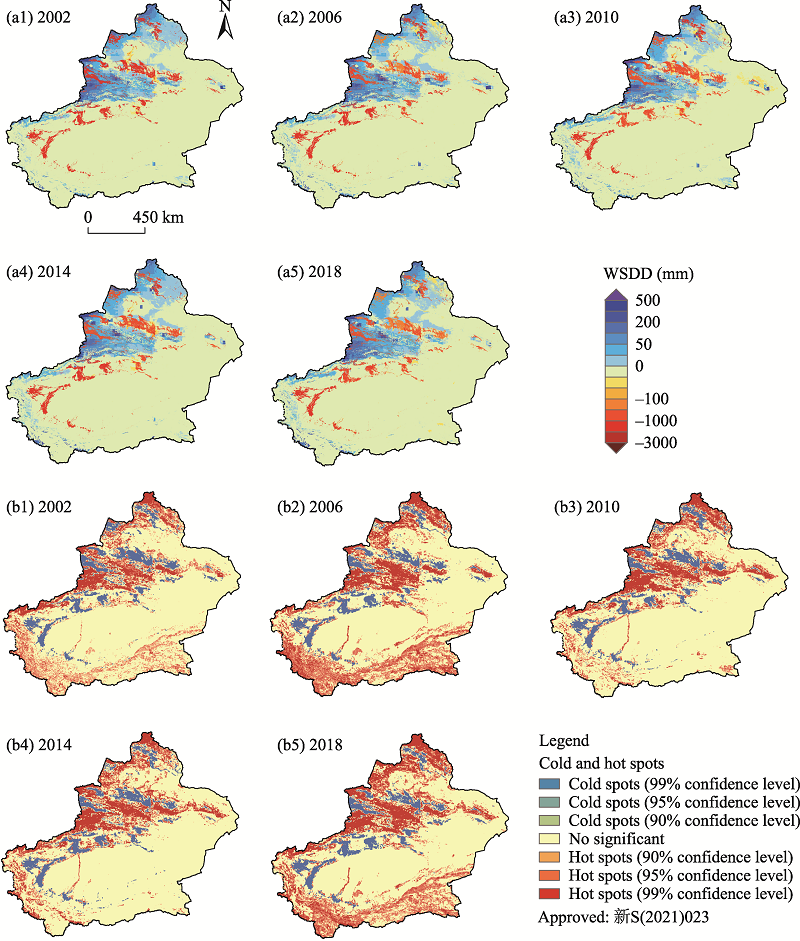
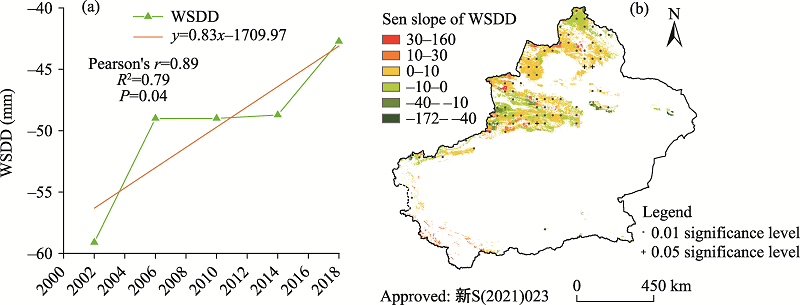
Abstract Water shortage is one bottleneck that limits economic and social developments in arid and semi-arid areas. As the impacts of climate change and human disturbance intensify across time, uncertainties in both water resource supplies and demands increase in arid and semi-arid areas. Taking a typical arid region in China, Xinjiang Uygur Autonomous Region, as an example, water yield depth (WYD) and water utilization depth (WUD) from 2002 to 2018 were simulated using the Integrated Valuation of Ecosystem Services and Tradeoffs (InVEST) model and socioeconomic data. The supply-demand relationships of water resources were analyzed using the ecosystem service indices including water supply-demand difference (WSDD) and water supply rate (WSR). The internal factors in changes of WYD and WUD were explored using the controlled variable method. The results show that the supply- demand relationships of water resources in Xinjiang were in a slight deficit, but the deficit was alleviated due to increased precipitation and decreased WUD of irrigation. WYD generally experienced an increasing trend, and significant increase mainly occurred in the oasis areas surrounding both the Junggar Basin and Tarim Basin. WUD had a downward trend with a decline of 20.70%, especially in oasis areas. Water resources in most areas of Xinjiang were fully utilized and the utilization efficiency of water resources increased. The water yield module in the InVEST model was calibrated and validated using gauging station data in Xinjiang, and the result shows that the use of satellite-based water storage data helped to decrease the bias error of the InVEST model by 0.69×10⁸ m3. This study analyzed water resource supplies and demands from a perspective of ecosystem services, which expanded the scope of the application of ecosystem services and increased the research perspective of water resource evaluation. The results could provide guidance for water resource management such as spatial allocation and structural optimization of water resources in arid and semi-arid areas.
|
|
Received: 23 November 2021
Published: 28 February 2022
|
|
Corresponding Authors:
*XIN Qinchuan (E-mail: xinqinchuan@ms.xjb.ac.cn)
|
|
|
| [1] |
Agudelo C A R, Bustos S L H, Moreno C A P. 2020. Modeling interactions among multiple ecosystem services: a critical review. Ecological Modelling, 429:109103, doi: 10.1016/j.ecolmodel.2020.109103.
doi: 10.1016/j.ecolmodel.2020.109103
|
|
|
| [2] |
Bao C, Zou J J. 2017. Exploring the coupling and decoupling relationships between urbanization quality and water resources constraint intensity: spatiotemporal analysis for northwest China. Sustainability, 9(11):1960, doi: 10.3390/su9111960.
doi: 10.3390/su9111960
|
|
|
| [3] |
Benra F, de Frutos A, Gaglio M, et al. 2021. Mapping water ecosystem services: evaluating InVEST model predictions in data scarce regions. Environmental Modelling and Software, 138:104982, doi: 10.1016/j.envsoft.2021.104982.
doi: 10.1016/j.envsoft.2021.104982
|
|
|
| [4] |
Beveridge A K, Harig C, Simons F J. 2018. The changing mass of glaciers on the Tibetan Plateau, 2002-2016, using time-variable gravity from the GRACE satellite mission. Journal of Geodetic Science, 8(1):83-97.
doi: 10.1515/jogs-2018-0010
|
|
|
| [5] |
Boithias L, Acuña V, Vergoñós L, et al. 2014. Assessment of the water supply: demand ratios in a Mediterranean basin under different global change scenarios and mitigation alternatives. Science of the Total Environment, 470-471:567-577.
doi: 10.1016/j.scitotenv.2013.10.003
|
|
|
| [6] |
Bolch T, Duethmann D, Wortmann M, et al. 2021. Declining glaciers endanger sustainable development of the oases along the Aksu-Tarim River (Central Asia). International Journal of Sustainable Development and World Ecology, doi: 10.1080/13504509.2021.1943723.
doi: 10.1080/13504509.2021.1943723
|
|
|
| [7] |
Cai T Y, Zhang X H, Xia F Q, et al. 2021. The process-mode-driving force of cropland expansion in arid regions of China based on the land use remote sensing monitoring data. Remote Sensing, 13(15):2949, doi: 10.3390/rs13152949.
doi: 10.3390/rs13152949
|
|
|
| [8] |
Canadell J, Jackson R B, Ehleringer J R, et al. 1996. Maximum rooting depth of vegetation types at the global scale. Oecologia, 108:583-595.
doi: 10.1007/BF00329030
pmid: 28307789
|
|
|
| [9] |
Cao Y D, Zhang W, Ren J Z. 2020. Efficiency analysis of the input for water-saving agriculture in China. Water, 12(1):207, doi: 10.3390/w12010207.
doi: 10.3390/w12010207
|
|
|
| [10] |
Chen C, Shi J. 2016. Application of water-saving irrigation technologies in minority areas of Xinjiang. Proceedings of the 2016 International Conference on Economy, Management and Education Technology. Chongqing, China, 1210-1214.
|
|
|
| [11] |
Chen D S, Li J, Yang X N, et al. 2020. Quantifying water provision service supply, demand and spatial flow for land use optimization: a case study in the Yanhe Watershed. Ecosystem Services, 43:101117, doi: 10.1016/j.ecoser.2020.101117.
doi: 10.1016/j.ecoser.2020.101117
|
|
|
| [12] |
Chen Y N, Li Z, Fan Y T, et al. 2015. Progress and prospects of climate change impacts on hydrology in the arid region of Northwest China. Environmental Research, 139:11-19.
doi: 10.1016/j.envres.2014.12.029
|
|
|
| [13] |
Costanza R, D'Arge R, de Groot R, et al. 1998. The value of the world's ecosystem services and natural capital. Nature, 387(6630):253-260.
doi: 10.1038/387253a0
|
|
|
| [14] |
Dai S S, Li L H, Xu H G. 2017. Simulation of water scarcity in a leap-forward developing arid region: a system dynamics model of Xinjiang Uygur Autonomous Region. Water Policy, 19(4):741-757.
doi: 10.2166/wp.2017.132
|
|
|
| [15] |
Dawadi S, Ahmad S. 2013. Evaluating the impact of demand-side management on water resources under changing climatic conditions and increasing population. Journal of Environmental Management, 114:261-275.
doi: 10.1016/j.jenvman.2012.10.015
|
|
|
| [16] |
Dong Q, Wang W G, Shao Q X, et al. 2020. The response of reference evapotranspiration to climate change in Xinjiang, China: historical changes, driving forces, and future projections. International Journal of Climatology, 40(1):235-254.
doi: 10.1002/joc.v40.1
|
|
|
| [17] |
Donohue R J, Roderick M L, Mcvicar T R. 2012. Roots, storms and soil pores: incorporating key ecohydrological processes into Budyko's hydrological model. Journal of Hydrology, 436-437:35-50.
doi: 10.1016/j.jhydrol.2012.02.033
|
|
|
| [18] |
Fischer G, Shah M, van Velthuizen H T. 2000. Global agro-ecological zones assessment: methodology and results. IIASA Interim Report, 3:1-10.
|
|
|
| [19] |
Fu Q, Li B, Hou Y, et al. 2017. Effects of land use and climate change on ecosystem services in Central Asia's arid regions: a case study in Altay Prefecture, China. Science of the Total Environment, 607-608:633-646.
doi: 10.1016/j.scitotenv.2017.06.241
|
|
|
| [20] |
Gong Y T, Zhang Y W. 2020. Spatial correlation analysis of economic development and water consumption in Xinjiang. Journal of Coastal Research, 104(S1):605-611.
|
|
|
| [21] |
Guerri G, Crisci A, Messeri A, et al. 2021. Thermal summer diurnal hot-spot analysis: the role of local urban features layers. Remote Sensing, 13(3):538, doi: 10.3390/rs13030538.
doi: 10.3390/rs13030538
|
|
|
| [22] |
Guo B, Li W H, Guo J Y, et al. 2015. Risk assessment of regional irrigation water demand and supply in an arid inland river basin of Northwestern China. Sustainability, 7(9):12958-12973.
doi: 10.3390/su70912958
|
|
|
| [23] |
Guo W Q, Liu S Y, Xu J L, et al. 2015. The second Chinese glacier inventory: data, methods and results. Journal of Glaciology, 61(226):357-372.
doi: 10.3189/2015JoG14J209
|
|
|
| [24] |
Guo Y, Shen Y J. 2016. Agricultural water supply/demand changes under projected future climate change in the arid region of Northwestern China. Journal of Hydrology, 540:257-273.
doi: 10.1016/j.jhydrol.2016.06.033
|
|
|
| [25] |
Gupta S C, Larson W E. 1979. Estimating soil water retention characteristics from particle size distribution, organic matter percent, and bulk density. Water Resources Research, 15(6):1633-1635.
doi: 10.1029/WR015i006p01633
|
|
|
| [26] |
Harris I, Osborn T J, Jones P, et al. 2020. Version 4 of the CRU TS monthly high-resolution gridded multivariate climate dataset. Scientific Data, 7(1):109.
doi: 10.1038/s41597-020-0453-3
pmid: 32246091
|
|
|
| [27] |
Hartmann H, Snow J A, Su B D, et al. 2016. Seasonal predictions of precipitation in the Aksu-Tarim River Basin for improved water resources management. Global and Planetary Change, 147:86-96.
doi: 10.1016/j.gloplacha.2016.10.018
|
|
|
| [28] |
Hong Y Y, Ding Q, Zhou T, et al. 2020. Ecosystem service bundle index construction, spatiotemporal dynamic display, and driving force analysis. Ecosystem Health and Sustainability, 6(1):1843972, doi: 10.1080/20964129.2020.1843972.
doi: 10.1080/20964129.2020.1843972
|
|
|
| [29] |
Huang J P, Ma J, Guan X D, et al. 2019. Progress in semi-arid climate change studies in China. Advances in Atmospheric Sciences, 36(9):922-937.
doi: 10.1007/s00376-018-8200-9
|
|
|
| [30] |
Jia R N, Jiang X H, Shang X X, et al. 2018. Study on the water resource carrying capacity in the middle reaches of the Heihe River based on water resource allocation. Water, 10(9):1203, doi: 10.3390/w10091203.
doi: 10.3390/w10091203
|
|
|
| [31] |
Jin S G, Tian X, Feng G. 2016. Recent glacier changes in the Tien Shan observed by satellite gravity measurements. Global and Planetary Change, 143:81-87.
doi: 10.1016/j.gloplacha.2016.06.006
|
|
|
| [32] |
Kang T T, Yang S, Bu J Y, et al. 2020. Quantitative assessment for the dynamics of the main ecosystem services and their interactions in the northwestern arid area, China. Sustainability, 12(3):803, doi: 10.3390/su12030803.
doi: 10.3390/su12030803
|
|
|
| [33] |
Kaval P. 2019. Integrated catchment management and ecosystem services: a twenty-five year overview. Ecosystem Services, 37(11):100912, doi: 10.1016/j.ecoser.2019.100912.
doi: 10.1016/j.ecoser.2019.100912
|
|
|
| [34] |
Lal R. 2019. Carbon cycling in global drylands. Current Climate Change Reports, 5(3):221-232.
doi: 10.1007/s40641-019-00132-z
|
|
|
| [35] |
Lang Y Q, Song W, Zhang Y. 2017. Responses of the water-yield ecosystem service to climate and land use change in Sancha River Basin, China. Physics and Chemistry of the Earth, 101:102-111.
|
|
|
| [36] |
Lei J, Dong W, Yang Y, et al. 2012. Interactions between water-land resources and oasis urban development at the northern slopes of the Tianshan Mountains, Xinjiang, China. Journal of Arid Land, 4(2):221-229.
doi: 10.3724/SP.J.1227.2012.00221
|
|
|
| [37] |
Li J H, Jiang H W, Bai Y, et al. 2016. Indicators for spatial-temporal comparisons of ecosystem service status between regions: a case study of the Taihu River Basin, China. Ecological Indicators, 60:1008-1016.
doi: 10.1016/j.ecolind.2015.09.002
|
|
|
| [38] |
Li L J, LI J Y, Liang L Q. 2009. Method for calculating ecological water storage and ecological water requirement of marsh. Journal of Geographical Sciences, 19(4):427-436.
|
|
|
| [39] |
Li Y, Guo T T, Li P P. 2012. Study on calculation of ecological footprint model parameters of Beijing urban water resources. Advanced Materials Research, 374-377:105-108.
doi: 10.4028/www.scientific.net/AMR.374-377
|
|
|
| [40] |
Li Z H, Deng X Z, Jin G, et al. 2020. Tradeoffs between agricultural production and ecosystem services: a case study in Zhangye, Northwest China. Science of the Total Environment, 707:136032, doi: 10.1016/j.scitotenv.2019.136032.
doi: 10.1016/j.scitotenv.2019.136032
|
|
|
| [41] |
Ling H B, Guo B, Zhang G P, et al. 2019. Evaluation of the ecological protective effect of the ''large basin'' comprehensive management system in the Tarim River basin, China. Science of the Total Environment, 650:1696-1706.
doi: 10.1016/j.scitotenv.2018.09.327
|
|
|
| [42] |
Liu X J, Liu Y. 2019. The study on supply and demand of water resources in Alar City based on the system dynamics model. Journal of Physics: Conference Series, 1324(1):012017, doi: 10.1088/1742-6596/1324/1/012017.
doi: 10.1088/1742-6596/1324/1/012017
|
|
|
| [43] |
Luo M, Liu T, Meng F H, et al. 2017. Proportional coefficient method applied to TRMM rainfall data: case study of hydrological simulations of the Hotan River Basin (China). Journal of Water and Climate Change, 8(4):627-640.
doi: 10.2166/wcc.2017.080
|
|
|
| [44] |
Luo M, Liu T, Meng F H, et al. 2019. Identifying climate change impacts on water resources in Xinjiang, China. Science of the Total Environment, 676:613-626.
doi: 10.1016/j.scitotenv.2019.04.297
|
|
|
| [45] |
Luo N N, Mao D H, Wen B L, et al. 2020. Climate change affected vegetation dynamics in the Northern Xinjiang of China: evaluation by SPEI and NDVI. Land, 9(3):90, doi: 10.3390/land9030090.
doi: 10.3390/land9030090
|
|
|
| [46] |
Luo Y Y, Yang Y T, Yang D W, et al. 2020. Quantifying the impact of vegetation changes on global terrestrial runoff using the Budyko framework. Journal of Hydrology, 590(8):125389, doi: 10.1016/j.jhydrol.2020.125389.
doi: 10.1016/j.jhydrol.2020.125389
|
|
|
| [47] |
Meng F C, Su F G, Li Y, et al. 2019. Changes in terrestrial water storage during 2003-2014 and possible causes in Tibetan Plateau. Journal of Geophysical Research: Atmospheres, 124(6):2909-2931.
doi: 10.1029/2018JD029552
|
|
|
| [48] |
Millennium Ecosystem Assessment. 2005. Ecosystems and Human Well-being: Synthesis. Washington, DC: Island Press, 155.
|
|
|
| [49] |
Ministry of Water Resources of the People's Republic of China. 2018. Bulletin of River Sediment in China. [2021-12-25]. http://www.mwr.gov.cn/sj/tjgb/zghlnsgb/201906/t20190618_1342326.html .(in Chinese)
|
|
|
| [50] |
Niu Q F, Xiao X M, Zhang Y, et al. 2019. Ecological engineering projects increased vegetation cover, production, and biomass in semiarid and subhumid Northern China. Land Degradation and Development, 30(13):1620-1631.
doi: 10.1002/ldr.v30.13
|
|
|
| [51] |
Novoa V, Ahumada-Rudolph R, Rojas O, et al. 2019. Understanding agricultural water footprint variability to improve water management in Chile. Science of the Total Environment, 670:188-199.
doi: 10.1016/j.scitotenv.2019.03.127
|
|
|
| [52] |
Ochoa V, Urbina-Cardona N. 2017. Tools for spatially modeling ecosystem services: publication trends, conceptual reflections and future challenges. Ecosystem Services, 26:155-169.
doi: 10.1016/j.ecoser.2017.06.011
|
|
|
| [53] |
Ord J K, Getis A. 1992. The analysis of spatial association by use of distance statistics. Geographical Analysis, 24(3):189-206.
doi: 10.1111/gean.1992.24.issue-3
|
|
|
| [54] |
Ouyang Z Y, Song C S, Zheng H, et al. 2020. Gross Ecosystem Product (GEP): a tractable approach for bringing ecological information into decision-making. Proceedings of the National Academy of Sciences USA, 117:14593-14601.
|
|
|
| [55] |
Pan T, Wu S H, Liu Y J. 2015. Relative contributions of land use and climate change to water supply variations over Yellow River Source Area in Tibetan Plateau during the past three decades. PloS ONE, 10(4):e0123793, doi: 10.1371/journal.pone.0123793.
doi: 10.1371/journal.pone.0123793
|
|
|
| [56] |
Piao S L, Ciais P, Huang Y, et al. 2010. The impacts of climate change on water resources and agriculture in China. Nature, 467(7311):43-51.
doi: 10.1038/nature09364
|
|
|
| [57] |
Polasky S, Nelson E, Pennington D, et al. 2011. The impact of land-use change on ecosystem services, biodiversity and returns to landowners: a case study in the state of Minnesota. Environmental and Resource Economics, 48(2):219-242.
doi: 10.1007/s10640-010-9407-0
|
|
|
| [58] |
Redhead J W, Stratford C, Sharps K, et al. 2016. Empirical validation of the InVEST water yield ecosystem service model at a national scale. Science of the Total Environment , 569-570:1418-1426.
doi: 10.1016/j.scitotenv.2016.06.227
|
|
|
| [59] |
Rodell M, Famiglietti J S, Wiese D N, et al. 2018. Emerging trends in global freshwater availability. Nature, 557(7707):651-659.
doi: 10.1038/s41586-018-0123-1
|
|
|
| [60] |
Sahle M, Saito O, Fürst C, et al. 2019. Quantifying and mapping of water-related ecosystem services for enhancing the security of the food-water-energy nexus in tropical data-sparse catchment. Science of the Total Environment, 646:573-586.
doi: 10.1016/j.scitotenv.2018.07.347
|
|
|
| [61] |
Schröter M, Remme R P. 2016. Spatial prioritisation for conserving ecosystem services: comparing hotspots with heuristic optimisation. Landscape Ecology, 31(2):431-450.
doi: 10.1007/s10980-015-0258-5
|
|
|
| [62] |
Scordo F, Seitz T M, Seitz C, et al. 2018. Modeling water yield: assessing the role of site and region-specific attributes in determining model performance of the InVEST seasonal water yield model. Water, 10(11):1496, doi: 10.3390/w10111496.
doi: 10.3390/w10111496
|
|
|
| [63] |
Seidl I, Tisdell C A. 1999. Carrying capacity reconsidered: from Malthus' population theory to cultural carrying capacity. Ecological Economics, 31(3):395-408.
doi: 10.1016/S0921-8009(99)00063-4
|
|
|
| [64] |
Shang S H, Wang H J. 2013. Assessment of impact of water diversion projects on ecological water uses in arid region. Water Science and Engineering, 6(2):119-130.
|
|
|
| [65] |
Sharp R, Chaplin-Kramer R, Wood S, et al. 2015. InVEST 3.2.0 User's Guide. [2021-10-25]. https://naturalcapitalproject.stanford.edu/software/invest .
|
|
|
| [66] |
Shen Y J, Li S, Chen Y N, et al. 2013. Estimation of regional irrigation water requirement and water supply risk in the arid region of Northwestern China 1989-2010. Agricultural Water Management, 128:55-64.
doi: 10.1016/j.agwat.2013.06.014
|
|
|
| [67] |
Shi Y F, Shen Y P, Kang E, et al. 2007. Recent and future climate change in northwest China. Climatic Change, 80(3):379-393.
doi: 10.1007/s10584-006-9121-7
|
|
|
| [68] |
Statistical Bureau of Xinjiang Uygur Autonomous Region. 2019. Statistical Bulletin of National Economic and Social Development of Xinjiang Uygur Autonomous Region in 2019. [2021-10-25]. http://tjj.xinjiang.gov.cn/tjj/tjgn/202006/06087bf9aeb04c4eb518627b5ee028be.shtml .(in Chinese)
|
|
|
| [69] |
Tallis E H, Ricketts T, Guerry A, et al. 2011. InVEST 2.2.2 Users Guide. [2021-10-25]. https://storage.googleapis.com/releases.naturalcapitalproject.org/invest-userguide/latest/index.html .
|
|
|
| [70] |
Tallis H, Polasky S. 2009. Mapping and valuing ecosystem services as an approach for conservation and natural-resource management. Annals of the New York Academy of Sciences, 1162(1):265-283.
doi: 10.1111/j.1749-6632.2009.04152.x
|
|
|
| [71] |
Tang H, Yang D G, Xiao Y Q, et al. 2012. Dynamic evolution of city size and urban water of oasis city in Xinjiang. Lecture Notes in Electrical Engineering, 126(3):245-253.
|
|
|
| [72] |
Wackernage M, Rees W E. 1997. Perceptual and structural barriers to investing in natural capital: economics from an ecological footprint perspective. Ecological Economics, 20(1):3-24.
doi: 10.1016/S0921-8009(96)00077-8
|
|
|
| [73] |
Wang F, Chen Y N, Li Z, et al. 2019. Assessment of the irrigation water requirement and water supply risk in the Tarim River Basin, Northwest China. Sustainability, 11(18):4941, doi: 10.3390/su11184941.
doi: 10.3390/su11184941
|
|
|
| [74] |
Wang X N, Ding Y J, Zhao C C, et al. 2018. Validation of TRMM 3B42V7 rainfall product under complex topographic and climatic conditions over Hexi region in the Northwest Arid Region of China. Water, 10(8):1006, doi: 10.3390/w10081006.
doi: 10.3390/w10081006
|
|
|
| [75] |
Wang Y, Zhang S, Zhen H, et al. 2020. Spatiotemporal evolution characteristics in ecosystem service values based on land use/cover change in the Tarim River Basin, China. Sustainability, 12(18):7759, doi: 10.3390/SU12187759.
doi: 10.3390/SU12187759
|
|
|
| [76] |
Wang Y C, Zhao J, Fu J W, et al. 2019. Effects of the Grain for Green Program on the water ecosystem services in an arid area of China—using the Shiyang River Basin as an example. Ecological Indicators, 104(6):659-668.
doi: 10.1016/j.ecolind.2019.05.045
|
|
|
| [77] |
Water Resources Department of Xinjiang Uygur Autonomous Region. 2018. Xinjiang Water Resources Bulletin (2002-2018). [2021-09-28]. http://slt.xinjiang.gov.cn/slt/szygb/list.shtml .(in Chinese)
|
|
|
| [78] |
Wei H J, Liu H M, Xu Z H, et al. 2018. Linking ecosystem services supply, social demand and human well-being in a typical mountain-oasis-desert area, Xinjiang, China. Ecosystem Services, 31:44-57.
doi: 10.1016/j.ecoser.2018.03.012
|
|
|
| [79] |
Wei J F, Liu S Y, Guo W Q, et al. 2014. Surface-area changes of glaciers in the Tibetan Plateau interior area since the 1970s using recent Landsat images and historical maps. Annals of Glaciology, 55(66):213-222.
doi: 10.3189/2014AoG66A038
|
|
|
| [80] |
William E R. 1992. Ecological footprints and appropriated carrying capacity: what urban economics leaves out. Environment and Urbanization, 4(2):121-130.
doi: 10.1177/095624789200400212
|
|
|
| [81] |
Xu Y F, Yang J, Chen Y N. 2016. NDVI-based vegetation responses to climate change in an arid area of China. Theoretical and Applied Climatology, 126(1):213-222.
doi: 10.1007/s00704-015-1572-1
|
|
|
| [82] |
Xu Z H, Wei H J, Dong X B, et al. 2020. Evaluating the ecological benefits of plantations in arid areas from the perspective of ecosystem service supply and demand-based on emergy analysis. Science of the Total Environment, 705:135853, doi: 10.1016/j.scitotenv.2019.135853.
doi: 10.1016/j.scitotenv.2019.135853
|
|
|
| [83] |
Yahdjian L, Sala O E, Havstad K M. 2015. Rangeland ecosystem services: shifting focus from supply to reconciling supply and demand. Frontiers in Ecology and the Environment, 13(1):44-51.
doi: 10.1890/140156
|
|
|
| [84] |
Yang T, Wang C, Chen Y N, et al. 2015. Climate change and water storage variability over an arid endorheic region. Journal of Hydrology, 529:330-339.
doi: 10.1016/j.jhydrol.2015.07.051
|
|
|
| [85] |
Yang X, Chen R S, Meadows Michael E, et al. 2020. Modelling water yield with the InVEST model in a data scarce region of northwest China. Water Supply, 20(3):1035-1045.
doi: 10.2166/ws.2020.026
|
|
|
| [86] |
Yu Y, Pi Y Y, Yu X, et al. 2019. Climate change, water resources and sustainable development in the arid and semi-arid lands of Central Asia in the past 30 years. Journal of Arid Land, 11(1):1-14.
doi: 10.1007/s40333-018-0073-3
|
|
|
| [87] |
Yu Z Y, Bi H. 2011. The key problems and future direction of ecosystem services research. Energy Procedia, 5:64-68.
doi: 10.1016/j.egypro.2011.03.012
|
|
|
| [88] |
Zeng X B. 2001. Global vegetation root distribution for land modeling. Journal of Hydrometeorology, 2(5):525-530.
doi: 10.1175/1525-7541(2001)002<0525:GVRDFL>2.0.CO;2
|
|
|
| [89] |
Zhai T L, Wang J, Jin Z F, et al. 2020. Did improvements of ecosystem services supply-demand imbalance change environmental spatial injustices? Ecological indicators, 111(1):106068, doi: 10.1016/j.ecolind.2020.106068.
doi: 10.1016/j.ecolind.2020.106068
|
|
|
| [90] |
Zhang L, Dawes W R, Walker G R. 2001. Response of mean annual evapotranspiration to vegetation changes at catchment scale. Water Resources Research, 37(3):701-708.
doi: 10.1029/2000WR900325
|
|
|
| [91] |
Zhang P, Deng M, Long A, et al. 2020. Coupling analysis of social-economic water consumption and its effects on the arid environments in Xinjiang of China based on the water and ecological footprints. Journal of Arid Land, 12(1):73-89.
doi: 10.1007/s40333-020-0050-5
|
|
|
| [92] |
Zhang Q, Sun P, Li J F, et al. 2015. Spatiotemporal properties of droughts and related impacts on agriculture in Xinjiang, China. International Journal of Climatology, 35(7):1254-1266.
doi: 10.1002/joc.2015.35.issue-7
|
|
|
| [93] |
Zhang X T, Chen R S, Liu G H, et al. 2021. Economic value of freshwater provisioning services of the cryosphere in the Urumqi River, Northwest China. Advances in Climate Change Research, 12(6):894-902.
doi: 10.1016/j.accre.2021.09.003
|
|
|
| [94] |
Zhou F, Bo Y, Ciais P, et al. 2020. Deceleration of China's human water use and its key drivers. Proceedings of the national academy of sciences, 117(14):7702-7711.
|
|
|
| [95] |
Zhou J, Wang Y J, Su B D, et al. 2020. Choice of potential evapotranspiration formulas influences drought assessment: a case study in China. Atmospheric research, 242(4):104979, doi: 10.1016/j.atmosres.2020.104979.
doi: 10.1016/j.atmosres.2020.104979
|
|
|
|
Viewed |
|
|
|
Full text
|
|
|
|
|
Abstract
|
|
|
|
|
Cited |
|
|
|
|
| |
Shared |
|
|
|
|
| |
Discussed |
|
|
|
|