| Research article |
|


|
|
|
| Environmental significance and hydrochemical characteristics of rivers in the western region of the Altay Mountains, China |
LIU Shuangshuang1,2, WANG Feiteng1,*( ), XU Chunhai1, WANG Lin1, LI Huilin1 ), XU Chunhai1, WANG Lin1, LI Huilin1 |
1State Key Laboratory of Cryospheric Science, Northwest Institute of Eco-Environment and Resources, Chinese Academy of Sciences, Lanzhou 730000, China
2University of Chinese Academy of Sciences, Beijing 100049, China |
|
|
|
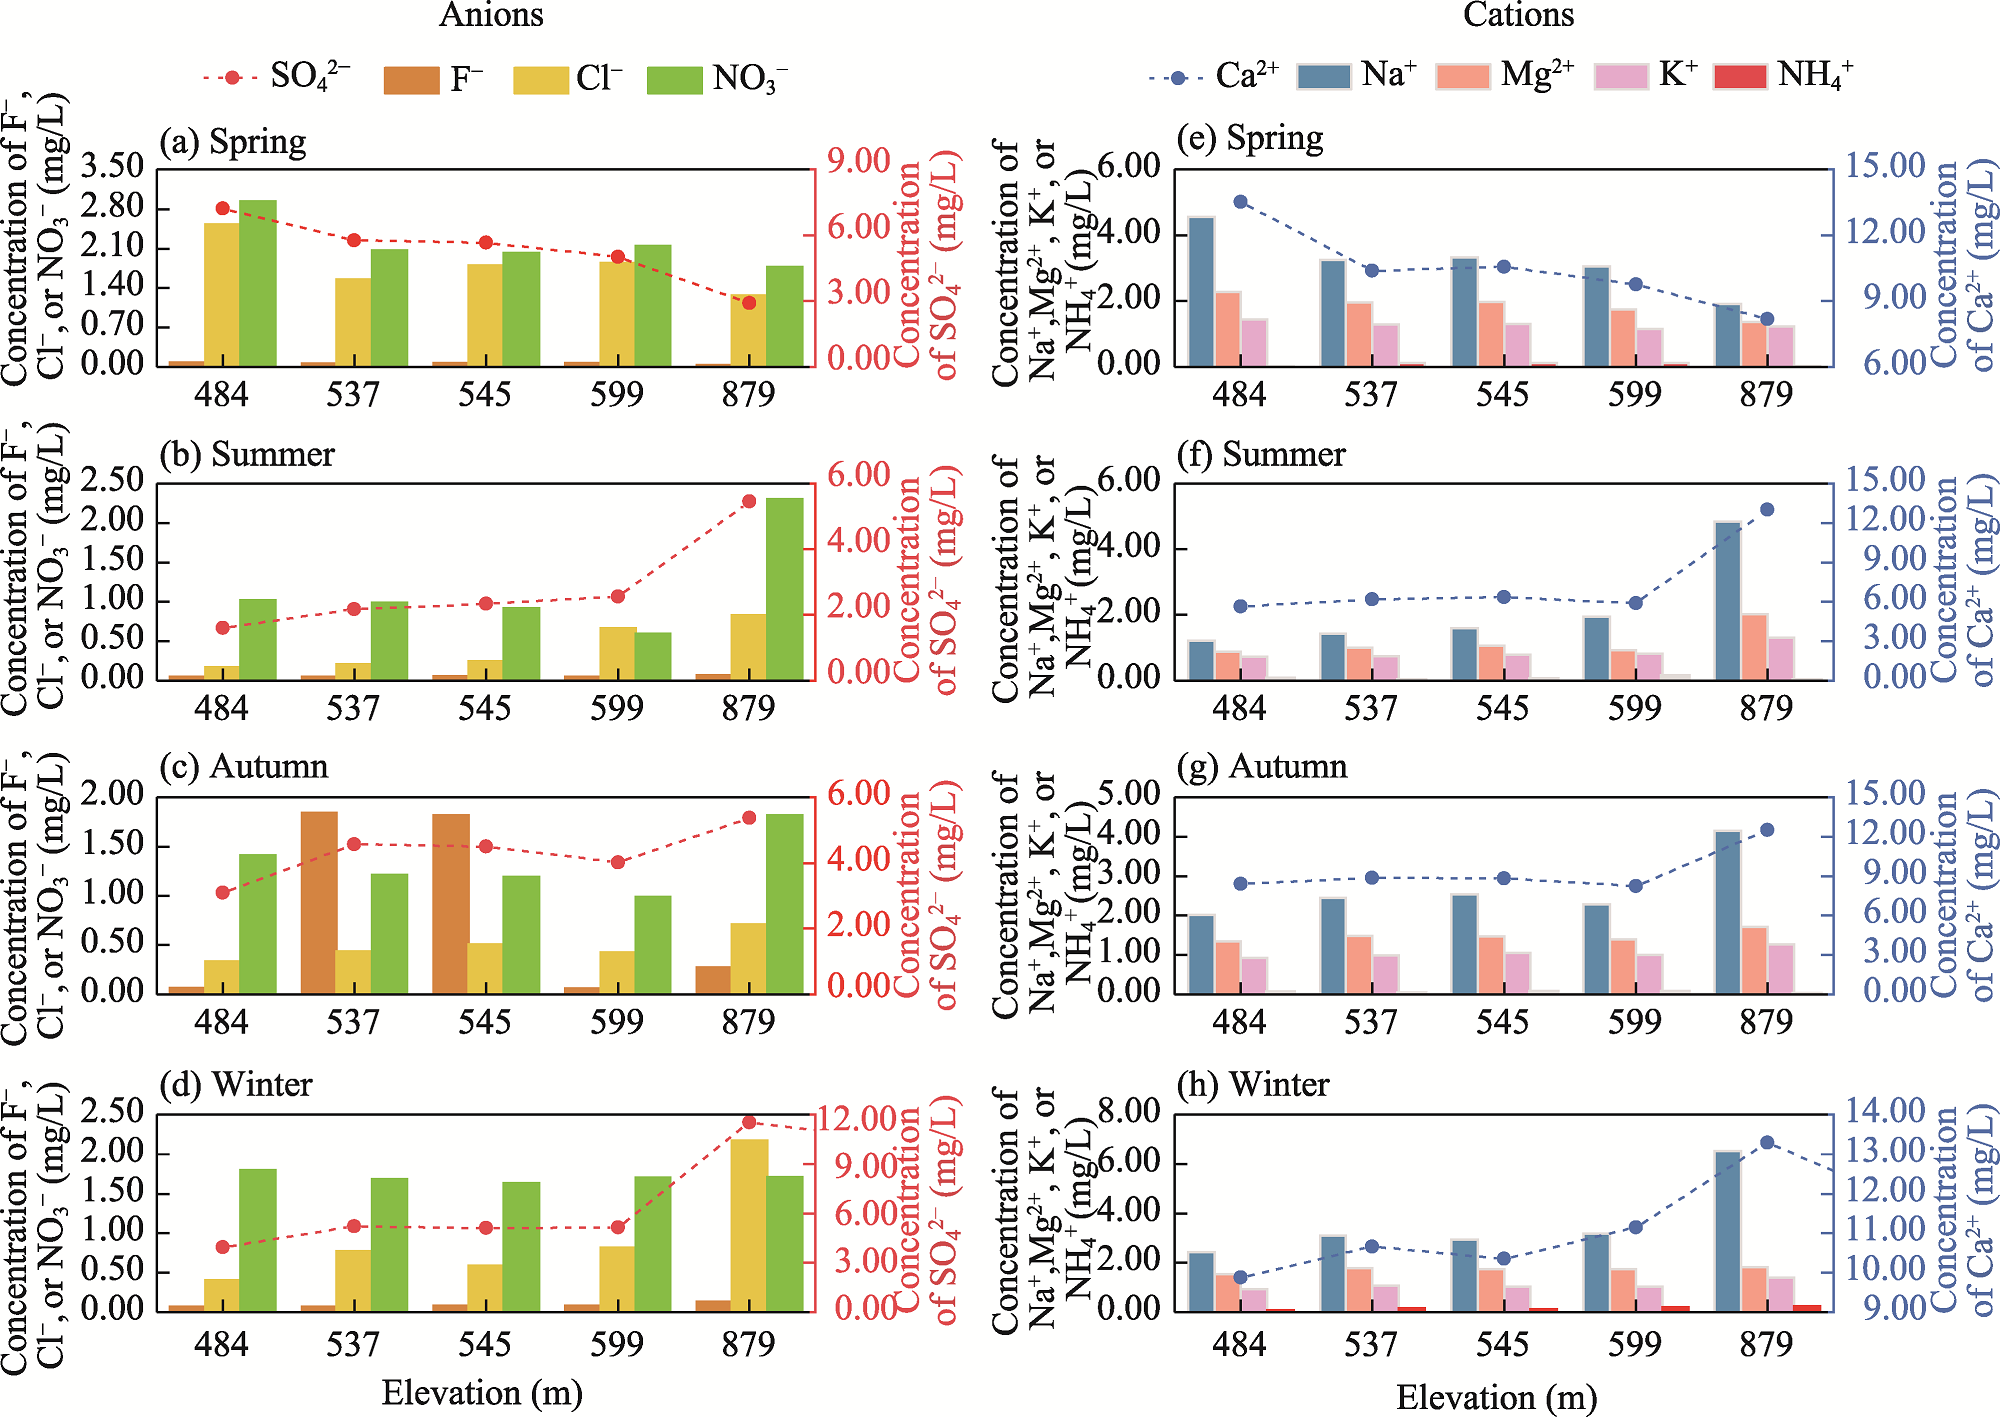
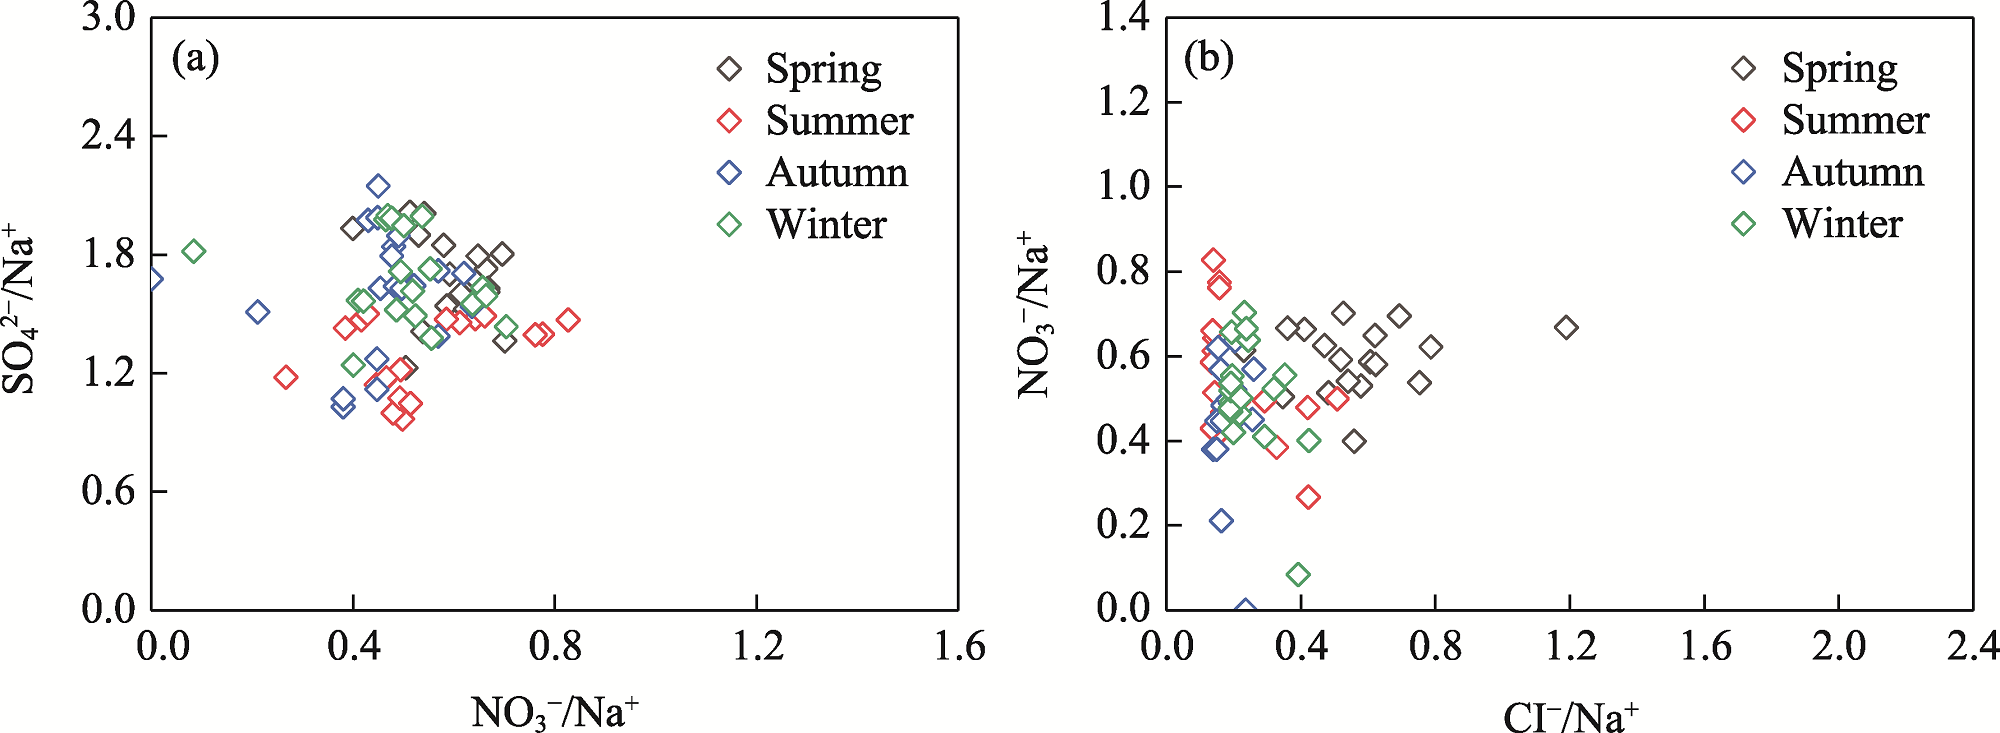
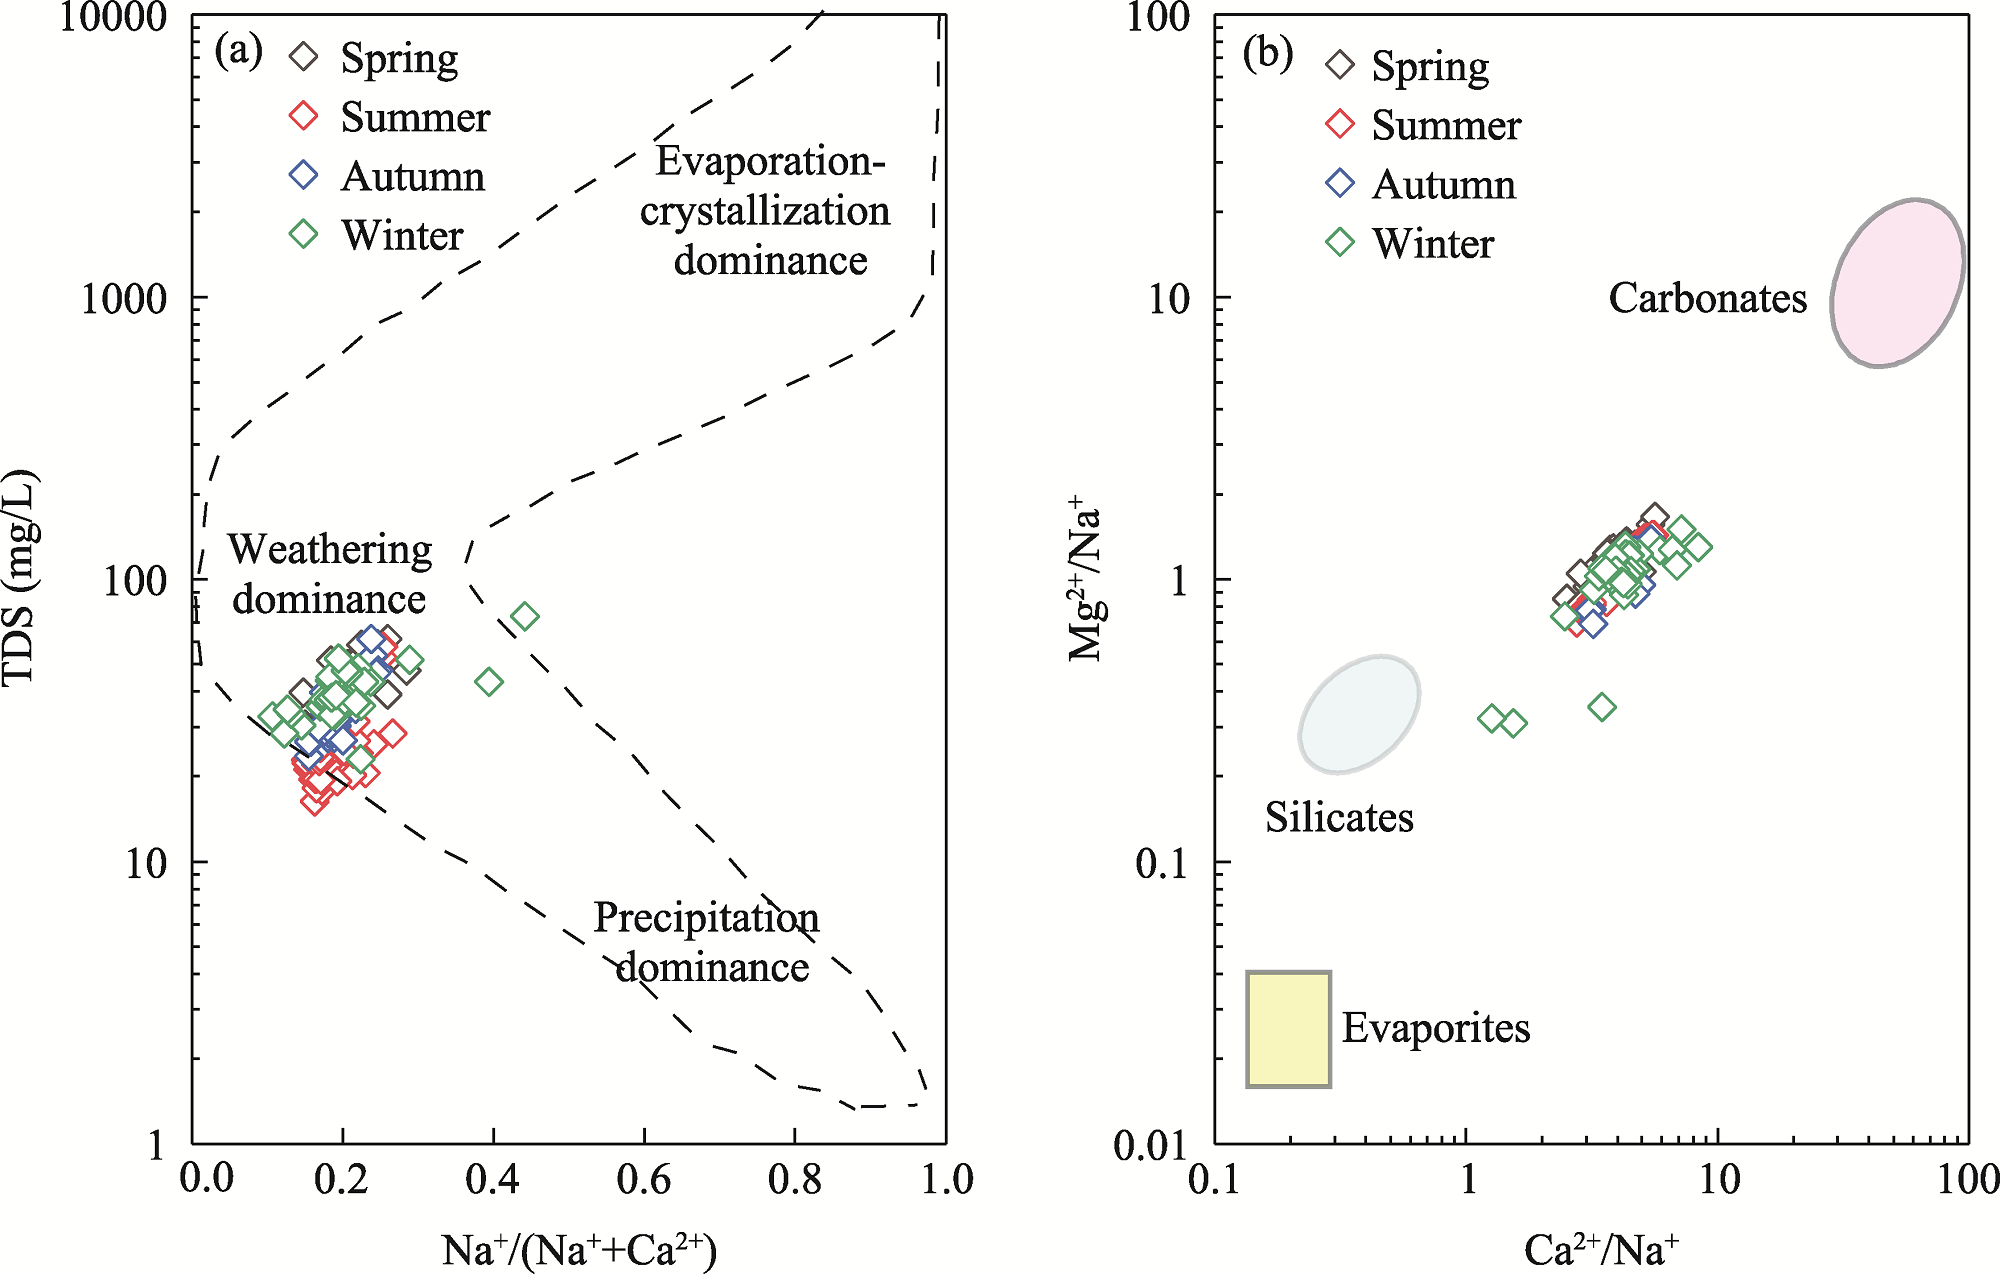
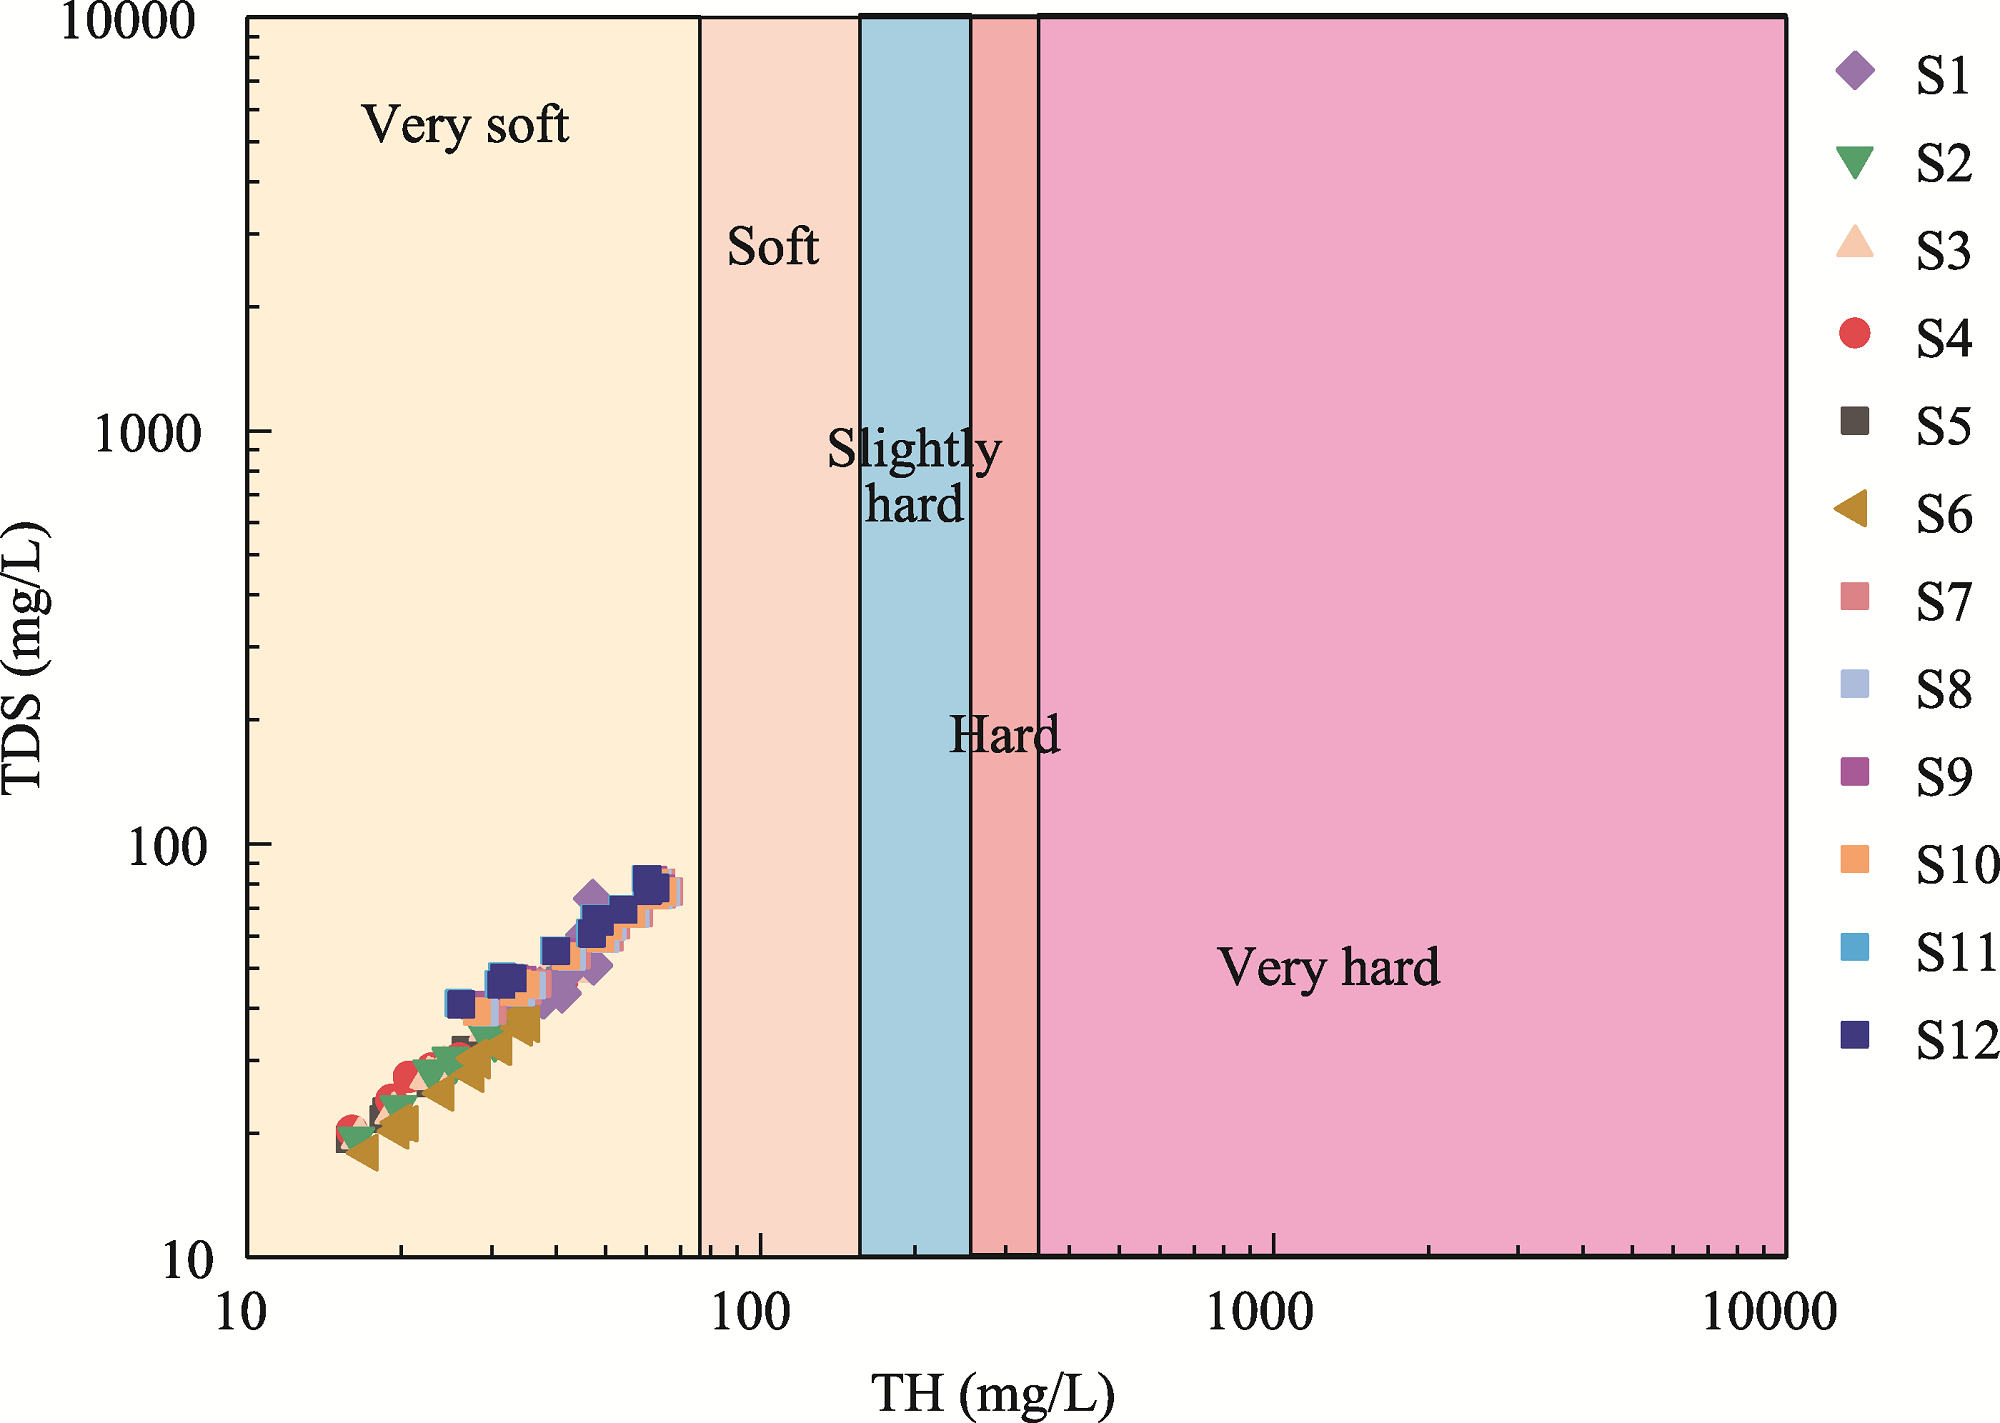
Abstract Analysis of environmental significance and hydrochemical characteristics of river water in mountainous regions is vital for ensuring water security. In this study, we collected a total of 164 water samples in the western region of the Altay Mountains, China, in 2021. We used principal component analysis and enrichment factor analysis to examine the chemical properties and spatiotemporal variations of major ions (including F-, Cl-, NO3-, SO42-, Li+, Na+, NH4+, K+, Mg2+, and Ca2+) present in river water, as well as to identify the factors influencing these variations. Additionally, we assessed the suitability of river water for drinking and irrigation purposes based on the total dissolved solids, soluble sodium percentage, sodium adsorption ratio, and total hardness. Results revealed that river water had an alkaline aquatic environment with a mean pH value of 8.00. The mean ion concentration was ranked as follows: Ca2+>SO42->Na+>NO3->Mg2+>K+>Cl->F->NH4+>Li+. Ca2+, SO42-, Na+, and NO3- occupied 83% of the total ion concentration. In addition, compared with other seasons, the spatial variation of the ion concentration in spring was obvious. An analysis of the sources of major ions revealed that these ions originated mainly from carbonate dissolution and silicate weathering. The recharge impact of precipitation and snowmelt merely influenced the concentration of Cl-, NO3-, SO42-, Ca2+, and Na+. Overall, river water was in pristine condition in terms of quality and was suitable for both irrigation and drinking. This study provides a scientific basis for sustainable management of water quality in rivers of the Altay Mountains.
|
|
Received: 21 February 2023
Published: 30 September 2023
|
|
Corresponding Authors:
* WANG Feiteng (E-mail: wangfeiteng@lzb.ac.cn)
|
|
|
| [1] |
Anshumali, Ramanathan A L. 2007. Seasonal variation in the major ion chemistry of Pandoh lake, Mandi district, Himachal Pradesh, India. Applied Geochemistry, 22(8): 1736-1747.
doi: 10.1016/j.apgeochem.2007.03.045
|
|
|
| [2] |
Chang J W, Wang N L, Li Z J, et al. 2022. Accelerated shrinkage of glaciers in the Altai Mountains from 2000 to 2020. Frontiers in Earth Science, 10: 919051, doi: 10.3389/feart.2022.919051.
doi: 10.3389/feart.2022.919051
|
|
|
| [3] |
Dekov V M, Komy Z, Araújo F, et al. 1997. Chemical composition of sediments, suspended matter, river water and ground water of the Nile (Aswan-Sohag traverse). Science of The Total Environment, 201(3): 195-210.
pmid: 9241870
|
|
|
| [4] |
Dong X Y, Zhao L J, Wang N L, et al. 2022. Spatial variations on the hydrochemistry, controls, and solute sources of surface water in the Weihe River Basin, China. Environmental Science and Pollution Research, 29(38): 57790-57807.
doi: 10.1007/s11356-022-19550-y
|
|
|
| [5] |
Feng X C, Yang Y H. 2022. Hydrochemical and stable isotopic spatiotemporal variation characteristics and their environmental significance in the Kashi River Mountain Area of Ili, Xinjiang, China. Environmental Geochemistry and Health, 44(3): 799-816.
doi: 10.1007/s10653-021-00959-2
|
|
|
| [6] |
Gaillardet J, Dupré B, Allègre C J. 1999a. Geochemistry of large river suspended sediments: Silicate weathering or recycling tracer? Geochimica et Cosmochimica Acta, 63(23-24): 4037-4051.
doi: 10.1016/S0016-7037(99)00307-5
|
|
|
| [7] |
Gaillardet J, Dupré B, Louvat P, et al. 1999b. Global silicate weathering and CO2 consumption rates deduced from the chemistry of large rivers. Chemical Geology, 159(1-4): 3-30.
doi: 10.1016/S0009-2541(99)00031-5
|
|
|
| [8] |
Galy A, France-Lanord C. 1999. Weathering processes in the Ganges-Brahmaputra basin and the riverine alkalinity budget. Chemical Geology, 159(1-4): 31-60.
doi: 10.1016/S0009-2541(99)00033-9
|
|
|
| [9] |
Gao Z Y, Lin Z J, Niu F J, et al. 2017. Hydrochemistry and controlling mechanism of lakes in permafrost regions along the Qinghai-Tibet Engineering Corridor, China. Geomorphology, 297: 159-169.
doi: 10.1016/j.geomorph.2017.09.020
|
|
|
| [10] |
Gibbs R J. 1970. Mechanisms controlling world water chemistry. Science, 170(3962): 1088-1090.
doi: 10.1126/science.170.3962.1088
pmid: 17777828
|
|
|
| [11] |
Goenster-Jordan S, Ingold M, Jannoura R, et al. 2021. Soil microbial properties of subalpine steppe soils at different grazing intensities in the Chinese Altai Mountains. Scientific Reports, 11: 1653, doi: 10.1038/s41598-021-81120-y.
doi: 10.1038/s41598-021-81120-y
pmid: 33462285
|
|
|
| [12] |
He J, Wu X, Zhang Y, et al. 2020. Management of water quality targets based on river-lake water quality response relationships for lake basins-A case study of Dianchi Lake. Environmental Research, 186: 109479, doi: 10.1016/j.envres.2020.109479.
doi: 10.1016/j.envres.2020.109479
|
|
|
| [13] |
Huang X, Sillanpaa M, Gjessing E T, et al. 2009. Water quality in the Tibetan Plateau: Major ions and trace elements in the headwaters of four major Asian rivers. Science of The Total Environment, 407(24): 6242-6254.
doi: 10.1016/j.scitotenv.2009.09.001
|
|
|
| [14] |
Iqbal J, Nazzal Y, Howari F, et al. 2018. Hydrochemical processes determining the groundwater quality for irrigation use in an arid environment: the case of Liwa aquifer, Abu Dhabi, United Arab Emirates. Groundwater for Sustainable Development, 7: 212-219.
doi: 10.1016/j.gsd.2018.06.004
|
|
|
| [15] |
Jiang L G, Yao Z J, Liu Z F, et al. 2015. Hydrochemistry and its controlling factors of rivers in the source region of the Yangtze River on the Tibetan Plateau. Journal of Geochemical Exploration, 155: 76-83.
doi: 10.1016/j.gexplo.2015.04.009
|
|
|
| [16] |
Keene W C, Pszenny A A P, Galloway J N, et al. 1986. Sea-salt corrections and interpretation of constituent ratios in marine precipitation. Journal of the Geothermal Research-Atmospheres, 91(D6): 6647-6658.
|
|
|
| [17] |
Li Q, Yang T, Qi Z M, et al. 2018. Spatiotemporal variation of snowfall to precipitation ratio and its implication on water resources by a regional climate model over Xinjiang, China. Water, 10(10): 1463, doi: 10.3390/w10101463.
doi: 10.3390/w10101463
|
|
|
| [18] |
Li X Y, Ding Y J, Han T D, et al. 2019. Seasonal controls of meltwater runoff chemistry and chemical weathering at Urumqi Glacier No.1 in central Asia. Hydrological Processes, 33(26): 3258-3281.
doi: 10.1002/hyp.v33.26
|
|
|
| [19] |
Li X Y, Wang N L, Ding Y J, et al. 2022. Globally elevated chemical weathering rates beneath glaciers. Nature Communications, 13(1): 407, doi: 10.1038/s41467-022-28032-1.
doi: 10.1038/s41467-022-28032-1
pmid: 35058445
|
|
|
| [20] |
Li Z, Xiao J, Evaristo J, et al. 2019. Spatiotemporal variations in the hydrochemical characteristics and controlling factors of streamflow and groundwater in the Wei River of China. Environmental Pollution, 254: 113006, doi: 10.1016/j.envpol.2019. 113006.
doi: 10.1016/j.envpol.2019. 113006
|
|
|
| [21] |
Li Z J, Song L L, Ma J Z. 2017. Hydrochemical characteristics and environmental significance in different ablation period in Hulugou river basin in Qilian Mountain. Environmental Earth Sciences, 76(17): 606, doi: 10.1007/s12665-017-6911-3.
doi: 10.1007/s12665-017-6911-3
|
|
|
| [22] |
Li Z J, Li Z X, Song L L, et al. 2018. Environment significance and hydrochemical characteristics of supra-permafrost water in the source region of the Yangtze River. Science of The Total Environment, 644: 1141-1151.
doi: 10.1016/j.scitotenv.2018.07.029
|
|
|
| [23] |
Li Z X, Feng Q, Liu W, et al. 2014. Study on the contribution of cryosphere to runoff in the cold alpine basin: A case study of Hulugou River Basin in the Qilian Mountains. Global and Planetary Change, 122: 345-361.
doi: 10.1016/j.gloplacha.2014.10.001
|
|
|
| [24] |
Liu C H, Shi Y F, Wang Z T, et al. 2018. Glacier Inventory of China (II):Altay Mountains. Beijing: Science Press.
|
|
|
| [25] |
Liu W, Ma L, Abuduwaili J. 2021. Water quality for agricultural irrigation and aquatic arsenic health risk in the Altay and Tianshan mountains, Central Asia. Agronomy-Basel, 11(11): 2270, doi: 10.3390/agronomy11112270.
doi: 10.3390/agronomy11112270
|
|
|
| [26] |
Ma L, Abuduwaili J, Li Y M, et al. 2019. Hydrochemical characteristics and water quality assessment for the upper reaches of Syr Darya River in Aral Sea Basin, Central Asia. Water, 11(9): 1893, doi: 10.3390/w11091893.
doi: 10.3390/w11091893
|
|
|
| [27] |
Mapoma H W T, Xie X J, Zhang L P, et al. 2016. Hydrochemical characteristics of rural community groundwater supply in Blantyre, Southern Malawi. Journal of African Earth Sciences, 114: 192-202.
doi: 10.1016/j.jafrearsci.2015.11.023
|
|
|
| [28] |
Negrel P, Allegre C J, Dupre B, et al. 1993. Erosion sources determined by inversion of major and trace-element ratios and strontium isotopic-ratios in river water-the Congo Basin case. Earth and Planetary Science Letters, 120(1-2): 59-76.
doi: 10.1016/0012-821X(93)90023-3
|
|
|
| [29] |
Niu H W, Kang S C, Shi X F, et al. 2017. Water-soluble elements in snow and ice on Mt. Yulong. Science of The Total Environment, 574: 889-900.
doi: 10.1016/j.scitotenv.2016.09.114
|
|
|
| [30] |
Okay C, Akkoyunlu B O, Tayanc M. 2002. Composition of wet deposition in Kaynarca, Turkey. Environmental Pollution, 118(3): 401-410.
pmid: 12009138
|
|
|
| [31] |
Pant R R, Zhang F, Rehman F U, et al. 2017. Spatiotemporal variations of hydrogeochemistry and its controlling factors in the Gandaki river basin, central Himalaya Nepal. Science of The Total Environment, 770: 622-623.
|
|
|
| [32] |
Piper A M. 1944. A graphic procedure in the geochemical interpretation of water-analyses. Transactions-American Geophysical Union, 25: 914-923.
doi: 10.1029/TR025i006p00914
|
|
|
| [33] |
Qin J, Wu J K, Han T D, et al. 2020. Quantitatively estimate the components of natural runoff and identify the impacting factors in a snow-fed river basin of China. Sciences in Cold and Arid Regions, 12(3): 154-164.
|
|
|
| [34] |
Qu B, Zhang Y L, Kang S C, et al. 2017. Water chemistry of the southern Tibetan Plateau: an assessment of the Yarlung Tsangpo river basin. Environmental Earth Sciences, 76(2): 74, doi: 10.1007/s12665-017-6393-3.
doi: 10.1007/s12665-017-6393-3
|
|
|
| [35] |
Qu B, Zhang Y L, Kang S C, et al. 2019. Water quality in the Tibetan Plateau: Major ions and trace elements in rivers of the "Water Tower of Asia". Science of The Total Environment, 649: 571-581.
doi: 10.1016/j.scitotenv.2018.08.316
|
|
|
| [36] |
Shaki A A, Adeloye A J. 2006. Evaluation of quantity and quality of irrigation water at Gadowa irrigation project in Murzuq basin, southwest Libya. Agricultural Water Resources Management, 84(1-2): 193-201.
|
|
|
| [37] |
Shrestha S, Kazama F. 2007. Assessment of surface water quality using multivariate statistical techniques: A case study of the Fuji river basin, Japan. Environmental Modelling & Software, 22(4): 464-475.
|
|
|
| [38] |
Stallard R F, Edmond J M. 1983. Geochemistry of the Amazon: 2. The influence of geology and weathering environment on the dissolved load. Journal of Geophysical Research Oceans, 88(C14): 9671-9688.
|
|
|
| [39] |
United Nations. 2019. Goal 6: Ensure Availability and Sustainable Management of Water and Sanitation for All. [2023-01-21]. https://sustainabledevelopment.un.org/sdg6.
|
|
|
| [40] |
Vermette S J, Drake J J, Landsberger S. 1988. Intra-urban precipitation quality: Hamilton, Canada. Water, Air, and Soil Pollution, 38: 37-53.
doi: 10.1007/BF00279584
|
|
|
| [41] |
Villegas P, Paredes V, Betancur T, et al. 2013. Assessing the hydrochemistry of the Uraba Aquifer, Colombia by principal component analysis. Journal of Geochemical Exploration, 134: 120-129.
doi: 10.1016/j.gexplo.2013.08.011
|
|
|
| [42] |
Wang J L, Jin M G, Jia B J, et al. 2015. Hydrochemical characteristics and geothermometry applications of thermal groundwater in northern Jinan, Shandong, China. Geothermics, 57: 185-195.
doi: 10.1016/j.geothermics.2015.07.002
|
|
|
| [43] |
Wang P Y, Li Z Q, Luo S F, et al. 2015. Five decades of changes in the glaciers on the Friendship Peak in the Altai Mountains, China: Changes in area and ice surface elevation. Cold Regions Science and Technology, 116: 24-31.
doi: 10.1016/j.coldregions.2015.04.002
|
|
|
| [44] |
Wen Y, Schoups G, Nick V D G. 2015. Population and Climate Pressures on Global River Water Quality. EGU General Assembly Conference Abstracts. [2023-01-21]. .
|
|
|
| [45] |
WHO. 2011. Guidelines for Drinking-Water Quality. [2023-01-21]. https://www.who.int/publications/i/item/9789241549950.
|
|
|
| [46] |
Wu H W, Wu J L, Li J, et al. 2020. Spatial variations of hydrochemistry and stable isotopes in mountainous river water from the Central Asian headwaters of the Tajikistan Pamirs. CATENA, 193: 104639, doi: 10.1016/j.catena.2020.104639.
doi: 10.1016/j.catena.2020.104639
|
|
|
| [47] |
Yapiyev V, Wade A J, Shahgedanova M, et al. 2021. The hydrochemistry and water quality of glacierized catchments in Central Asia: A review of the current status and anticipated change. Journal of Hydrology-Regional Studies, 38: 100960, doi: 10.1016/j.ejrh.2021.100960.
doi: 10.1016/j.ejrh.2021.100960
|
|
|
| [48] |
Ye H M, Yuan X Y, Ge M X, et al. 2010. Water chemistry characteristics and controlling factors in the northern rivers in the Taihu Basin. Energy Ecology and Environment, 19(1): 23-27. (in Chinese)
|
|
|
| [49] |
Yu Z L, Wu G J, Li F, et al. 2021. Glaciation enhanced chemical weathering in a cold glacial catchment, western Nyaingentanglha Mountains, central Tibetan Plateau. Journal of Hydrology, 597: 126197, doi: 10.1016/j.jhydrol.2021.126197.
doi: 10.1016/j.jhydrol.2021.126197
|
|
|
| [50] |
Zabaleta A, Martinez M, Uriarte J A, et al. 2007. Factors controlling suspended sediment yield during runoff events in small headwater catchments of the Basque Country. CATENA, 71(1): 179-190.
doi: 10.1016/j.catena.2006.06.007
|
|
|
| [51] |
Zhang G X, Sun S F, Ma Y F, et al. 2010. The response of annual runoff to the height change of the summertime 0°C level over Xinjiang. Journal of Geographical Sciences, 20(6): 833-847.
doi: 10.1007/s11442-010-0814-5
|
|
|
| [52] |
Zhang M Y, Wang S J, Wu F C, et al. 2007. Chemical compositions of wet precipitation and anthropogenic influences at a developing urban site in southeastern China. Atmospheric Research, 84(4): 311-322.
doi: 10.1016/j.atmosres.2006.09.003
|
|
|
|
Viewed |
|
|
|
Full text
|
|
|
|
|
Abstract
|
|
|
|
|
Cited |
|
|
|
|
| |
Shared |
|
|
|
|
| |
Discussed |
|
|
|
|