| Research article |
|

|
|
|
| Exploring groundwater quality in semi-arid areas of Algeria: Impacts on potable water supply and agricultural sustainability |
Noua ALLAOUA1,2, Hinda HAFID1,2, Haroun CHENCHOUNI1,3,*( ) ) |
1Laboratory of Natural Resources and Management of Sensitive Environments, Larbi Ben M'hidi University, Oum-El-Bouaghi 04000, Algeria
2Department of Nature and Life Sciences, Faculty of Exact Sciences and Nature and Life Sciences, Larbi Ben M'hidi University, Oum-El-Bouaghi 04000, Algeria
3Laboratory of Algerian Forests and Climate Change, Higher National School of Forests, Khenchela 40000, Algeria |
|
|
|
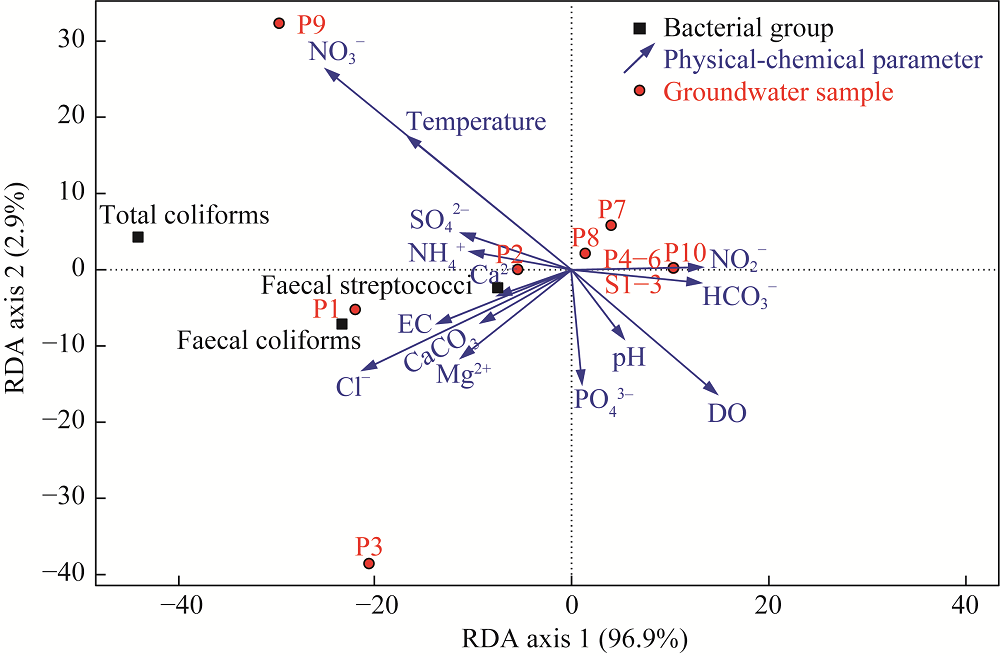
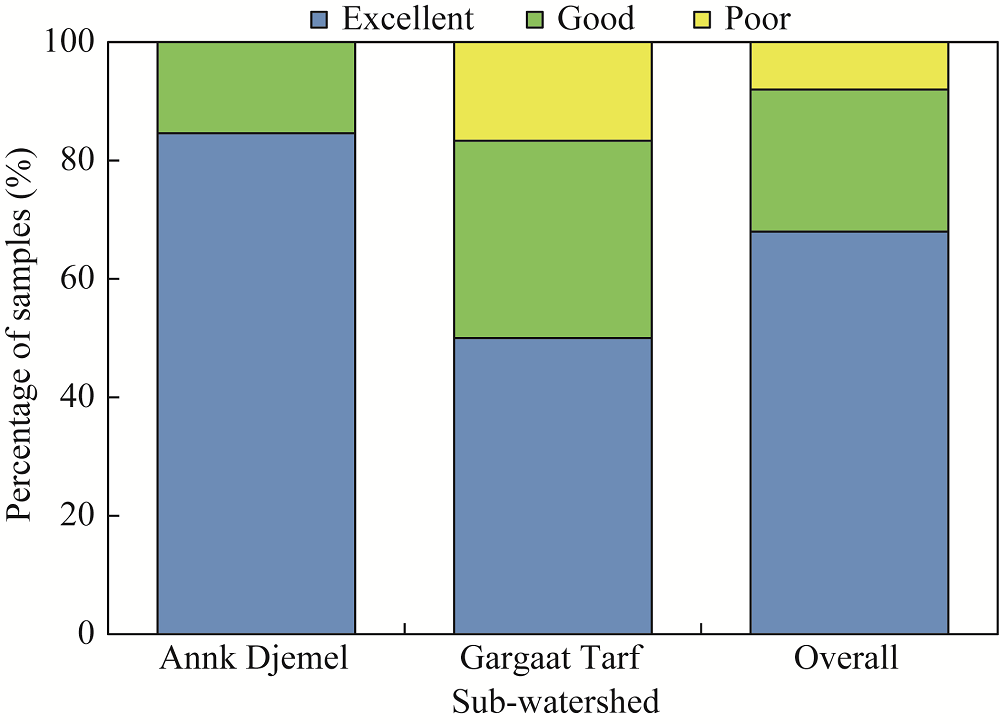
Abstract Groundwater quality assessment is important to assure safe and durable water use. In semi-arid areas of Algeria, groundwater represents the main water resource for drinking water supply of the rural population as well as for irrigation of agricultural lands. Groundwater samples from wells and springs were collected from the Gargaat Tarf and Annk Djemel sub-watersheds of the Oum El Bouaghi, Algeria, and were analyzed and compared with the World Health Organization (WHO) standards. Results showed that most of the measured physical and chemical parameters exceeded the quality limits according to the WHO standards. Groundwater had a slightly alkaline water pH (7.00-7.79), electrical conductivity>1500 µS/cm, chloride>500 mg/L, calcium>250 mg/L, and magnesium>155 mg/L. Water quality index (WQI) results showed that 68% of the area had excellent water quality, 24% of the samples fell into good category, and only 8% were of poor quality and unsuitable for human consumption. Six wells in the area showed bacterial contamination. Total coliforms (453.9 (±180.3) CFU (colony-forming units)/100 mL), fecal coliforms (243.2 (±99.2) CFU/100 mL), and fecal streptococci (77.9 (±32.0) CFU/100 mL) loads were above the standard limits set by the WHO. These results confirmed that water resources in the study area were strongly influenced by anthropogenic activities and were not recommended for consumption as drinking water.
|
|
Received: 20 October 2023
Published: 29 February 2024
|
|
Corresponding Authors:
*Haroun CHENCHOUNI (E-mail: chenchouni@gmail.com)
|
|
|
| [1] |
Abboud I A. 2018. Geochemistry and quality of groundwater of the Yarmouk Basin aquifer, North Jordan. Environmental Geochemistry and Health, 40(4): 1405-1435.
doi: 10.1007/s10653-017-0064-x
pmid: 29299860
|
|
|
| [2] |
Adamou H, Ibrahim B, Salack S, et al. 2020. Physico-chemical and bacteriological quality of groundwater in a rural area of Western Niger: A case study of Bonkoukou. Journal of Water and Health, 18(1): 77-90.
doi: 10.2166/wh.2020.082
pmid: 32129189
|
|
|
| [3] |
Ahipathy M V, Puttaiah E T. 2006. Ecological characteristics of Vrishabhavathy River in Bangalore (India). Environmental Geology, 49(8): 1217-1222.
doi: 10.1007/s00254-005-0166-0
|
|
|
| [4] |
Ahuja R, Yammani R, Bauer J A, et al. 2008. Interactions of cubilin with megalin and the product of the amnionless gene (AMN): Effect on its stability. Biochemical Journal, 410(2): 301-308.
pmid: 17990981
|
|
|
| [5] |
Alaya M B, Saidi S, Zemni T, et al. 2014. Suitability assessment of deep groundwater for drinking and irrigation use in the Djeffara aquifers (Northern Gabes, south-eastern Tunisia). Environmental Earth Sciences, 71: 3387-3421.
doi: 10.1007/s12665-013-2729-9
|
|
|
| [6] |
Alexakis D E. 2022. Applying factor analysis and the CCME water quality index for assessing groundwater quality of an Aegean Island (Rhodes, Greece). Geosciences, 12(10): 384, doi: 10.3390/geosciences12100384.
|
|
|
| [7] |
Allaoua N, Hafid H, Merzoug D, et al. 2015. Evaluation of physic-chemical quality of well water in the area of OUM El-Bouaghi (High Plains of Eastern Algeria) characterization and analysis in principal component. Advances in Environmental Biology, 9(18): 63-72.
|
|
|
| [8] |
Allaoua N, Hafid H. 2019. Biodiversity and ecology of aquatic fauna of eastern Algeria: Identification of the main groups and families of groundwater. Sarrebruck, Germany: EUE. (in French)
|
|
|
| [9] |
Atherholt T, Feerst E, Hovendon B, et al. 2003. Evaluation of indicators of fecal contamination in groundwater. Journal AWWA, 95(10): 119-131.
|
|
|
| [10] |
Avvannavar S M, Shrihari S J E M. 2008. Evaluation of water quality index for drinking purposes for river Netravathi, Mangalore, South India. Environmental monitoring and assessment, 143: 279-290.
pmid: 17912597
|
|
|
| [11] |
Barnes B, Gordon D M. 2004. Coliform dynamics and the implications for source tracking. Environmental Microbiology, 6(5): 501-509.
pmid: 15049923
|
|
|
| [12] |
Bou Saab H, Nassif N, El Samrani A G, et al. 2007. Survey of bacteriological surface water quality (Nahr Ibrahim River, Lebanon). Journal of Water Science, 20(2): 341-352.
|
|
|
| [13] |
Bouaroudj S, Menad A, Bounamous A, et al. 2019. Assessment of water quality at the largest dam in Algeria (Beni Haroun Dam) and effects of irrigation on soil characteristics of agricultural lands. Chemosphere, 219: 76-88.
doi: S0045-6535(18)32300-2
pmid: 30529856
|
|
|
| [14] |
Bozdağ A, Göçmez G. 2013. Evaluation of groundwater quality in the Cihanbeyli Basin, Konya, Central Anatolia, Turkey. Environmental Earth Sciences, 69: 921-937.
doi: 10.1007/s12665-012-1977-4
|
|
|
| [15] |
Butcher J B, Covington S. 1995. Dissolved-oxygen analysis with temperature dependence. Journal of Environmental Engineering, 121(10): 756-759.
doi: 10.1061/(ASCE)0733-9372(1995)121:10(756)
|
|
|
| [16] |
Çadraku H S. 2021. Groundwater quality assessment for irrigation: case study in the Blinaja River basin, Kosovo. Civil Engineering Journal, 7(9): 1515-1528.
doi: 10.28991/cej-2021-03091740
|
|
|
| [17] |
Calero Preciado C, Boxall J, Soria-Carrasco V, et al. 2021. Implications of climate change: How does increased water temperature influence biofilm and water quality of chlorinated drinking water distribution systems?. Frontiers in Microbiology, 12: 658927, doi: 10.3389/fmicb.2021.658927.
|
|
|
| [18] |
Chadwick D R, Chen S. 2002. Manures. In: Haygarth P M, Jarvis S C. Agriculture, Hydrology and Water Quality. Wallingford: CABI Publishing, 57-82.
|
|
|
| [19] |
Chenchouni H, Chaminé H I, Khan M F, et al. 2022. New Prospects in Environmental Geosciences and Hydrogeosciences. Cham: Springer.
|
|
|
| [20] |
Chenchouni H, Chaminé H I, Zhang Z, et al. 2023. Recent Research on Hydrogeology, Geoecology and Atmospheric Sciences. Cham: Springer.
|
|
|
| [21] |
Cheng Y, Huang T, Liu C, Zhang S. 2019. Effects of dissolved oxygen on the start-up of manganese oxides filter for catalytic oxidative removal of manganese from groundwater. Chemical Engineering Journal, 371: 88-95.
doi: 10.1016/j.cej.2019.03.252
|
|
|
| [22] |
Clark T G, Bradburn M J, Love S B, et al. 2003. Survival analysis part IV: Further concepts and methods in survival analysis. British Journal of Cancer, 89(5): 781-786.
doi: 10.1038/sj.bjc.6601117
pmid: 12942105
|
|
|
| [23] |
Daghara A, Al-Khatib I A, Al-Jabari M. 2019. Quality of drinking water from springs in Palestine: West Bank as a case study. Journal of Environmental and Public Health, 2019: 8631732, doi: 10.1155/2019/8631732.
|
|
|
| [24] |
ElKashouty M, Mohy M, Aziz A A A. 2022. Hydrogeochemical characteristics of the aquifer in southern Assir, southwest Saudi Arabia. Arabian Journal of Geosciences, 15: 73, doi: 10.1007/s12517-021-09298-z.
|
|
|
| [25] |
Etikala B, Golla V, Li P, et al. 2019. Deciphering groundwater potential zones using MIF technique and GIS: A study from Tirupati area, Chittoor District, Andhra Pradesh, India. HydroResearch, 1: 1-7, doi: 10.1016/j.hydres.2019.04.001.
|
|
|
| [26] |
Favere J, Barbosa R G, Sleutels T, et al. 2021. Safeguarding the microbial water quality from source to tap. NPJ Clean Water, 4(1): 28, doi: 10.1038/s41545-021-00118-1.
|
|
|
| [27] |
Fida M, Li P, Wang Y, et al. 2023. Water contamination and human health risks in Pakistan: A review. Exposure and Health, 15(3): 619-639.
doi: 10.1007/s12403-022-00512-1
|
|
|
| [28] |
Fister S, Robben C, Witte A K, et al. 2016. Influence of environmental factors on phage-bacteria interaction and on the efficacy and infectivity of phage P100. Frontiers in Microbiology, 7: 1152, doi: 10.3389/fmicb.2016.01152.
pmid: 27516757
|
|
|
| [29] |
Francy D S, Helsel D R, Nally R A. 2000. Occurrence and distribution of microbiological indicators in groundwater and stream water. Water Environment Research, 72(2): 152-1610.
doi: 10.2175/106143000X137220
|
|
|
| [30] |
Guemmaz F, Neffar S, Chenchouni H. 2020. Physicochemical and bacteriological quality of surface water resources receiving common wastewater effluents in drylands of Algeria. In: Negm A, Bouderbala A, Chenchouni H, et al. Water Resources in Algeria-Part II: Water Quality, Treatment, Protection and Development. Cham: Springer, 117-148.
|
|
|
| [31] |
Hacioglu N, Dulger B. 2009. Monthly variation of some physico-chemical and microbiological parameters in Biga Stream (Biga, Canakkale, Turkey). African Journal of Biotechnology, 8(9): 1929-1937.
|
|
|
| [32] |
He X, Liu Z, Qian J, et al. 2016. Distribution of nitrate in different aquifers in the urban district of Zhanjiang, China. Bulletin of Environmental Contamination and Toxicology, 97: 279-285.
doi: 10.1007/s00128-016-1822-7
pmid: 27194250
|
|
|
| [33] |
Heggy E, Bermudez V, Vermeersch M. 2022. Sustainable Energy-Water-Environment Nexus in Deserts. Cham: Springer.
|
|
|
| [34] |
Jain P, Sharma J D, Sohu D, et al. 2006. Chemical analysis of drinking water of villages of Sanganer Tehsil, Jaipur District. International Journal of Environmental Science and Technology, 2(4): 373-379.
|
|
|
| [35] |
Joseph N, Lucas J, Viswanath N, et al. 2021. Investigation of relationships between fecal contamination, cattle grazing, human recreation, and microbial source tracking markers in a mixed-land-use rangeland watershed. Water Research, 194: 116921, doi: 10.1016/j.watres.2021.116921.
|
|
|
| [36] |
Juhna T, Birzniece D, Rubulis J. 2007. Effect of phosphorus on survival of Escherichia coli in drinking water biofilms. Applied and Environmental Microbiology, 73(11): 3755-3758.
doi: 10.1128/AEM.00313-07
|
|
|
| [37] |
Kistemann T, Claßen T, Koch C, et al. 2002. Microbial load of drinking water reservoir tributaries during extreme rainfall and runoff. Applied and Environmental Microbiology, 68(5): 2188-2197.
doi: 10.1128/AEM.68.5.2188-2197.2002
pmid: 11976088
|
|
|
| [38] |
Lapworth D J, Boving T B, Kreamer D K, et al. 2022. Groundwater quality: Global threats, opportunities and realizing the potential of groundwater. Science of the Total Environment, 811: 152471, doi: 10.1016/j.scitotenv.2021.152471.
|
|
|
| [39] |
Lar U A, Gusikit R B. 2015. Environmental and health impact of potentially harmful elements distribution in the Panyam (Sura) Volcanic Province, Jos Plateau, Central Nigeria. Environmental Earth Sciences, 74: 1699-1710.
doi: 10.1007/s12665-015-4178-0
|
|
|
| [40] |
Loucif K, Neffar S, Menasria T, et al. 2020. Physico-chemical and bacteriological quality assessment of surface water at Lake Tonga in Algeria. Environmental Nanotechnology, Monitoring & Management, 13: 100284, doi: 10.1016/j.enmm.2020. 100284.
|
|
|
| [41] |
Lukubye B, Andama M. 2017. Physico-chemical quality of selected drinking water sources in Mbarara municipality, Uganda, 9(7): 707-722.
|
|
|
| [42] |
Masoud M S, El-Saraf W M, Abdel-Halim A M, et al. 2016. Rice husk and activated carbon for waste water treatment of El-Mex Bay, Alexandria Coast, Egypt. Arabian Journal of Chemistry, 9: 1590-1596.
doi: 10.1016/j.arabjc.2012.04.028
|
|
|
| [43] |
Mebarki S, Kharroubi B, Kendouci M A. 2021. Physicochemical evolution and evaluation of groundwater quality in Mougheul area (Southwest of Algeria). Applied Water Science, 11(2): 40, doi: 10.1007/s13201-021-01368-7.
|
|
|
| [44] |
Metwaly M, Elawadi E, Taha A I, et al. 2021. Geophysical studies for the aquifer properties along Wadi Nu'man, Holy Makkah Area, Saudi Arabia. Arabian Journal of Geosciences, 14(22): 2316, doi: 10.1007/s12517-021-08661-4.
|
|
|
| [45] |
Mgbenu C N, Egbueri J C. 2019. The hydrogeochemical signatures, quality indices and health risk assessment of water resources in Umunya district, Southeast Nigeria. Applied Water Science, 9(1): 22, doi: 10.1007/s13201-019-0900-5.
|
|
|
| [46] |
Mishra P C, Patel R K. 2001. Quality of drinking water in Rourkela, outside the steel township. Journal of Environment and Pollution, 8(2): 165-169.
|
|
|
| [47] |
Misstear B, Vargas C R, Lapworth D, et al. 2023. A global perspective on assessing groundwater quality. Hydrogeology Journal, 31: 11-14.
doi: 10.1007/s10040-022-02461-0
|
|
|
| [48] |
Mostafa M G, Uddin S M, Haque A B M H. 2017. Assessment of hydro-geochemistry and groundwater quality of Rajshahi City in Bangladesh. Applied Water Science, 7(8): 4663-4671.
doi: 10.1007/s13201-017-0629-y
|
|
|
| [49] |
Moussaoui M, Ababsa N, Bougoufa H, et al. 2024. Climatic drivers of wastewater treatment efficiency of wastewater treatment facilities. In: Çiner A, Barbieri M, Khan M F, et al. Recent Research on Environmental Earth Sciences, Geomorphology, Soil Science and Paleoenvironments. Cham: Springer.
|
|
|
| [50] |
Mukherjee A, Scanlon B R, Aureli A, et al. 2020. Global Groundwater:Source, Scarcity, Sustainability, Security, and Solutions. Amsterdam: Elsevier.
|
|
|
| [51] |
Naik S, Purohit K M. 2001. Studies on water quality of river Brahmani in Sundargarh district, Orissa. Indian Journal of Environment and Ecoplanning, 5(2): 397-402.
|
|
|
| [52] |
Negm A, Bouderbala A, Chenchouni H, et al. 2020a. Water Resources in Algeria-Part I:Assessment of Surface and Groundwater. The Handbook of Environmental Chemistry Series. Cham: Springer.
|
|
|
| [53] |
Negm A, Bouderbala A, Chenchouni H, et al. 2020b. Water Resources in Algeria-Part II:Water Quality, Treatment, Protection and Development. The Handbook of Environmental Chemistry Series. Cham: Springer.
|
|
|
| [54] |
Nola M, Njiné T, Djuikom E, Sikati Foko V. 2002. Faecal coliforms and faecal streptococci community in the underground water in an equatorial area in Cameroon (Central Africa): The importance of some environmental chemical factors. Water Research, 36(13): 3289-3297.
pmid: 12188127
|
|
|
| [55] |
Ntona M M, Busico G, Mastrocicco M, Kazakis N. 2022. Modeling groundwater and surface water interaction: An overview of current status and future challenges. Science of the Total Environment, 846: 157355, doi: 10.1016/j.scitotenv.2022.157355.
|
|
|
| [56] |
OJRA "Official Journal of the Algerian Republic". (2006). Executive Decree No. 06-141 defining the limit values for discharges of industrial liquid effluents. Official Journal of the Algerian Republic, 26: 4-10.
|
|
|
| [57] |
Oksanen J, Simpson G, Blanchet F, et al. 2022. Vegan: Community Ecology Package. R package version 2.6-2. [2023-01-12]. URL: https://CRAN.R-project.org/package=vegan.
|
|
|
| [58] |
Ondieki J K, Akunga D N, Warutere P N, et al. 2021. Bacteriological and physico-chemical quality of household drinking water in Kisii Town, Kisii County, Kenya. Heliyon, 7(5): e06937, doi: 10.1016/j.heliyon.2021.e06937.
|
|
|
| [59] |
Pius A, Jerome C, Sharma N. 2012. Evaluation of groundwater quality in and around Peenya industrial area of Bangalore, South India using GIS techniques. Environmental Monitoring and Assessment, 184: 4067-4077.
doi: 10.1007/s10661-011-2244-y
pmid: 21833735
|
|
|
| [60] |
Prasad B G, Narayana T S. 2004. Subsurface water quality of different sampling stations with some selected parameters at Machilipatnam Town. Nature Environment and Pollution Technology, 3: 47-50.
|
|
|
| [61] |
Qasemi M, Darvishian M, Nadimi H, et al. 2023. Characteristics, water quality index and human health risk from nitrate and fluoride in Kakhk City and its rural areas, Iran. Journal of Food Composition and Analysis, 115: 104870, doi: 10.1016/j.jfca.2022.104870.
|
|
|
| [62] |
R Core Team. 2023. R: A Language and environment for statistical computing. R Foundation for Statistical Computing, Vienna, Austria. [2022-10-09]. URL: http://www.r-project.org.
|
|
|
| [63] |
Ram A, Tiwari S K, Pandey H K, et al. 2021. Groundwater quality assessment using water quality index (WQI) under GIS framework. Applied Water Science, 11(2): 46, doi: 10.1007/s13201-021-01376-7.
|
|
|
| [64] |
Rana R, Ganguly R. 2020. Water quality indices: Challenges and applications-an overview. Arabian Journal of Geosciences, 13(22): 1190, doi: 10.1007/s12517-020-06135-7.
|
|
|
| [65] |
Rao R, Patel V. 2012. An elitist teaching-learning-based optimization algorithm for solving complex constrained optimization problems. International Journal of Industrial Engineering Computations, 3(4): 535-560.
doi: 10.5267/j.ijiec
|
|
|
| [66] |
Richardson A E, Barea J M, McNeill A M, et al. 2009. Acquisition of phosphorus and nitrogen in the rhizosphere and plant growth promotion by microorganisms. Plant and Soil, 321: 305-339.
doi: 10.1007/s11104-009-9895-2
|
|
|
| [67] |
Rodier J, Legube B, Merlet N. 2009. Water Analysis (9th ed.). Paris: Dunod. (in French)
|
|
|
| [68] |
Sadat-Noori S M, Ebrahimi K, Liaghat A M. 2014. Groundwater quality assessment using the Water Quality Index and GIS in Saveh-Nobaran aquifer, Iran. Environmental Earth Sciences, 71: 3827-3843.
doi: 10.1007/s12665-013-2770-8
|
|
|
| [69] |
Sahu P, Sikdar P K. 2008. Hydrochemical framework of the aquifer in and around East Kolkata Wetlands, West Bengal, India. Environmental Geology, 55: 823-835.
doi: 10.1007/s00254-007-1034-x
|
|
|
| [70] |
Scarsbrook M R, Fenwick G D. 2003. Preliminary assessment of crustacean distribution patterns in New Zealand groundwater aquifers. New Zealand Journal of Marine and Freshwater Research, 37(2): 405-413.
doi: 10.1080/00288330.2003.9517176
|
|
|
| [71] |
Schijven J F, Hassanizadeh S M,de Roda Husman A M. 2010. Vulnerability of unconfined aquifers to virus contamination. Water Research, 44(4): 1170-1181.
doi: 10.1016/j.watres.2010.01.002
pmid: 20110099
|
|
|
| [72] |
Şener Ş, Şener E, Davraz A. 2017. Evaluation of water quality using water quality index (WQI) method and GIS in Aksu River (SW-Turkey). Science of the Total Environment, 584: 131-144.
|
|
|
| [73] |
Shyu G S, Cheng B Y, Chiang C T, et al. 2011. Applying factor analysis combined with kriging and information entropy theory for mapping and evaluating the stability of groundwater quality variation in Taiwan. International Journal of Environmental Research and Public Health, 8(4): 1084-1109.
doi: 10.3390/ijerph8041084
|
|
|
| [74] |
Soni R, Suyal D C, Morales-Oyervides L, et al. 2023. Current Status of Fresh Water Microbiology. Cham: Springer.
|
|
|
| [75] |
Srinivas Y, Hudson Oliver D, Stanley Raj A, et al. 2013. Evaluation of groundwater quality in and around Nagercoil Town, Tamilnadu, India: An integrated geochemical and GIS approach. Applied Water Science, 3: 631-651.
doi: 10.1007/s13201-013-0109-y
|
|
|
| [76] |
Sui S, Chen C P, Tong S. 2018. Fuzzy adaptive finite-time control design for nontriangular stochastic nonlinear systems. IEEE Transactions on Fuzzy Systems, 27(1): 172-184.
doi: 10.1109/TFUZZ.2018.2882167
|
|
|
| [77] |
Tsujimura M, Abe Y, Tanaka T, et al. 2007. Stable isotopic and geochemical characteristics of groundwater in Kherlen River basin, a semi-arid region in eastern Mongolia. Journal of Hydrology, 333(1): 47-57.
doi: 10.1016/j.jhydrol.2006.07.026
|
|
|
| [78] |
Valenca R, Garcia L, Espinosa C, et al. 2022. Can water composition and weather factors predict fecal indicator bacteria removal in retention ponds in variable weather conditions?. Science of the Total Environment, 838(3): 156410, doi: 10.1016/j.scitotenv.2022.156410.
|
|
|
| [79] |
Wei T, Simko V. 2021. R package 'corrplot': Visualization of a correlation matrix (R package version 0.92). [2022-11-29]. URL: https://github.com/taiyun/corrplot.
|
|
|
| [80] |
WHO (World Health Organization). 2017. Guidelines for Drinking-water Quality (4th ed.). Geneva: World Health Organization.
|
|
|
| [81] |
Zhang D, Wang P, Cui R, et al. 2022. Electrical conductivity and dissolved oxygen as predictors of nitrate concentrations in shallow groundwater in Erhai Lake region. Science of the Total Environment, 802: 149879, doi: 10.1016/j.scitotenv.2021.149879.
|
|
|
|
Viewed |
|
|
|
Full text
|
|
|
|
|
Abstract
|
|
|
|
|
Cited |
|
|
|
|
| |
Shared |
|
|
|
|
| |
Discussed |
|
|
|
|