1Chinese Academy of Science, Northwest Institute of Eco-environment & Resources, Lanzhou 730000, China 2College of Geography and Environment Science, Northwest Normal University, Lanzhou 730070, China
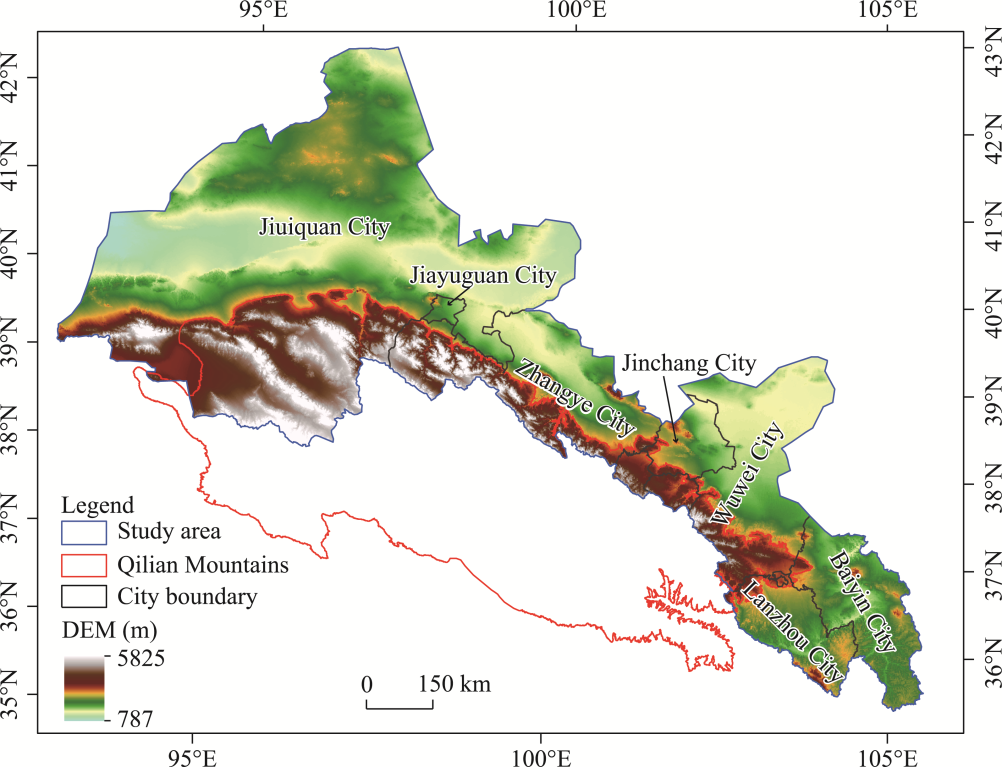
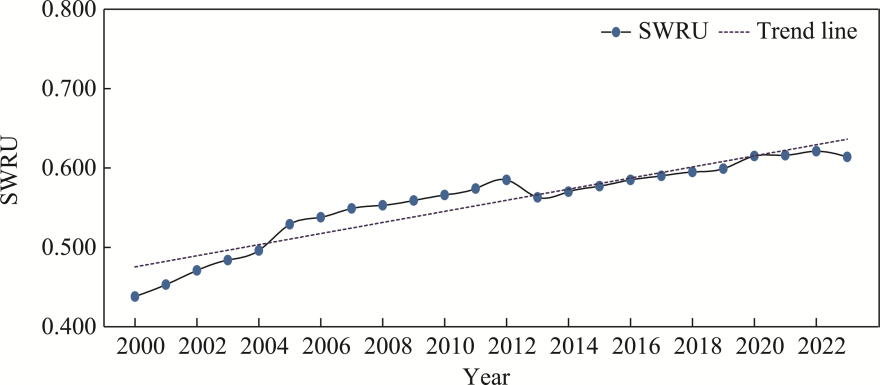
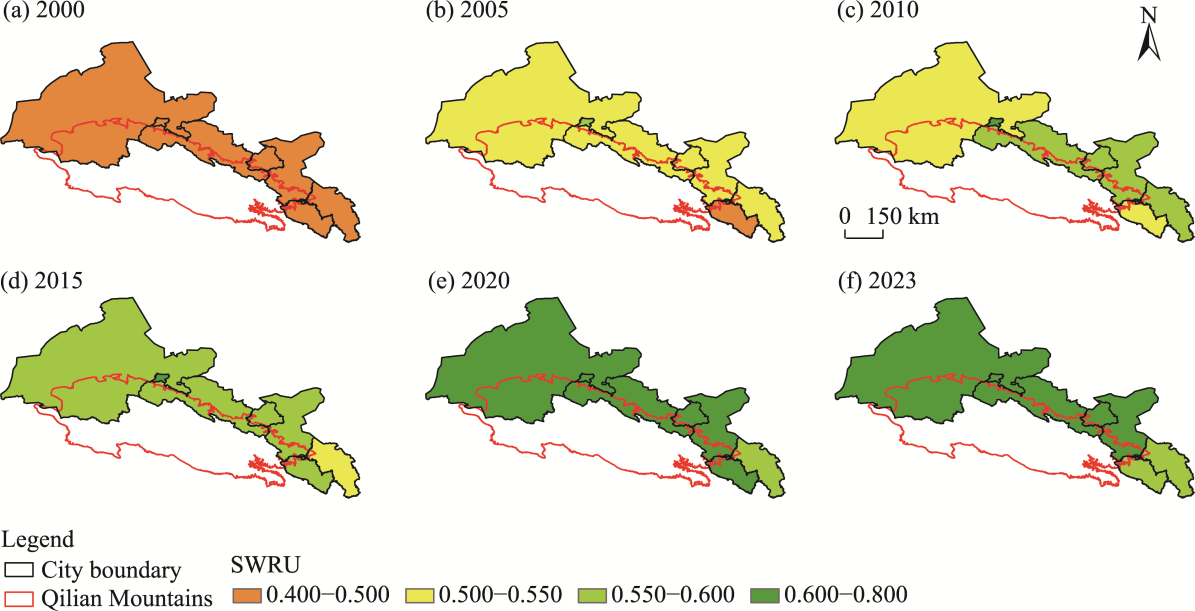
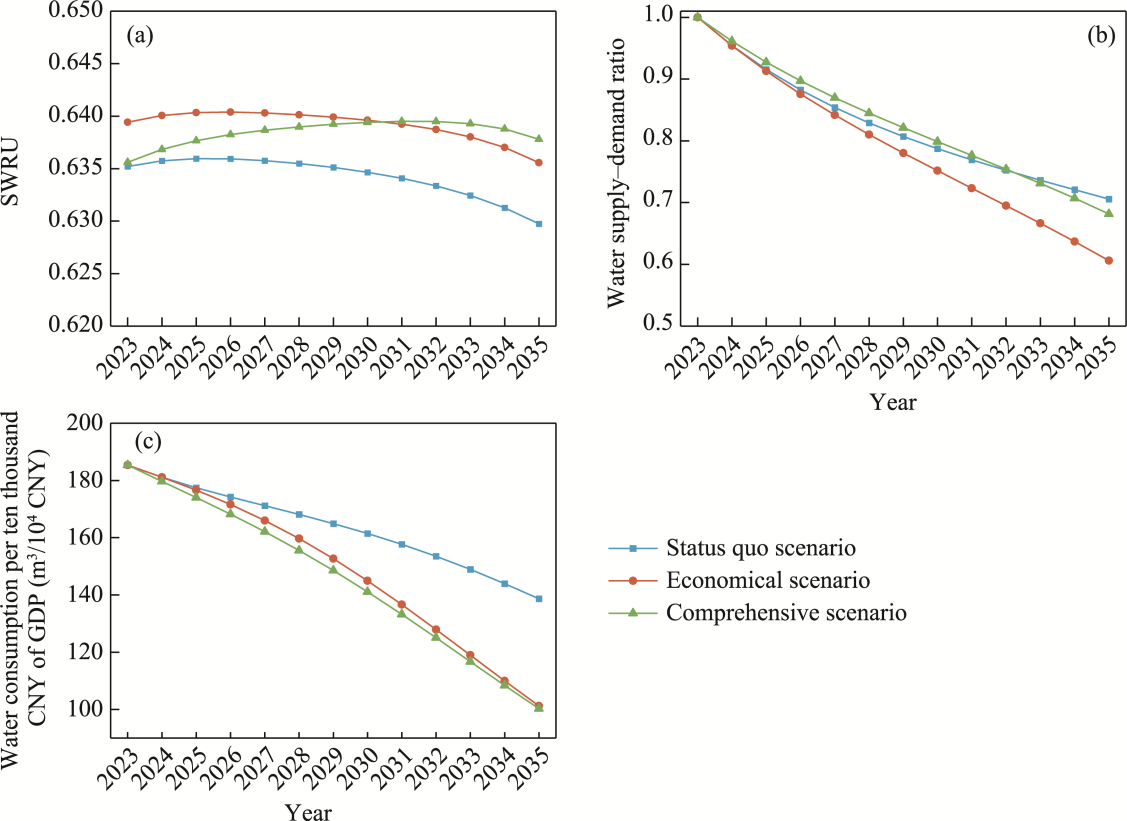
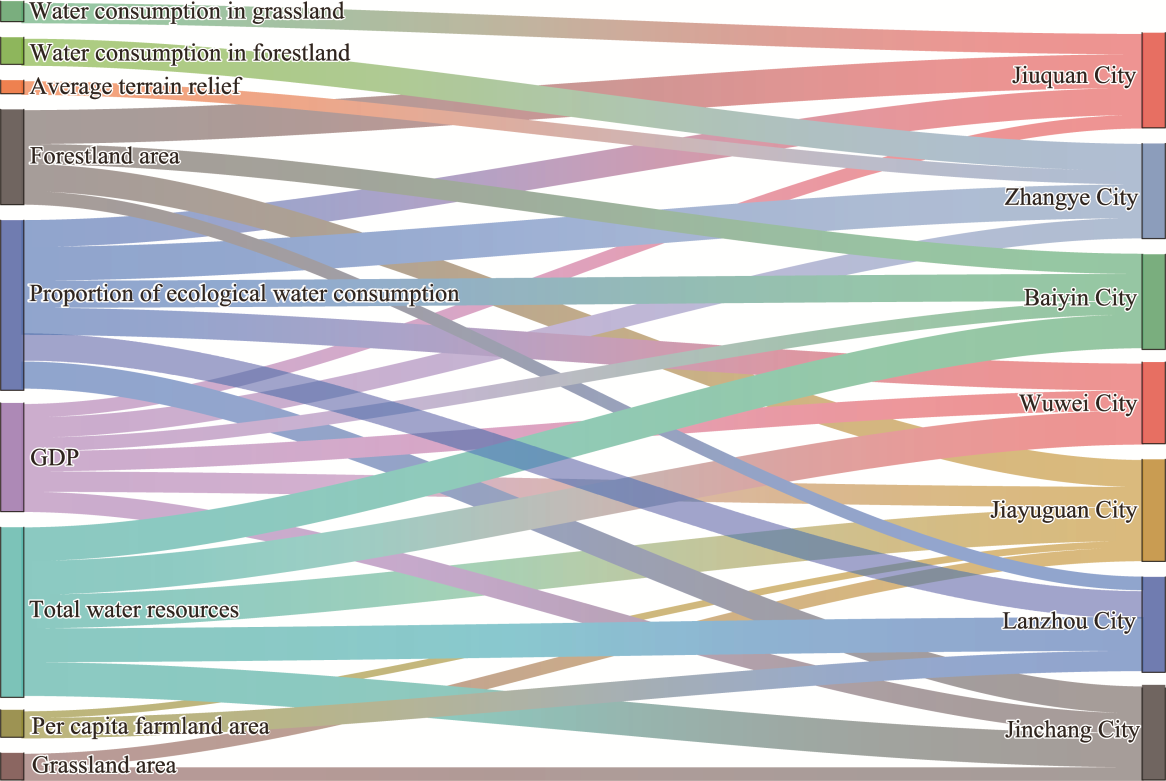
The exploration of sustainable water resource development is pivotal for ensuring regional economic and social advancement, as well as maintaining ecological balance. However, scant research has holistically evaluated ecological, living, and production water uses through the "community of life" lens. This study developed a sustainable water resource utilization (SWRU) evaluation index system for water resources in the Gansu region of Qilian Mountains from 2000 to 2023. We adopted the "three-life" water use approach within the "community of life" and conducted a complete evaluation of the existing state of SWRU in the study area. We further developed a simulation model using system dynamics (SD) approaches for status quo, economic, and comprehensive multi-scenario forecasting, and employed the obstacle degree model to determine the parameters influencing SWRU. The findings revealed that the SWRU in the Gansu section of Qilian Mountains has advanced from a basic phase (0.438) to a commendable level (0.614), with a spatial distribution of "high in the west and low in the east". The SD simulation results indicated that the comprehensive scenario achieves the highest SWRU value (0.638), outperforming the economic (0.636) and status quo (0.630) scenarios. In the short term, a comprehensive scenario can support regional sustainable development; however, it has the potential to exacerbate the supply-demand conflict in the long term, necessitating additional refinement of the water resource allocation system. Proportion of ecological water consumption (obstacle degree of 14.388%), gross domestic product (GDP; 12.475%), and total water resources (12.019%) have been highlighted as the primary obstacle factors on SWRU. Future strategies should focus on optimizing resource allocation to provide a high-quality ecological product supply, as well as merging ecological preservation with industrial advancement to support the long-term synergistic development of the living community.
XU Hua, REN Heng, ZHOU Tao, JIANG Shengji, ZHAO Wenzhi. Sustainable water resource management in the Gansu region of Qilian Mountains. Journal of Arid Land, 2026, 18(6): 949-967.
Fig. 1Overview of the Gansu region of Qilian Mountains based on the digital elevation model (DEM). The boundary is based on the standard map (GS(2024)0650) of the Map Service System (https://bzdt.ch.mnr.gov.cn/), and the boundary has not been modified.
Target layer
System layer
Index layer
Index attribute
Wj1
Wj2
Wj
Wj*
Level of SWRU
Ecological function
Average terrain relief (m)
-
0.060
0.024
0.042
0.459
Forestland area (hm2)
+
0.040
0.082
0.061
Water consumption in forestland (109 m3)
-
0.065
0.063
0.064
Total water resources (109 m3)
+
0.033
0.102
0.068
Proportion of ecological water consumption (%)
+
0.044
0.087
0.066
Water supply-demand ratio
+
0.068
0.002
0.035
Grassland area (hm2)
+
0.059
0.042
0.051
Water consumption in grassland (109 m3)
-
0.066
0.084
0.075
Production function
Water consumption per ten thousand CNY of GDP (m3/104 CNY)
-
0.067
0.078
0.072
0.369
Per capita farmland area (hm2)
+
0.056
0.046
0.051
GDP (104 CNY)
+
0.048
0.088
0.068
Water consumption in farmland irrigation (109 m3)
-
0.064
0.047
0.056
Water consumption per ten thousand CNY of secondary industry output value (109 m3)
-
0.066
0.070
0.068
Water consumption per ten thousand CNY of tertiary industry output value (109 m3)
-
0.066
0.034
0.050
Living function
Proportion of domestic water consumption (%)
-
0.067
0.055
0.061
0.173
Urbanization rate (%)
+
0.063
0.027
0.045
Population density (persons/km2)
-
0.066
0.068
0.067
Table 1 Evaluation index system of the sustainable water resource utilization (SWRU)
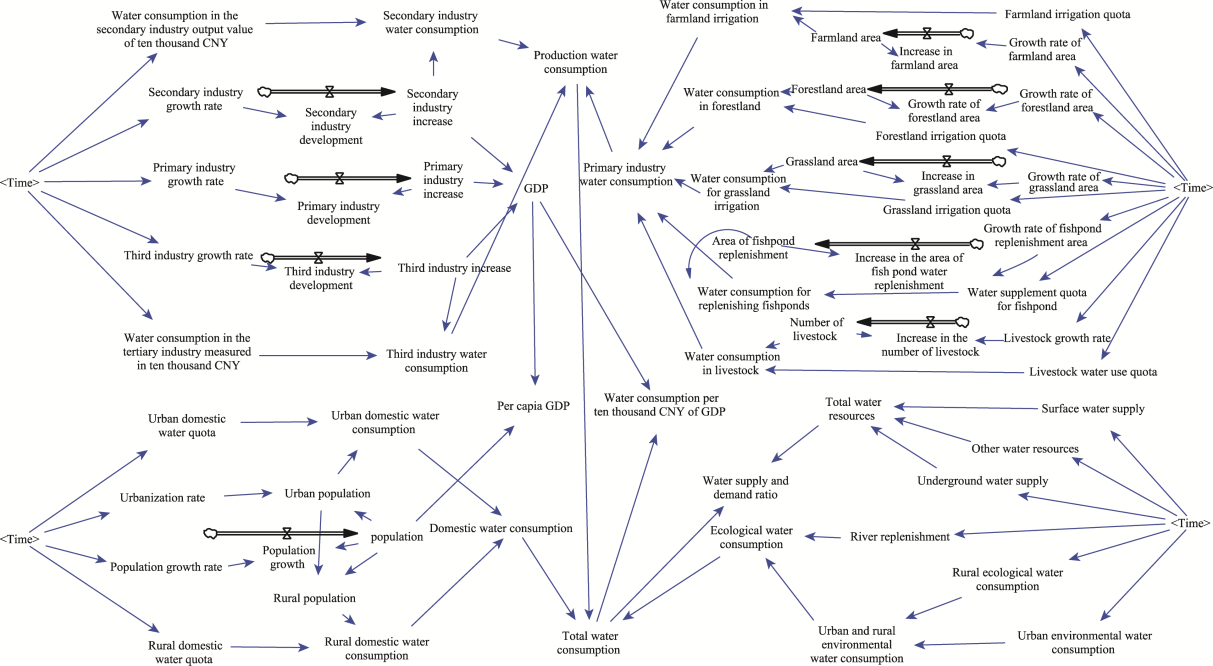
Fig. 2System dynamics (SD) model flowchart. GDP, gross domestic product. <Time> denotes the temporal attributes defined by the SD model for simulation, which is used to establish the simulation timeframe and assist in setting the time step. Black arrows represent flow, directly causing changes in stock levels. Blue arrows indicate information flow within the SD model, transmitting signals only.
Index
Year
Historical value
Simulated value
Error (%)
Population (×104 persons)
2017
122.930
122.930
0.000
2018
123.380
123.380
0.000
2019
123.760
123.760
0.000
2020
113.100
113.100
0.000
2021
112.250
112.250
0.000
2022
112.010
112.010
0.000
GDP (×109 CNY)
2017
404.100
404.100
0.000
2018
407.707
407.707
0.000
2019
448.730
448.730
0.000
2020
467.050
467.060
-0.002
2021
526.230
526.220
0.002
2022
581.500
581.500
0.000
Production water consumption (×109 m3)
2017
21.061
21.061
0.000
2018
19.614
19.614
0.000
2019
19.938
19.938
0.000
2020
19.409
19.363
0.237
2021
19.219
19.239
-0.104
2022
18.558
18.558
0.000
The average value of the absolute error
0.019
Table 2 Tests of historical errors
Parameter
Status quo scenario
Economic scenario
Comprehensive scenario
Urbanization rate (%)
Data in 2023
1.2 times the status quo scenario
1.1 times the status quo scenario
Population growth rate (‰)
Data in 2023
Same as the status quo scenario
Same as the status quo scenario
Per capita domestic water consumption quota in urban areas (m3/person)
Data in 2023
Same as the status quo scenario
0.9 times the status quo scenario
Rural per capita domestic water quota (m3/person)
Data in 2023
Same as the status quo scenario
0.9 times the status quo scenario
Growth rate of farmland area (%)
Average from 2017 to 2023
1.6 times the status quo scenario
1.6 times the status quo scenario
Farmland irrigation quota (m3/hm2)
Data in 2023
Same as the status quo scenario
0.9 times the status quo scenario
Growth rate of forestland area (%)
Average from 2017 to 2023
1.6 times the status quo scenario
1.6 times the status quo scenario
Forestland irrigation quota (m3/hm2)
Data in 2023
Same as the status quo scenario
0.9 times the status quo scenario
Growth rate of grassland area (%)
Average from 2017 to 2023
1.6 times the status quo scenario
1.6 times the status quo scenario
Grassland irrigation quota (m3/hm2)
Data in 2023
Same as the status quo scenario
0.9 times the status quo scenario
Growth rate of water supplement area of fishpond (%)
Average from 2017 to 2023
1.6 times the status quo scenario
1.6 times the status quo scenario
Water supplement quota for fishpond (m3/hm2)
Data in 2023
Same as the status quo scenario
0.9 times the status quo scenario
Livestock growth rate (%)
Average from 2017 to 2023
1.6 times the status quo scenario
1.6 times the status quo scenario
Livestock water use quota (m3/head)
Data in 2023
Same as the status quo scenario
0.9 times the status quo scenario
Water supplement of river course (109 m3)
Data in 2023
Same as the status quo scenario
Same as the status quo scenario
Urban environmental water consumption (109 m3)
Data in 2023
Same as the status quo scenario
Same as the status quo scenario
Rural ecological water consumption (109 m3)
Data in 2023
Same as the status quo scenario
Same as the status quo scenario
Surface water supply (109 m3)
Gansu Province Water Security Guarantee Plan
Same as the status quo scenario
Same as the status quo scenario
Underground water supply (109 m3)
Gansu Province Water Security Guarantee Plan
Same as the status quo scenario
Same as the status quo scenario
Other water consumption (109 m3)
Gansu Province Water Security Guarantee Plan
Same as the status quo scenario
Same as the status quo scenario
Growth rate of primary industry (%)
Average from 2017 to 2023
2.0 times the status quo scenario
1.8 times the status quo scenario
Growth rate of the secondary industry (%)
Average from 2017 to 2023
2.0 times the status quo scenario
1.8 times the status quo scenario
Growth rate of the tertiary industry (%)
Average from 2017 to 2023
2.0 times the status quo scenario
1.8 times the status quo scenario
Water consumption per ten thousand CNY of secondary industry output value (109 m3)
Data in 2023
Same as the status quo scenario
0.9 times the status quo scenario
Water consumption per ten thousand CNY of tertiary industry output value (109 m3)
Data in 2023
Same as the status quo scenario
0.9 times the status quo scenario
Table 3 Parameters for each scenario used in the study
Fig. 3Temporal variation in sustainable water resource utilization (SWRU) in the study area from 2000 to 2023
Fig. 4Spatial variations of SWRU in the study area in 2000 (a), 2005 (b), 2010 (c), 2015 (d), 2020 (e), and 2023 (f)
Fig. 5Temporal variations in SWRU (a), water supply-demand ratio (b), and water consumption per ten thousand CNY of GDP under different scenarios from 2023 to 2035. Note that 2023 is the base year, and the SD simulation period is 2024-2035.
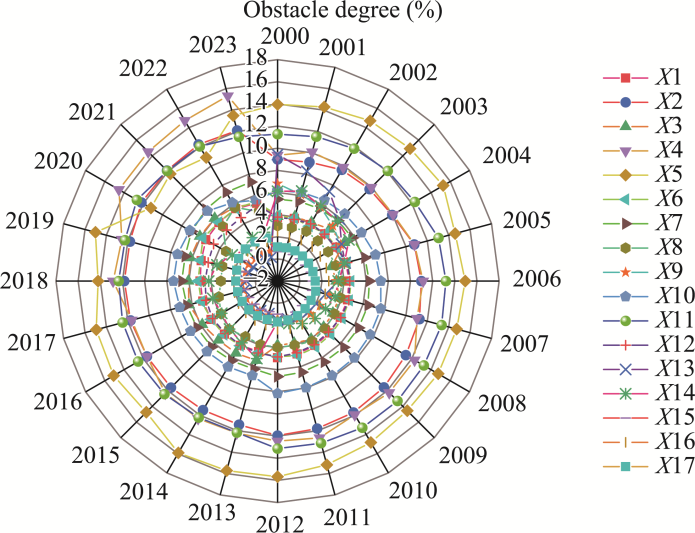
Fig. 6Temporal variations in the obstacle degree of various obstacle factors. X1, average terrain relief; X2, forestland area; X3, water consumption in forestland; X4, total water resources; X5, proportion of ecological water consumption; X6, water supply-demand ratio; X7, grassland area; X8, water consumption in grassland; X9, water consumption per ten thousand CNY of GDP; X10, per capita farmland area; X11, GDP; X12, water consumption in farmland irrigation; X13, Water consumption per ten thousand CNY of secondary industry output value; X14, Water consumption per ten thousand CNY of tertiary industry output value; X15, proportion of domestic water consumption; X16, urbanization rate; X17, population density.
Fig. 7Primary obstacle factors (with obstacle degrees exceeding 10.000%) for each city in the study area
[1]
Ai S T, Shah S A, Cai Y, et al. 2024. Lake pulses driven by glacier melting and climate variability. Scientific Reports, 14(1): 31623, doi: 10.1038/s41598-024-78660-4.
[2]
Araza A, Perez M, Cruz R V, et al. 2020. Probable streamflow changes and its associated risk to the water resources of Abuan watershed, Philippines caused by climate change and land use changes. Stochastic Environmental Research and Risk Assessment, 35: 389-404.
doi: 10.1007/s00477-020-01953-3
[3]
Bai J, Li J L, Bao A M, et al. 2021. Spatial-temporal variations of ecological vulnerability in the Tarim River Basin, Northwest China. Journal of Arid Land, 13(8): 814-834.
doi: 10.1007/s40333-021-0079-0
[4]
Cui J P, Ding J Z, Lian X, et al. 2024. Observational constraints and attribution of global plant transpiration changes over the past four decades. Geophysical Research Letters, 51(11): e2024GL108302, doi: 10.1029/2024GL108302.
[5]
Deng M J. 2018. "Three Water Lines" strategy: Its spatial patterns and effects on water resources allocation in northwest China. Acta Geographica Sinica, 73(7): 1189-1203. (in Chinese)
doi: 10.11821/dlxb201807001
[6]
Ding Y, Li X, Wang D, et al. 2023. Study on spatial and temporal differences of water resource sustainable development and its influencing factors in the Yellow River Basin, China. Sustainability, 15(19): 14316, doi: 10.3390/su151914316.
[7]
Dong J Q, Liu X C, Li Z L. 2025. Assessment of sustainability of water resource utilization on the northern slope of Tianshan Mountains based on grey water footprint. South-to-North Water Transfers and Water Science & Technology, 23(1): 69-78. (in Chinese)
[8]
Du H J, Deng Q Z, Long Y H, et al. 2023. Sustainable utilization and obstacle factors of water resource in Jiangxi Province. Bulletin of Soil and Water Conservation, 43(6): 200-208. (in Chinese)
[9]
Gansu Provincial Bureau of Statistics. 2000-2023. Gansu Statistical Yearbook. Beijing: China Statistics Press. (in Chinese)
[10]
Gansu Provincial Department of Water Resources. 2000-2023. Gansu Water Resources Bulletin. Lanzhou: Gansu Provincial Department of Water Resources. (in Chinese)
[11]
Guo R, Liu W, Li Z X, et al. 2023. An analysis on the land use change characteristics and driving forces in Gansu part of the Qilian Mountain. Journal of Desert Research, 43(3): 188-198. (in Chinese)
doi: 10.7522/j.issn.1000-694X.2022.00123
[12]
Irandoost E, Ghorbanpour A, Jamkhaneh H B, et al. 2025. Sustainable-circular water resources management in the mining industry using system dynamics modeling. Water Resources and Industry, 34: 100313, doi: 10.1016/j.wri.2025.100313.
[13]
Jia Y X, Zhang Z, Huang C H, et al. 2025. Analysis of water source conservation driving factors based on machine learning. Sustainability, 17(4): 1713, doi: 10.3390/su17041713.
[14]
Jiang H Y, He G. 2023. Analysis of spatial and temporal evolution of regional water resources carrying capacity and influencing factors—Anhui Province as an example. Sustainability, 15(14): 11255, doi: 10.3390/su151914316.
[15]
Jiang J. 2024. Research on the mechanism of green industry investment to promote sustainable utilization of water resources. International Journal of Low-Carbon Technologies, 19: 2709-2716.
doi: 10.1093/ijlct/ctae212
[16]
Jing P R, Sheng J B, Hu T S, et al. 2022. Spatiotemporal evolution of sustainable utilization of water resources in the Yangtze River Economic Belt based on an integrated water ecological footprint model. Journal of Cleaner Production, 358: 132035, doi: 10.1016/j.jenvman.2024.121846.
[17]
Li J S, Sun W, Li M Y, et al. 2021a. Coupling coordination degree of production, living and ecological spaces and its influencing factors in the Yellow River Basin. Journal of Cleaner Production, 298: 126803, doi: 10.1016/j.jclepro.2021.12680.
[18]
Li Y X, Xue D Q, Song Y Y. 2021b. Spatio-temporal characteristics and trend warnings of water resources carrying capacity in China. Resources and Environment in the Yangtze Basin, 30(7): 1574-1584. (in Chinese)
[19]
Liu Y Y. 2022. Differentiation and analyses of the concepts and characteristics of ecological assets and ecosystem services of grasslands. Pratacultural Science, 39(4): 795-805. (in Chinese)
[20]
Ma H L, Xiang H L, Pang Q H. 2025. The impact of new quality productivity development on water resource utilization efficiency in China. Resources Science, 47(3): 485-500. (in Chinese)
doi: 10.18402/resci.2025.03.05
[21]
Ma R R, Huang Y H, Zhou W, et al. 2019. Exploration and practice of ecological protection and restoration about mountains-rivers-forests-farmlands-lakes-grasslands in the Qilian Mountains. Acta Ecologica Sinica, 39(23): 8990-8997. (in Chinese)
[22]
Qi X F, Li W P, Zheng Y J, et al. 2023. Coupling simulation and prediction of sustainable utilization of water resources in an arid inland river basin under climate change. Water, 15(18): 3232, doi: 10.3390/w15183232.
[23]
Ren H, Zhao W Z, Wang X P, et al. 2024. System cognition and key challenges for the future of Qilian Mountains community of life: A case study of Gansu Province. Advances in Earth Science, 39: 957-967. (in Chinese)
doi: 10.11867/j.issn.1001-8166.2024.073
[24]
Shan S H, Ni H Z, Wang D X. 2023. Measurement of industrial water resource utilization efficiency and its spatiotemporal differentiation analysis in the Yellow River Basin. Journal of China Hydrology, 43(3): 71-75. (in Chinese)
[25]
Song Y F, Wu W C, Zhang Y F, et al. 2024. Optimizing sustainability of land resource utilization: a comprehensive analysis of practices in the Tarim Basin, China. International Journal of Agricultural Sustainability, 22(1): 2335140, doi: 10.1080/14735903.2024.2335140.
[26]
Sun X G, Peng A B, Hu S D, et al. 2024. Dynamic successive assessment of water resource carrying capacity based on system dynamics model and variable fuzzy pattern recognition method. Water, 16(2): 304, doi: 10.3390/w16020304.
[27]
Swallow B M, Sang J K, Nyabenge M, et al. 2009. Tradeoffs, synergies and traps among ecosystem services in the Lake Victoria basin of East Africa. Environmental Science & Policy, 12(4): 504-519.
[28]
Tao M Y, Zhao Y Z, Jiang Q X, et al. 2025. Study on the coupled coordination of water resources consumption and economic development in Heilongjiang province under different scenarios based on SD model. Agricultural Water Management, 315: 109560, doi: 10.1016/j.agwat.2025.109560.
[29]
Tian G L, Zhao Q Y, Wu Z. 2022. Water-saving effects of water right reform under the rural vitalization strategy and its impact on water efficiency. China Population, Resources and Environment, 32(12): 193-204. (in Chinese)
[30]
Tong H L, Chen Q B, Zhang X. 2024. Influence of ecological function protection zone on the water conservation in Gansu-Qinghai Contiguous Region of the upper Yellow River. Journal of Mountain Science, 21(4): 1345-1357.
doi: 10.1007/s11629-023-8450-6
[31]
Wang D, Li K, Li H J, et al. 2025. Water resource utilization and future supply-demand scenarios in energy cities of semi-arid regions. Scientific Reports, 15(1): 5005, doi: 10.1038/s41598-025-85458-5.
[32]
Wang L G, Zhu R, Chen Z X, et al. 2022. Coupling effect of water-soil resources in Hexi Area of Gansu, China in 2000-2019. Journal of Desert Research, 42(2): 44-53. (in Chinese)
[33]
Wang X, Lian W H, Wei J F, et al. 2023. Status and problems of water resources on the Qinghai-Tibet Plateau. Advances in Water Science, 34(5): 812-826. (in Chinese)
[34]
Wang X K, Dong Z C, Xu W, et al. 2019. Study on spatial and temporal distribution characteristics of coordinated development degree among regional water resources, social economy, and ecological environment systems. International Journal of Environmental Research and Public Health, 16(21): 4213, doi: 10.3390/ijerph16214213.
[35]
Wu H L, Li X Y, An H. 2022. Decoupling of water resources utilization and coordinated economic development in China's Hexi Corridor based on ecological water resource footprint. Environmental Science and Pollution Research, 29(60): 90936-90947.
doi: 10.1007/s11356-022-21732-7
[36]
Xiong M Q, Leng G Y. 2024. Global soil water erosion responses to climate and land use changes. CATENA, 241: 108043, doi: 10.1016/j.catena.2024.108043.
[37]
Yang L, Hao Y R, Wang B, et al. 2025. Evaluation of the water resources carrying capacity in Shaanxi Province based on DPSIRM-TOPSIS analysis. Ecological Indicators, 173: 113369, doi: 10.1016/j.ecolind.2025.113369.
[38]
Yang S K, Zhao Z, Wang S B, et al. 2024. Hydrogeochemical insights into the sustainable prospects of groundwater resources in an alpine irrigation area on Tibetan Plateau. Sustainability, 16(21): 9229, doi: 10.3390/su16219229.
[39]
Yuan S W, Li X, Du E, et al. 2021. Progress and prospect of agent-based modeling for water resources management. Advances in Earth Science, 36(9): 899-910. (in Chinese)
doi: 10.11867/j.issn.1001-8166.2021.089
[40]
Zeng Y J, Liu D D, Guo S L, et al. 2022. A system dynamic model to quantify the impacts of water resources allocation on water-energy-food-society (WEFS) nexus. Hydrology and Earth System Sciences, 26(15): 3965-3988.
doi: 10.5194/hess-26-3965-2022
[41]
Zhang H Q, Wang H, Chen J, et al. 2023. Study on spatial-temporal characteristics and driving factors of agricultural water use in the Yangtze River economic zone based on the perspectives of water-energy-food-land nexus. Resources and Environment in the Yangtze Basin, 32(8): 1748-1759. (in Chinese)
[42]
Zhang X F, Jin X, Bai X, et al. 2019a. Impacts of water resource planning on regional water consumption pattern: A case study in Dunhuang Oasis, China. Journal of Arid Land, 11(5): 713-728.
doi: 10.1007/s40333-019-0092-8
[43]
Zhang X W, Duan X C. 2024. Evaluating water resource carrying capacity in Pearl River-West River economic Belt based on portfolio weights and GRA-TOPSIS-CCDM. Ecological Indicators, 161: 111942, doi: 10.1016/j.ecolind.2024.111942.
[44]
Zhang X X, Liu J G, Zhao X, et al. 2019b. Linking physical water consumption with virtual water consumption: Methodology, application and implications. Journal of Cleaner Production, 228: 1206-1217.
doi: 10.1016/j.jclepro.2019.04.297
[45]
Zhang Y, Khan S U, Swallow B, et al. 2022. Coupling coordination analysis of China's water resources utilization efficiency and economic development level. Journal of Cleaner Production, 373: 133874, doi: 10.1016/j.jclepro.2022.133874.
[46]
Zhao L C, Zhao C Z, Wen J. 2021. Dynamic couping and spatia, pattern of urbanization and resource-environment carrying capacity in Hexi Corridor. Chinese Journal of Ecology 40( 1): 199-208. (in Chinese)
[47]
Zuo Q T. 2023. Research on sustainable utilization of water resources and its contribution to modern water control in China. Advances in Earth Science, 38(1): 1-8. (in Chinese)
doi: 10.11867/j.issn.1001-8166.2022.083