| Research article |
|


|
|
|
| Tree-ring δ15N of Qinghai spruce in the central Qilian Mountains of China: Is pre-treatment of wood samples necessary? |
WANG Ziyi1, LIU Xiaohong1,2,3,*( ), WANG Keyi1,4, ZENG Xiaomin1, ZHANG Yu1, GE Wensen1, KANG Huhu2, LU Qiangqiang1 ), WANG Keyi1,4, ZENG Xiaomin1, ZHANG Yu1, GE Wensen1, KANG Huhu2, LU Qiangqiang1 |
1School of Geography and Tourism, Shaanxi Normal University, Xi'an 710119, China
2State Key Laboratory of Cryospheric Science, Northwest Institute of Eco-Environment and Resources, Chinese Academy of Sciences, Lanzhou 730000, China
3Qilian Mountain National Park Research Center (Qinghai), Xining 810008, China
4School of Earth System Science, Tianjin University, Tianjin 300072, China |
|
|
|
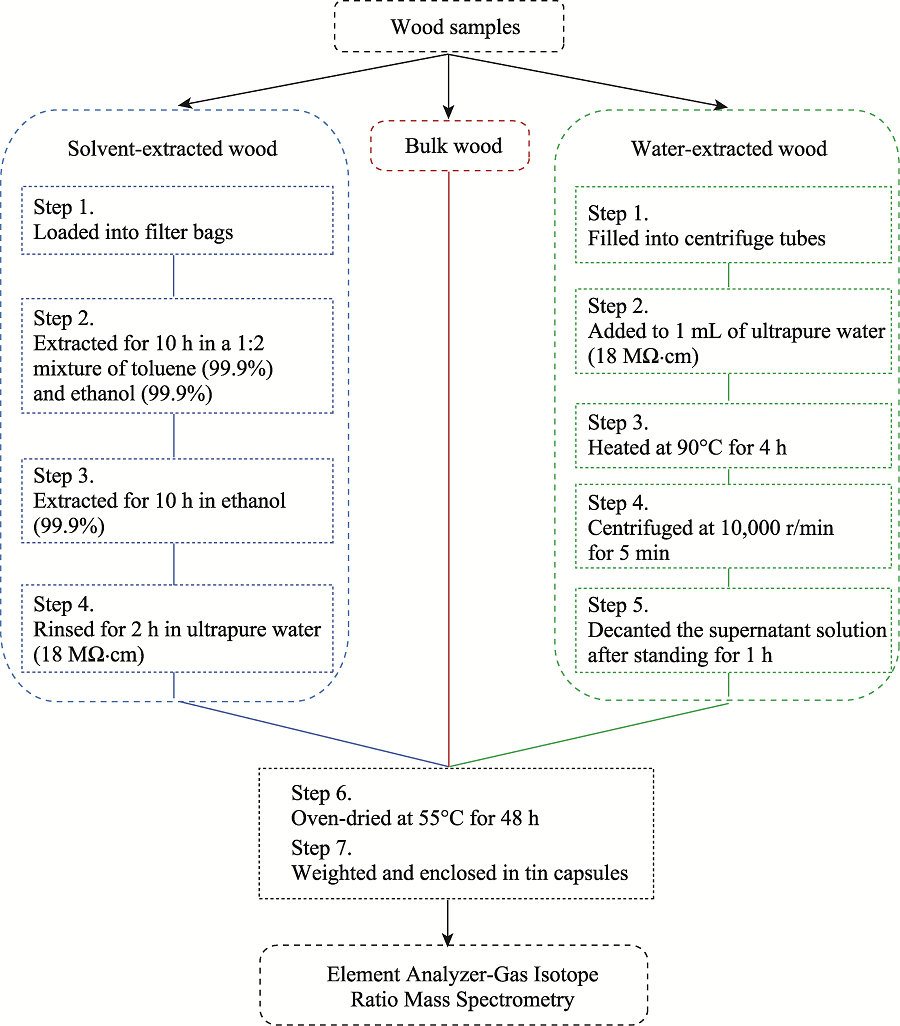
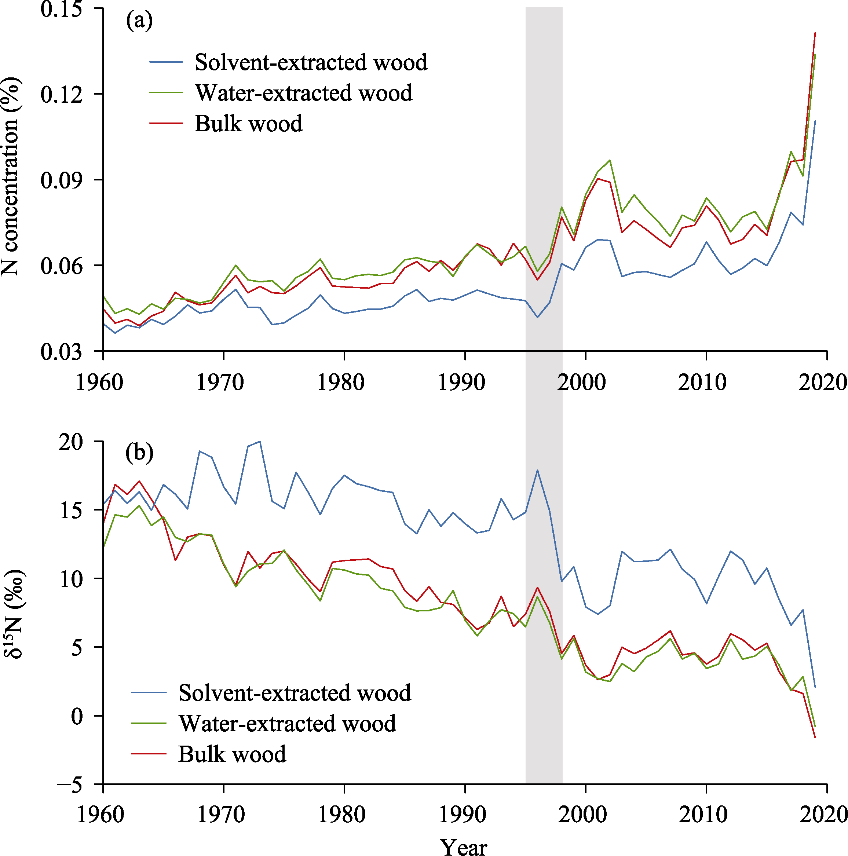
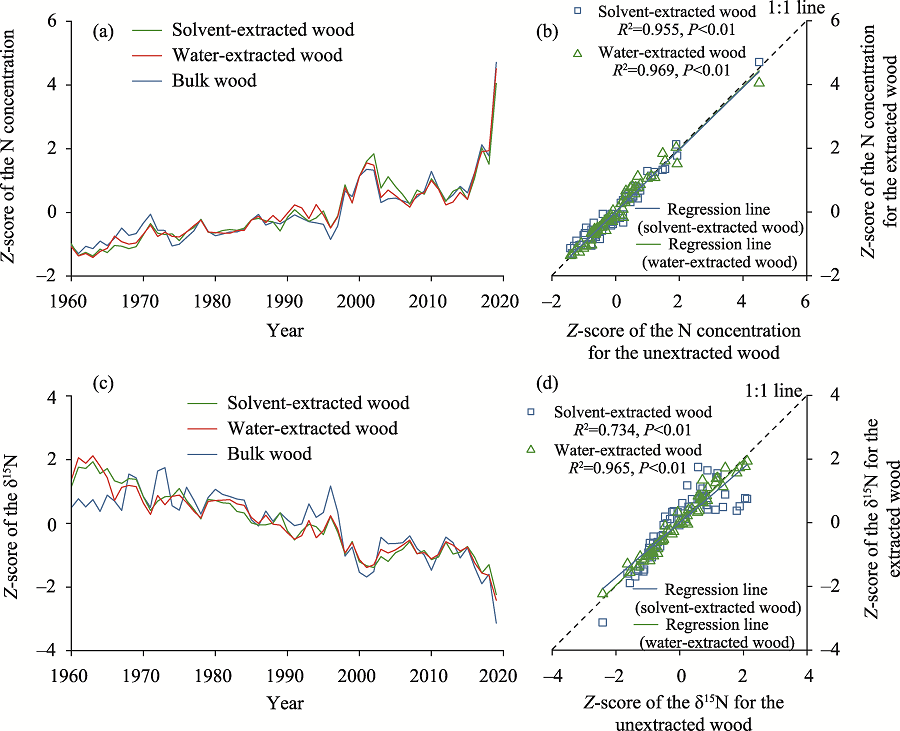
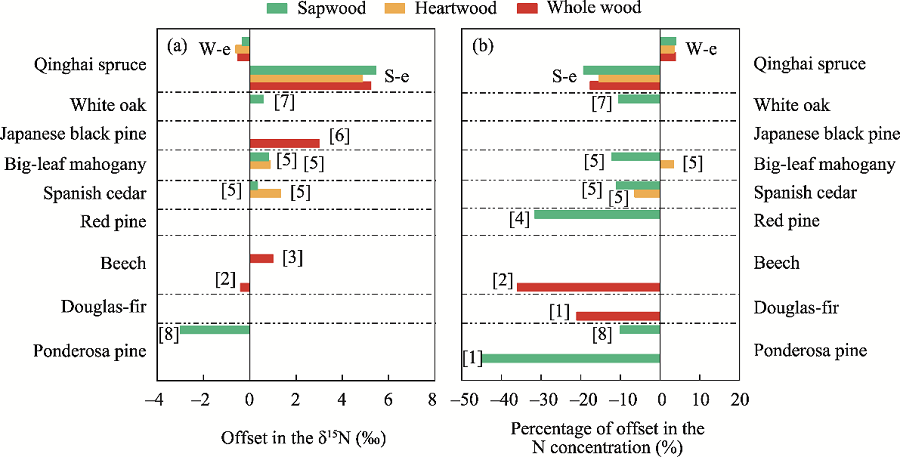
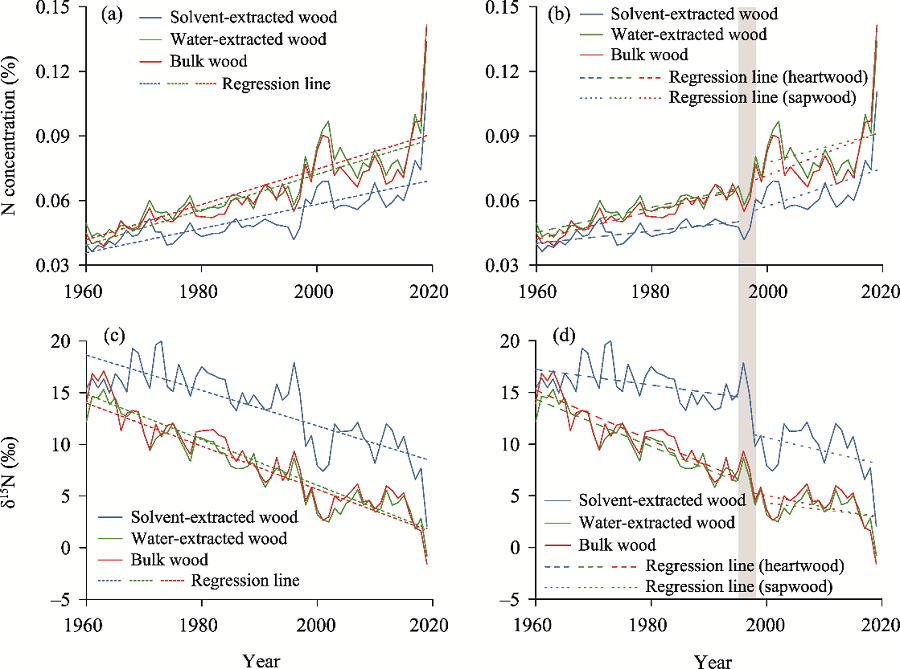
Abstract A knowledge of the tree-ring stable nitrogen isotope ratio (δ15N) can deepen our understanding of forest ecosystem dynamics by indicating the long-term availability, cycling and sources of nitrogen (N). However, the radial mobility of N blurs the interannual variations in the long-term N records. Previous studies of the chemical extraction of tree rings before analysis had produced inconsistent results and it is still unclear whether it is necessary to pre-treat wood samples from specific tree species to remove soluble N compounds before determining the δ15N values. We compared the effects of pre-treatment with organic solvents and hot ultrapure water on the N concentration and δ15N of tree rings from endemic Qinghai spruce (Picea crassifolia) growing in the interior of the central Qilian Mountains, China, during the last 60 a. We assessed the effects of different preparation protocols on the removal of the labile N compounds and investigated the need to pre-treat wood samples before determining the δ15N values of tree rings. Increasing trends of the tree-ring N concentration were consistently observed in both the extracted and unextracted wood samples. The total N removed by extraction with organic solvents was about 17.60%, with a significantly higher amount in the sapwood section (P<0.01). The δ15N values of tree rings decreased consistently from 1960 to 2019 in both the extracted and unextracted wood samples. Extraction with organic solvents increased the δ15N values markedly by about 5.2‰ and reduced the variations in the δ15N series. However, extraction with hot ultrapure water had little effect, with only a slight decrease in the δ15N values of about 0.5‰. Our results showed that the radial pattern in the inter-ring movement of N in Qinghai spruce was not minimized by extraction with either organic solvents or hot ultrapure water. It is unnecessary to conduct hot ultrapure water extraction for the wood samples from Qinghai spruce because of its negligible effect on the removal of the labile N. The δ15N variation trend of tree rings in the unextracted wood samples was not influenced by the heartwood-sapwood transition zone. We suggest that the δ15N values of the unextracted wood samples of the climate-sensitive Qinghai spruce could be used to explore the ecophysiological dynamics while focusing on the long-term variations.
|
|
Received: 12 November 2021
Published: 30 June 2022
|
|
Corresponding Authors:
* LIU Xiaohong (E-mail: liuxh@lzb.ac.cn)
|
|
|
| [1] |
Ajuong E M A, Breese C M. 1997. The roles of extractives on short-term creep in compression parallel to grain of Pai wood (Afzelia africana Smith). Wood and Fiber Science, 29(2): 161-170.
|
|
|
| [2] |
Austin A T, Vitousek P M. 1998. Nutrient dynamics on a precipitation gradient in Hawai'i. Oecologia, 113(4): 519-529.
doi: 10.1007/s004420050405
pmid: 28308032
|
|
|
| [3] |
Bukata A R, Kyser T K. 2005. Response of the nitrogen isotopic composition of tree-rings following tree-clearing and land-use change. Environmental Science and Technology, 39(20): 7777-7783.
doi: 10.1021/es050733p
|
|
|
| [4] |
Bunn A G, Helfield J M, Gerdts J R, et al. 2017. A solvent-based extraction fails to remove mobile nitrogen from western redcedar (Thuja Plicata). Dendrochronologia, 44: 19-21.
doi: 10.1016/j.dendro.2017.03.001
|
|
|
| [5] |
Craine J M, Brookshire E N J, Cramer M D, et al. 2015. Ecological interpretations of nitrogen isotope ratios of terrestrial plants and soils. Plant and Soil, 396: 1-26.
doi: 10.1007/s11104-015-2542-1
|
|
|
| [6] |
Cutter B E, Guyette R P. 1993. Anatomical, chemical and ecological factors affecting tree species choice in dendrochemical studies. Journal of Environmental Quality, 22(3): 611-619.
|
|
|
| [7] |
Doucet A, Savard M M, Bégin C, et al. 2011. Is wood pre-treatment essential for tree-ring nitrogen concentration and isotope analysis?. Rapid Communications Mass Spectrometry, 25(4): 469-475.
doi: 10.1002/rcm.4876
|
|
|
| [8] |
Doucet A, Savard M M, Bégin C, et al. 2012. Tree-ring δ15N values to infer air quality changes at regional scale. Chemical Geology, 320-321: 9-16.
doi: 10.1016/j.chemgeo.2012.05.011
|
|
|
| [9] |
Drake D C, Sheppard P J, Naiman R J, et al. 2011. Relationships between salmon abundance and tree-ring δ15N: three objective tests. Canadian Journal of Forest Research, 41(12): 2423-2432.
doi: 10.1139/x11-172
|
|
|
| [10] |
Elhani S, Lema B F, Zeller B, et al. 2003. Inter-annual mobility of nitrogen between beech rings: a labelling experiment. Annals of Forest Science, 60(6): 503-508.
doi: 10.1051/forest:2003043
|
|
|
| [11] |
Elhani S, Guehl J M, Nys C, et al. 2005. Impact of fertilization on tree-ring δ15N and δ13C in beech stands: a retrospective analysis. Tree Physiology, 25(11): 1437-1446.
doi: 10.1093/treephys/25.11.1437
|
|
|
| [12] |
Emmett B A, Kjonaas O J, Gundersen P, et al. 1998. Natural abundance of 15N in forests across a nitrogen deposition gradient. Forest Ecology and Management, 101(1-3): 9-18.
doi: 10.1016/S0378-1127(97)00121-7
|
|
|
| [13] |
Fengel D, Wegener G. 1989. Wood: Chemistry, Ultrastructure, Reactions. Berlin: De Gruyter, 1-632.
|
|
|
| [14] |
Gerhart L M, McLauchlan K K. 2014. Reconstructing terrestrial nutrient cycling using stable nitrogen isotopes in wood. Biogeochemistry, 120(1-3): 1-21.
doi: 10.1007/s10533-014-9988-8
|
|
|
| [15] |
Gessler A, Ferrio P J, Hommel R, et al. 2014. Stable isotopes in tree rings: towards a mechanistic understanding of isotope fractionation and mixing processes from the leaves to the wood. Tree Physiology, 34(8): 796-818.
doi: 10.1093/treephys/tpu040
pmid: 24907466
|
|
|
| [16] |
Greaver T L, Clark C M, Compton J E, et al. 2016. Key ecological responses to nitrogen are altered by climate change. Nature Climate Change, 6(9): 836-843.
doi: 10.1038/nclimate3088
|
|
|
| [17] |
Guerrieri R, Mencuccini M, Sheppard L J, et al. 2010. The legacy of enhanced N and S deposition as revealed by the combined analysis of δ13C, δ18O and δ15N in tree rings. Global Change Biology, 17(5): 1946-1962.
doi: 10.1111/j.1365-2486.2010.02362.x
|
|
|
| [18] |
Guerrieri R, Vanguelova E, Pitman R, et al. 2020. Climate and atmospheric deposition effects on forest water-use efficiency and nitrogen availability across Britain. Scientific Reports, 10(1): 12418, doi: 10.1038/s41598-020-67562-w.
doi: 10.1038/s41598-020-67562-w
pmid: 32709879
|
|
|
| [19] |
Härdtle W, Niemeyer T, Assmann T, et al. 2013. Long-term trends in tree-ring width and isotope signatures (δ13C, δ15N) of Fagus sylvatica L. on soils with contrasting water supply. Ecosystems, 16(8): 1413-1428.
doi: 10.1007/s10021-013-9692-x
|
|
|
| [20] |
Hart S C, Classen A T. 2003. Potential for assessing long-term dynamics in soil nitrogen availability from variations in δ15N of tree rings. Isotopes in Environmental and Health Studies, 39(1): 15-28.
pmid: 12812252
|
|
|
| [21] |
Hietz P, Duenisch O, Wanek W. 2010. Long-term trends in nitrogen isotope composition and nitrogen concentration in Brazilian rainforest trees suggest changes in nitrogen cycle. Environmental Science and Technology, 44(4): 1191-1196.
doi: 10.1021/es901383g
|
|
|
| [22] |
Högberg P. 1997. Tansley review No. 95 15N natural abundance in soil-plant systems. New Phytologist, 137(2): 179-203.
doi: 10.1046/j.1469-8137.1997.00808.x
pmid: 33863175
|
|
|
| [23] |
Holmes R L. 1983. Computer-assisted quality control in tree-ring dating and measurement. Tree-Ring Bulletin, 43: 69-78.
|
|
|
| [24] |
Jia Y L, Yu G R, Gao Y N, et al. 2016. Global inorganic nitrogen dry deposition inferred from ground- and space-based measurements. Scientific Reports, 6: 19810, doi: 10.1038/srep19810.
doi: 10.1038/srep19810
|
|
|
| [25] |
Jia Y L, Wang Q F, Zhu J X, et al. 2019. A spatial and temporal dataset of atmospheric inorganic nitrogen wet deposition in China (1996-2015). China Scientific Data, 4(1), doi: 10.11922/csdata.2018.0031.z.
doi: 10.11922/csdata.2018.0031.z.
|
|
|
| [26] |
Kwak J H, Lim S S, Park H J, et al. 2009. Relating tree ring chemistry of Pinus densiflora to precipitation acidity in an industrial area of South Korea. Water, Air, and Soil Pollution, 199(1): 95-106.
doi: 10.1007/s11270-008-9862-1
|
|
|
| [27] |
Larry M, Caceres L, Mizota C, et al. 2011. Effects of pre-treatment on the nitrogen isotope composition of Japanese black pine (Pinus thunbergii) tree-rings as affected by high N input. Rapid Communications Mass Spectrometry, 25(21): 3298-3302.
doi: 10.1002/rcm.5227
|
|
|
| [28] |
Li D L, Liu D X. 2000. Climate in Gansu. Beijing: China Meteorological Press, 1-378. (in Chinese)
|
|
|
| [29] |
Liang E Y, Shao X M, Eckstein D, et al. 2006. Topography- and species-dependent growth responses of Sabina Przewalskii and Picea crassifolia to climate on the northeast Tibetan Plateau. Forest Ecology and Management, 236(2): 268-277.
doi: 10.1016/j.foreco.2006.09.016
|
|
|
| [30] |
Mason R E, Craine J M, Lany N K, et al. 2022. Evidence, causes, and consequences of declining nitrogen availability in terrestrial ecosystems. Science, 376(6590), doi: 10.1126/science.abh3767.
doi: 10.1126/science.abh3767
|
|
|
| [31] |
McLauchlan K K, Craine J M, Oswald W W, et al. 2007. Changes in nitrogen cycling during the past century in a northern hardwood forest. Proceedings of the National Academy of Sciences of the United States of America, 104(18): 7466-7470.
|
|
|
| [32] |
McLauchlan K K, Gerhart L M, Battles J J, et al. 2017. Centennial-scale reductions in nitrogen availability in temperate forests of the United States. Scientific Reports, 7: 7856, doi: 10.1038/s41598-017-08170-z.
doi: 10.1038/s41598-017-08170-z
pmid: 28798386
|
|
|
| [33] |
Meerts P. 2002. Mineral nutrient concentrations in sapwood and heartwood: a literature review. Annals of Forest Science, 59(7): 713-722.
doi: 10.1051/forest:2002059
|
|
|
| [34] |
Merrill W, Cowling E B. 1966. Role of nitrogen in wood deterioration: amounts and distribution of nitrogen in tree stems. Canadian Journal of Botany, 44(11): 1555-1580.
doi: 10.1139/b66-168
|
|
|
| [35] |
Mizota C, Caceres M L L, Yamanaka T, et al. 2011. Differential response of two Pinus spp. to avian nitrogen input as revealed by nitrogen isotope analysis for tree rings. Isotopes in Environmental and Health Studies, 47(1): 62-70.
doi: 10.1080/10256016.2011.545126
|
|
|
| [36] |
Mutton D B. 1962. Wood resins. In: Wood Extractives and Their Significance to the Pulp and Paper Industries. New York: Academic Press, 331-363.
|
|
|
| [37] |
Norby R J, De Kauwe M G, Domingues T F, et al. 2016. Model-data synthesis for the next generation of forest free-air CO2 enrichment (FACE) experiments. New Phytologist, 209(1): 17-28.
doi: 10.1111/nph.13593
|
|
|
| [38] |
Ollinger S V, Aber J D, Reich P B, et al. 2002. Interactive effects of nitrogen deposition, tropospheric ozone, elevated CO2 and land use history on the carbon dynamics of northern hardwood forests. Global Change Biology, 8(6): 545-562.
doi: 10.1046/j.1365-2486.2002.00482.x
|
|
|
| [39] |
Pardo L H, Nadelhoffer K J. 2010. Using Nitrogen Isotope Ratios to Assess Terrestrial Ecosystems at Regional and Global Scales. In: Isoscapes. Dordrecht: Springer, 221-249.
|
|
|
| [40] |
Peñuelas J, Estiarte M. 1997. Trends in plant carbon concentration and plant demand for N throughout this century. Oecologia, 109(1): 69-73.
doi: 10.1007/s004420050059
|
|
|
| [41] |
Peñuelas J, Hunt J M, Ogaya R, et al. 2008. Twentieth century changes of tree-ring δ13C at the southern range-edge of Fagus sylvatica: increasing water-use efficiency does not avoid the growth decline induced by warming at low altitudes. Global Change Biology, 14(5): 1076-1088.
doi: 10.1111/j.1365-2486.2008.01563.x
|
|
|
| [42] |
R Core Team. 2022. R: A language and environment for statistical computing. Vienna: R Foundation for Statistical Computing. [2022-05-28]. https://www.R-project.org/.
|
|
|
| [43] |
Robinson D. 2001. δ15N as an integrator of the nitrogen cycle. Trends in Ecology & Evolution, 16(3): 153-162.
doi: 10.1016/S0169-5347(00)02098-X
|
|
|
| [44] |
Rowell R M. 1984. The Chemistry of Solid Wood. Washington: American Chemical Society, 207: 1-614.
|
|
|
| [45] |
Savard M M, Bégin C, Smirnoff A, et al. 2009. Tree-ring nitrogen isotopes reflect anthropogenic NOx emissions and climatic effects. Environmental Science and Technology, 43(3): 604-609.
doi: 10.1021/es802437k
|
|
|
| [46] |
Savard M M, Marion J, Bégin C. 2020. Nitrogen isotopes of individual tree-ring series - The validity of middle- to long-term trends. Dendrochronologia, 62: 125726, doi: 10.1016/j.dendro.2020.125726.
doi: 10.1016/j.dendro.2020.125726
|
|
|
| [47] |
Sheppard P R, Thompson T L. 2000. Effect of extraction on radial variation of nitrogen concentration in tree rings. Journal of Environmental Quality, 29(6): 2037-2042.
|
|
|
| [48] |
Stokes M A, Smiley T L. 1996. An Introduction to Tree-Ring Dating (2nd ed.). Arizona: University of Arizona Press, 1-73.
|
|
|
| [49] |
Tomlinson G, Siegwolf R T W, Buchmann N, et al. 2014. The mobility of nitrogen across tree-rings of Norway spruce (Picea abies L.) and the effect of extraction method on tree-ring δ15N and δ13C values. Rapid Communications Mass Spectrometry, 28(11): 1258-1264.
doi: 10.1002/rcm.6897
|
|
|
| [50] |
Trumper M L, Griffin D, Hobbie S E, et al. 2020. Century-scale wood nitrogen isotope trajectories from an oak savanna with variable fire frequencies. Biogeosciences, 17(18): 4509-4522.
doi: 10.5194/bg-17-4509-2020
|
|
|
| [51] |
van der Sleen P, Zuidema P A, Pons T L. 2017. Stable isotopes in tropical tree rings: theory, methods and applications. Functional Ecology, 31(9): 1674-1689.
doi: 10.1111/1365-2435.12889
|
|
|
| [52] |
Wang K Y, Zeng X M, Liu X H, et al. 2020. Nitrogen rather than streamflow regulates the growth of riparian trees. Chemical Geology, 547(5): 119666, doi: 10.1016/j.chemgeo.2020.119666.
doi: 10.1016/j.chemgeo.2020.119666
|
|
|
| [53] |
Xu W, Luo X S, Pan Y P, et al. 2015. Quantifying atmospheric nitrogen deposition through a nationwide monitoring network across China. Atmospheric Chemistry and Physics, 15(21): 12345-12360.
|
|
|
| [54] |
Yoneyama T, Fujihara S, Yagi K. 1998. Natural abundance of 15N in amino acids and polyamines from leguminous nodules: Unique 15N enrichment in homospermidine. Journal of Experimental Botany, 49(320): 521-526.
doi: 10.1093/jxb/49.320.521
|
|
|
|
Viewed |
|
|
|
Full text
|
|
|
|
|
Abstract
|
|
|
|
|
Cited |
|
|
|
|
| |
Shared |
|
|
|
|
| |
Discussed |
|
|
|
|