| Research article |
|


|
|
|
| Spatiotemporal characteristics and driving mechanisms of land use/land cover (LULC) changes in the Jinghe River Basin, China |
WANG Yinping1, JIANG Rengui1,*( ), YANG Mingxiang2, XIE Jiancang1, ZHAO Yong2, LI Fawen3, LU Xixi4 ), YANG Mingxiang2, XIE Jiancang1, ZHAO Yong2, LI Fawen3, LU Xixi4 |
1State Key Laboratory of Eco-hydraulics in Northwest Arid Region of China, Xi'an University of Technology, Xi'an 710048, China
2State Key Laboratory of Simulation and Regulation of Water Cycle in River Basin, China Institute of Water Resources and Hydropower Research, Beijing 100038, China
3State Key Laboratory of Hydraulic Engineering Simulation and Safety, Tianjin University, Tianjin 300072, China
4Department of Geography, National University of Singapore, Singapore 117570, Singapore |
|
|
|
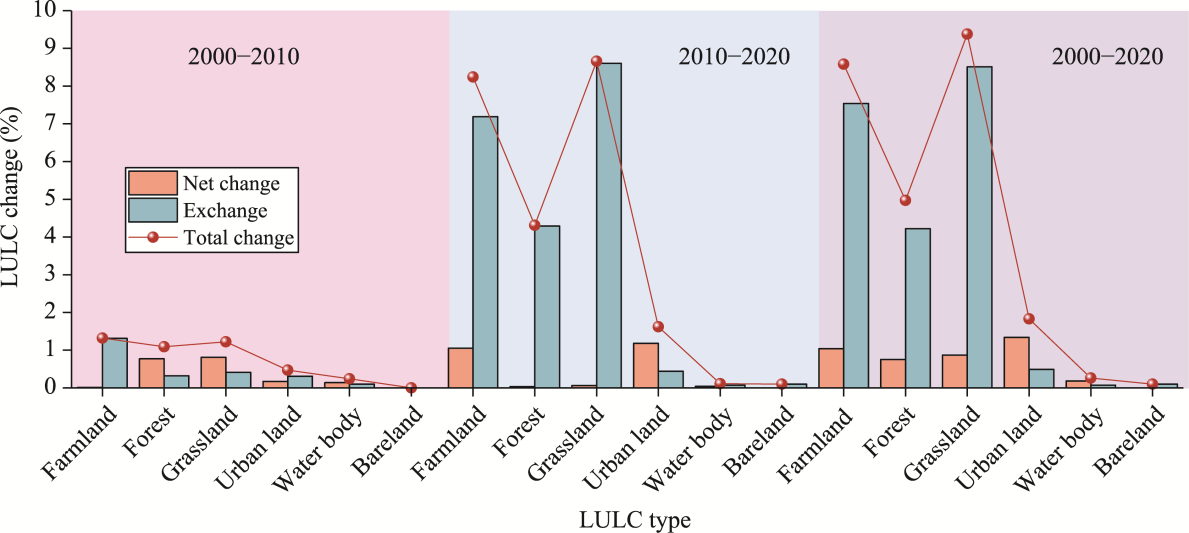
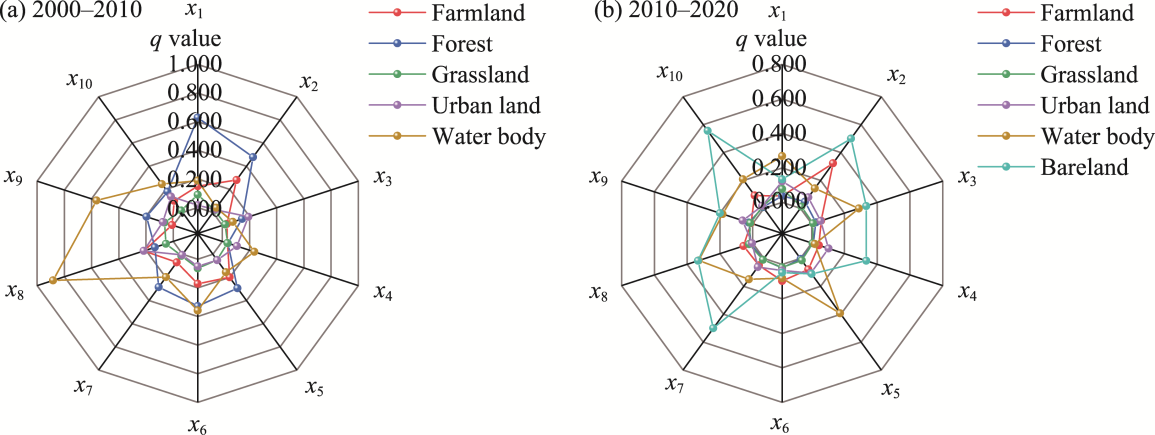
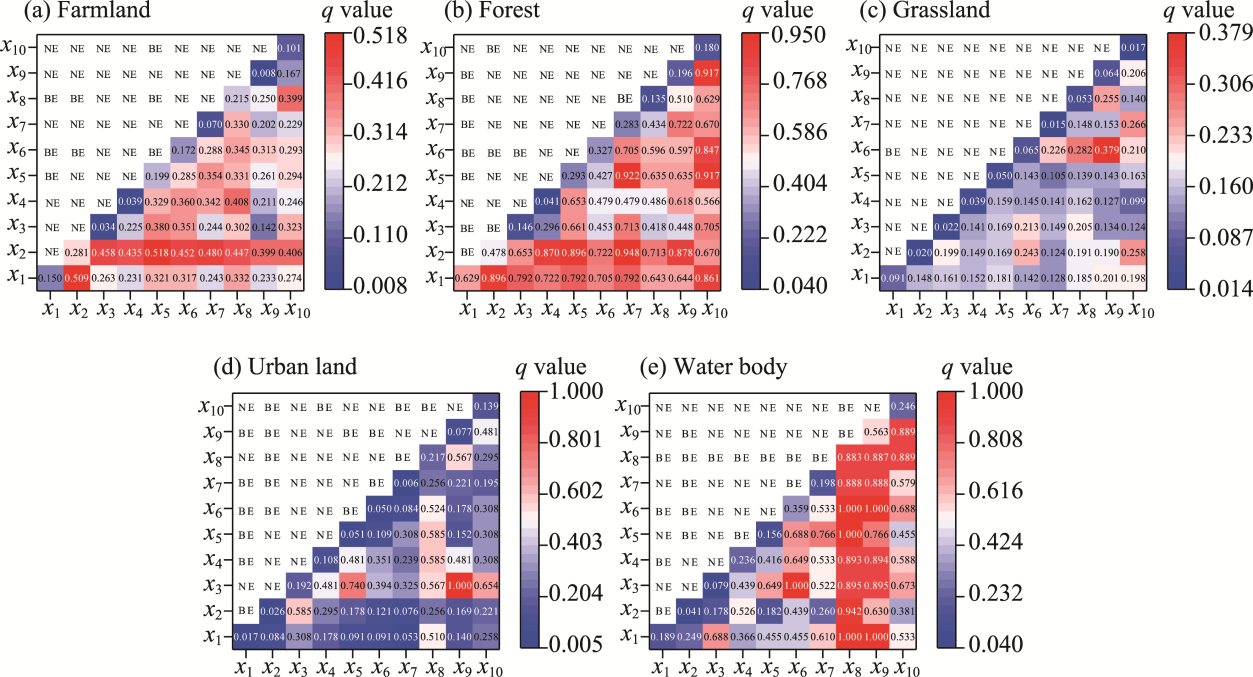
Abstract Understanding the trajectories and driving mechanisms behind land use/land cover (LULC) changes is essential for effective watershed planning and management. This study quantified the net change, exchange, total change, and transfer rate of LULC in the Jinghe River Basin (JRB), China using LULC data from 2000 to 2020. Through trajectory analysis, knowledge maps, chord diagrams, and standard deviation ellipse method, we examined the spatiotemporal characteristics of LULC changes. We further established an index system encompassing natural factors (digital elevation model (DEM), slope, aspect, and curvature), socio-economic factors (gross domestic product (GDP) and population), and accessibility factors (distance from railways, distance from highways, distance from water, and distance from residents) to investigate the driving mechanisms of LULC changes using factor detector and interaction detector in the geographical detector (Geodetector). The key findings indicate that from 2000 to 2020, the JRB experienced significant LULC changes, particularly for farmland, forest, and grassland. During the study period, LULC change trajectories were categorized into stable, early-stage, late-stage, repeated, and continuous change types. Besides the stable change type, the late-stage change type predominated the LULC change trajectories, comprising 83.31% of the total change area. The period 2010-2020 witnessed more active LULC changes compared to the period 2000-2010. The LULC changes exhibited a discrete spatial expansion trend during 2000-2020, predominantly extending from southeast to northwest of the JRB. Influential driving factors on LULC changes included slope, GDP, and distance from highways. The interaction detection results imply either bilinear or nonlinear enhancement for any two driving factors impacting the LULC changes from 2000 to 2020. This comprehensive understanding of the spatiotemporal characteristics and driving mechanisms of LULC changes offers valuable insights for the planning and sustainable management of LULC in the JRB.
|
|
Received: 15 August 2023
Published: 31 January 2024
|
|
Corresponding Authors:
*JIANG Rengui (E-mail: jrengui@163.com)
|
|
|
| [1] |
Alijani Z, Hosseinali F, Biswas A. 2020. Spatio-temporal evolution of agricultural land use change drivers: A case study from Chalous region, Iran. Journal of Environment Management, 262: 110326, doi: 10.1016/j.jenvman.2020.110326.
|
|
|
| [2] |
Asenso Barnieh B, Jia L, Menenti M, et al. 2022. Quantifying spatial reallocation of land use/land cover categories in West Africa. Ecology Indicators, 135: 108556, doi: 10.1016/j.ecolind.2022.108556.
|
|
|
| [3] |
Chen Q, Bi Y Z, Li J F. 2021. Spatial disparity and influencing factors of coupling coordination development of economy-environment-tourism-traffic: A case study in the middle reaches of Yangtze River urban agglomerations. International Journal of Environmental Research and Public Health, 18(15): 7947, doi: 10.3390/ijerph18157947.
|
|
|
| [4] |
Dong S W, Chen Z Y, Gao B B, et al. 2020. Stratified even sampling method for accuracy assessment of land use/land cover classification: A case study of Beijing, China. International Journal of Remote Sensing, 41(16): 6427-6443.
doi: 10.1080/01431161.2020.1739349
|
|
|
| [5] |
Gong W F, Duan X Y, Mao M J, et al. 2022. Assessing the impact of land use and changes in land cover related to carbon storage by linking trajectory analysis and InVEST models in the Nandu River Basin on Hainan Island in China. Frontiers in Environmental Science, 10: 1038752, doi: 10.3389/fenvs.2022.1038752.
|
|
|
| [6] |
Han J J, Wang J P, Chen L, et al. 2021. Driving factors of desertification in Qaidam Basin, China: An 18-year analysis using the geographic detector model. Ecology Indicators, 124: 107404, doi: 10.1016/j.ecolind.2021.107404.
|
|
|
| [7] |
He Q Q, Meng Q, Flatley W, et al. 2022. Examining the effects of agricultural aid on forests in sub-Saharan Africa: A causal analysis based on remotely sensed data of Sierra Leone. Land, 11(5): 668, doi: 10.3390/land11050668.
|
|
|
| [8] |
Heidarlou H B, Shafiei A B, Erfanian M, et al. 2020. Underlying driving forces of forest cover changes due to the implementation of preservation policies in Iranian northern Zagros forests. International Forestry Review, 22(2): 241-256.
doi: 10.1505/146554820829403531
|
|
|
| [9] |
Helbich M, Yao Y, Liu Y, et al. 2019. Using deep learning to examine street view green and blue spaces and their associations with geriatric depression in Beijing, China. Environment International, 126: 107-117.
doi: S0160-4120(18)32539-X
pmid: 30797100
|
|
|
| [10] |
Huang C L, Yang Q K, Huang W D. 2021. Analysis of the spatial and temporal changes of NDVI and its driving factors in the Wei and Jing River basins. International Journal of Environmental Research and Public Health, 18(22): 11863, doi: 10.3390/ijerph182211863.
|
|
|
| [11] |
Ji L, Duan K Q. 2019. What is the main driving force of hydrological cycle variations in the semiarid and semi-humid Weihe River Basin, China? Science of the Total Environment, 684: 254-264.
doi: 10.1016/j.scitotenv.2019.05.333
|
|
|
| [12] |
Ji X L, Sun Y L, Guo W, et al. 2023. Land use and habitat quality change in the Yellow River Basin: A perspective with different CMIP6-based scenarios and multiple scales. Journal of Environmental Management, 345: 118729, doi: 10.1016/j.jenvman.2023.118729.
|
|
|
| [13] |
Jiang C, Xiong L H, Wang D B, et al. 2015. Separating the impacts of climate change and human activities on runoff using the Budyko-type equations with time-varying parameters. Journal of Hydrology, 522: 326-338.
doi: 10.1016/j.jhydrol.2014.12.060
|
|
|
| [14] |
Jiang R G, Wang Y P, Xie J C, et al. 2019. Assessment of extreme precipitation events and their teleconnections to El Nino Southern Oscillation, a case study in the Wei River Basin of China. Atmosphere Research, 218: 372-384.
|
|
|
| [15] |
Kayitesi N M, Guzha A C, Mariethoz G. 2022. Impacts of land use land cover change and climate change on river hydro-morphology—a review of research studies in tropical regions. Journal of Hydrology, 615: 128702, doi: 10.1016/j.jhydrol.2022.128702.
|
|
|
| [16] |
Lefever D W. 1926. Measuring geographic concentration by means of the standard deviational ellipse. American Journal of Sociology, 32(1): 88-94.
doi: 10.1086/214027
|
|
|
| [17] |
Li J, Jiang Z, Miao H, et al. 2022. Identification of cultivated land change trajectory and analysis of its process characteristics using time-series Landsat images: A study in the overlapping areas of crop and mineral production in Yanzhou City, China. Science of the Total Environment, 806: 150318, doi: 10.1016/j.scitotenv.2021.150318.
|
|
|
| [18] |
Liu S L, Dong Y H, Wang F F, et al. 2022. Priority area identification of ecological restoration based on land use trajectory approach—Case study in a typical karst watershed. Frontiers in Environmental Science, 10: 1011755, doi: 10.3389/fenvs.2022.1011755.
|
|
|
| [19] |
Luo J, Xin L J, Liu F G, et al. 2022. Study of the intensity and driving factors of land use/cover change in the Yarlung Zangbo River, Nyang Qu River, and Lhasa River region, Qinghai-Tibet Plateau of China. Journal of Arid Land, 14(4): 411-425.
doi: 10.1007/s40333-022-0093-x
|
|
|
| [20] |
Lyu J Q, Yin S S, Sun Y T, et al. 2023. Flood runoff simulation under changing environment, based on multiple satellite data in the Jinghe River Basin of the Loess Plateau, China. Remote Sensing, 15(3): 550, doi: 10.3390/rs15030550.
|
|
|
| [21] |
Niu H P, Zhao X M, Xiao D Y, et al. 2022. Evolution and influencing factors of landscape pattern in the Yellow River Basin (Henan Section) due to land use changes. Water, 14(23): 3872, doi: 10.3390/w14233872.
|
|
|
| [22] |
Schirpke U, Tasser E, Borsky S, et al. 2023. Past and future impacts of land-use changes on ecosystem services in Austria. Journal of Environmental Management, 345: 118728, doi: 10.1016/j.jenvman.2023.118728.
|
|
|
| [23] |
Wang D C, Gong J H, Chen L D, et al. 2012. Spatio-temporal pattern analysis of land use/cover change trajectories in Xihe watershed. International Journal of Applied Earth Observation and Geoinformation, 14(1): 12-21.
doi: 10.1016/j.jag.2011.08.007
|
|
|
| [24] |
Wang D C, Sang M Q, Huang Y, et al. 2019a. Trajectory analysis of agricultural lands occupation and its decoupling relationships with the growth rate of non-agricultural GDP in the Jing-Jin-Tang region, China. Environment Development and Sustainability, 21(2): 799-815.
doi: 10.1007/s10668-017-0061-3
|
|
|
| [25] |
Wang H, Liu G H, Li Z S, et al. 2018. Assessing the driving forces in vegetation dynamics using net primary productivity as the indicator: A case study in Jinghe River Basin in the Loess Plateau. Forests, 9(7): 374, doi: 10.3390/f9070374.
|
|
|
| [26] |
Wang J F, Li X H, Christakos G, et al. 2010. Geographical detectors-based health risk assessment and its application in the neural tube defects study of the Heshun Region, China. International Journal of Geographical Information Science, 24(1): 107-127.
doi: 10.1080/13658810802443457
|
|
|
| [27] |
Wang S, Zhang Q, Yang T, et al. 2019b. River health assessment: Proposing a comprehensive model based on physical habitat, chemical condition and biotic structure. Ecology Indicators, 103: 446-460.
|
|
|
| [28] |
Wang X J, Liu G X, Xiang A C, et al. 2023. Terrain gradient response of landscape ecological environment to land use and land cover change in the hilly watershed in South China. Ecology Indicators, 146: 109797, doi: 10.1016/j.ecolind.2022.109797.
|
|
|
| [29] |
Wang Y P, Jiang R G, Xie J C, et al. 2019c. Soil and Water Assessment Tool (SWAT) model: A systemic review. Journal of Coastal Research, 93(SI): 22-30.
doi: 10.2112/SI93-004.1
|
|
|
| [30] |
Wang Y P, Jiang R G, Xie J C, et al. 2022. Bias correction, historical evaluations, and future projections of climate simulations in the Wei River Basin using CORDEX-EA. Theoretical and Applied Climatology, 150(1-2): 135-153.
doi: 10.1007/s00704-022-04157-7
|
|
|
| [31] |
Wu C X, Qiu D X, Gao P, et al. 2022a. Application of the InVEST model for assessing water yield and its response to precipitation and land use in the Weihe River Basin, China. Journal of Arid Land, 14(4): 426-440.
doi: 10.1007/s40333-022-0013-0
|
|
|
| [32] |
Wu J Y, Luo J G, Zhang H, et al. 2022b. Projections of land use change and habitat quality assessment by coupling climate change and development patterns. Science of the Total Environment, 847: 157491, doi: 10.1016/j.scitotenv.2022.157491.
|
|
|
| [33] |
Xia N, Hai W Y, Tang M Y, et al. 2023. Spatiotemporal evolution law and driving mechanism of production-living-ecological space from 2000 to 2020 in Xinjiang, China. Ecology Indicators, 154: 110807, doi: 10.1016/j.ecolind.2023.110807.
|
|
|
| [34] |
Xu B, Qi B, Ji K, et al. 2022a. Emerging hot spot analysis and the spatial-temporal trends of NDVI in the Jing River Basin of China. Environmental Earth Sciences, 81(2): 55, doi: 10.1007/s12665-022-10175-5.
|
|
|
| [35] |
Xu B C, Pan J H. 2022. Simulation and measurement of soil conservation service flow in the Loess Plateau: A case study for the Jinghe River Basin, Northwestern China. Ecological Indicators, 141: 109072, doi: 10.1016/j.ecolind.2022.109072.
|
|
|
| [36] |
Xu C, Jiang Y N, Su Z H, et al. 2022b. Assessing the impacts of Grain-for-Green Programme on ecosystem services in Jinghe River basin, China. Ecology Indicators, 137: 108757, doi: 10.1016/j.ecolind.2022.108757.
|
|
|
| [37] |
Xu D, Hou G L. 2019. The spatiotemporal coupling characteristics of regional urbanization and its influencing factors: Taking the Yangtze River Delta as an example. Sustainability, 11(3): 822, doi: 10.3390/su11030822.
|
|
|
| [38] |
Yang H F, Zhong X N, Deng S Q, et al. 2022. Impact of LUCC on landscape pattern in the Yangtze River Basin during 2001-2019. Ecological Informatics, 69: 101631, doi: 10.1016/j.ecoinf.2022.101631.
|
|
|
| [39] |
Yang J, Xie B P, Zhang D G, et al. 2021. Climate and land use change impacts on water yield ecosystem service in the Yellow River Basin, China. Environmental Earth Sciences, 80(3): 72, doi: 10.1007/s12665-020-09277-9.
|
|
|
| [40] |
Yu Y P, Yu P T, Wang Y H, et al. 2023. Natural revegetation has dominated annual runoff reduction since the Grain for Green Program began in the Jing River Basin, Northwest China. Journal of Hydrology, 625: 129978, doi: 10.1016/j.jhydrol.2023.129978.
|
|
|
| [41] |
Zhai H, Lv C Q, Liu W Z, et al. 2021. Understanding spatio-temporal patterns of land use/land cover change under urbanization in Wuhan, China, 2000-2019. Remote Sensing, 13(16): 3331, doi: 10.3390/rs13163331.
|
|
|
| [42] |
Zhan D S, Kwan M P, Zhang W Z, et al. 2018. The driving factors of air quality index in China. Journal of Cleaner Production, 197: 1342-1351.
doi: 10.1016/j.jclepro.2018.06.108
|
|
|
| [43] |
Zhang K L, Feng R R, Zhang Z C, et al. 2022. Exploring the driving factors of remote sensing ecological index changes from the perspective of geospatial differentiation: A case study of the Weihe River Basin, China. International Journal of Environmental Research and Public Health, 19(17): 10930, doi: 10.3390/ijerph191710930.
|
|
|
| [44] |
Zhang Z, Hu B Q, Jiang W G, et al. 2021. Identification and scenario prediction of degree of wetland damage in Guangxi based on the CA-Markov model. Ecology Indicators, 127: 107764, doi: 10.1016/j.ecolind.2021.107764.
|
|
|
| [45] |
Zhao Z Z, Tang X J, Wang C, et al. 2023. Analysis of the spatial and temporal evolution of the GDP in Henan Province based on nighttime light data. Remote Sensing, 15(3): 716, doi: 10.3390/rs15030716.
|
|
|
| [46] |
Zhou C S, Chen J, Wang S J. 2018. Examining the effects of socioeconomic development on fine particulate matter (PM2.5) in China's cities using spatial regression and the geographical detector technique. Science of the Total Environment, 619-620: 436-445.
doi: 10.1016/j.scitotenv.2017.11.124
|
|
|
| [47] |
Zhou Q M, Li B L, Kurban A. 2008. Spatial pattern analysis of land cover change trajectories in Tarim Basin, northwest China. International Journal of Remote Sensing, 29(19): 5495-5509.
doi: 10.1080/01431160802060938
|
|
|
| [48] |
Zhou X, Wu D, Li J F, et al. 2022. Cultivated land use efficiency and its driving factors in the Yellow River Basin, China. Ecology Indicators, 144: 109411, doi: 10.1016/j.ecolind.2022.109411.
|
|
|
| [49] |
Zhu Z Y, Dai Z Z, Li S L, et al. 2022. Spatiotemporal evolution of non-grain production of cultivated land and its underlying factors in China. International Journal of Environmental Research and Public Health, 19(13): 8210, doi: 10.3390/ijerph19138210.
|
|
|
| [50] |
Zomlot Z, Verbeiren B, Huysmans M, et al. 2017. Trajectory analysis of land use and land cover maps to improve spatial-temporal patterns, and impact assessment on groundwater recharge. Journal of Hydrology, 554: 558-569.
doi: 10.1016/j.jhydrol.2017.09.032
|
|
|
|
Viewed |
|
|
|
Full text
|
|
|
|
|
Abstract
|
|
|
|
|
Cited |
|
|
|
|
| |
Shared |
|
|
|
|
| |
Discussed |
|
|
|
|